Abstract
The exocyst is an evolutionarily conserved octameric protein complex that mediates the tethering of post-Golgi secretory vesicles to the plasma membrane during exocytosis and is implicated in many cellular processes such as cell polarization, cytokinesis, ciliogenesis and tumor invasion. Using cryo-EM and chemical cross-linking MS (CXMS), we solved the structure of the Saccharomyces cerevisiae exocyst complex at an average resolution of 4.4 Å. Our model revealed the architecture of the exocyst and led to the identification of the helical bundles that mediate the assembly of the complex at its core. Sequence analysis suggests that these regions are evolutionarily conserved across eukaryotic systems. Additional cell biological data suggest a mechanism for exocyst assembly that leads to vesicle tethering at the plasma membrane.
🔬 Techniques
🔭 Microscopes
🧬 Organisms
💻 Software
✨ Fluorophores
🧪 Sample Preparation
🏭 Microscope Brands
🧪 Reagent Suppliers
📷 Detectors
🔎 Objectives
💻 Software Details
💾 Data Repositories
🏛️ Research Organizations (ROR)
Affiliated research institutions:
📋 Methods
ONLINE MATERIALS AND METHODS Yeast strains and plasmids
The budding yeast Saccharomyces cerevisiae strains and plasmids used in this study are listed in Supplementary Table 2 . To integrate SEC3-GFP and sec3(Δ621–710)-GFP into the TRP1 locus with SEC3 promoter, pG215 and pG1980 were digested with SnaBI and transformed into the sec3Δ strain (GY2624). Purification of the yeast exocyst complex 33 liters of yeast culture was grown in YPD medium at 30 °C for 10–14 hours to an OD 600 of ~2.5. Cells were pelleted through centrifugation at 6,000 g for 8 min, and washed once with ddH 2 O. Normally, ~150 g of yeast cells were obtained from the culture. The yeast cells were resuspended in 40 ml (~1/4 (v/w) of the 5 × lysis buffer containing 50 mM HEPES pH 7.4, 750 mM NaCl, 0.5% NP-40, 5 mM EDTA and 50% glycerol and drop-frozen in liquid nitrogen. The cells were then disrupted into powders by SPEX 6870 Freezer Mill. The frozen powder was melted by stirring under cold water bath. Protease inhibitors and 2 mM DTT was added during the melting process. The cell lysate was then subjected to centrifugation at 35,000 g for 30 min, yielding ~100 ml supernatant. IgG Dynabeads were prepared as previously described 15 . 1 ml Dynabeads suspension was added to the supernatant and incubated at 4 °C for 3–6 hours. After extensive wash by a buffer containing 10 mM HEPES pH 7.4, 500 mM NaCl, 0.1% NP-40, 1 mM EDTA, 10% glycerol and 2 mM DTT, proteins were released by TEV protease cleavage for 1.5 hours at 4 °C in 0.5 ml wash buffer containing 150 mM NaCl. The eluent was then concentrated to a total volume of 45 µl and applied to a Superose 6 (3.2/300) column (GE Healthcare) with running buffer containing 10 mM HEPES pH 7.4, 150 mM NaCl, 2mM DTT. Peak fractions were collected for cross-linking mass spectrometry and Cryo-EM sample preparation. Chemical Cross-linking mass spectroscopy (CXMS) For CXMS, approximately 10 µg of purified exocyst complex was crosslinked at 25 °C with 0.25, 0.5, 1 mM DSS and BS 3 for 1 hour, or with 2 mM EDC plus 3 mM sulfo-NHS for 2 hours. The reactions were quenched with 20 mM NH 4 HCO 3 or 10 mM hydroxylamine, respectively. Proteins were precipitated with ice-cold acetone, resuspended in 8 M urea, 100 mM Tris pH 8.5, and then digested by trypsin (Promega, Inc.) in 2 M urea, 100 mM Tris (pH 8.5). The LC-MS/MS analysis was performed on an Easy-nLC 1000 II HPLC (Thermo Fisher Scientific) coupled to a Q-Exactive HF mass spectrometer (Thermo Fisher Scientific). Peptides were loaded on a pre-column (75 µm ID, 6 cm long, packed with ODS-AQ 120 Å–10 µm beads from YMC Co., Ltd.) and further separated on an analytical column (75 µm ID, 12 cm long, packed with Luna C18 1.9 µm 100 Å resin from Welch Materials) with a linear reverse-phase gradient from 100% buffer A (0.1% formic acid in H 2 O) to 30% buffer B (0.1% formic acid in acetonitrile) in 56 min at a flow rate of 200 nl/min. The top 15 most intense precursor ions from each full scan (resolution 60,000) were isolated for HCD MS2 (resolution 15,000; normalized collision energy 27) with a dynamic exclusion time of 30s. Precursors with 1+, 2+, 7+ or above, or unassigned charge states were excluded. The pLink software was used to identify cross-linked peptides with precursor mass accuracy at 20 ppm, fragment ion mass accuracy at 20 ppm, and the results were filtered by applying a 5% FDR cutoff at the spectral level and then an E-value cutoff at 0.001 51 .
Show full methods section
ONLINE MATERIALS AND METHODS Yeast strains and plasmids
The budding yeast Saccharomyces cerevisiae strains and plasmids used in this study are listed in Supplementary Table 2 . To integrate SEC3-GFP and sec3(Δ621–710)-GFP into the TRP1 locus with SEC3 promoter, pG215 and pG1980 were digested with SnaBI and transformed into the sec3Δ strain (GY2624). Purification of the yeast exocyst complex 33 liters of yeast culture was grown in YPD medium at 30 °C for 10–14 hours to an OD 600 of ~2.5. Cells were pelleted through centrifugation at 6,000 g for 8 min, and washed once with ddH 2 O. Normally, ~150 g of yeast cells were obtained from the culture. The yeast cells were resuspended in 40 ml (~1/4 (v/w) of the 5 × lysis buffer containing 50 mM HEPES pH 7.4, 750 mM NaCl, 0.5% NP-40, 5 mM EDTA and 50% glycerol and drop-frozen in liquid nitrogen. The cells were then disrupted into powders by SPEX 6870 Freezer Mill. The frozen powder was melted by stirring under cold water bath. Protease inhibitors and 2 mM DTT was added during the melting process. The cell lysate was then subjected to centrifugation at 35,000 g for 30 min, yielding ~100 ml supernatant. IgG Dynabeads were prepared as previously described 15 . 1 ml Dynabeads suspension was added to the supernatant and incubated at 4 °C for 3–6 hours. After extensive wash by a buffer containing 10 mM HEPES pH 7.4, 500 mM NaCl, 0.1% NP-40, 1 mM EDTA, 10% glycerol and 2 mM DTT, proteins were released by TEV protease cleavage for 1.5 hours at 4 °C in 0.5 ml wash buffer containing 150 mM NaCl. The eluent was then concentrated to a total volume of 45 µl and applied to a Superose 6 (3.2/300) column (GE Healthcare) with running buffer containing 10 mM HEPES pH 7.4, 150 mM NaCl, 2mM DTT. Peak fractions were collected for cross-linking mass spectrometry and Cryo-EM sample preparation. Chemical Cross-linking mass spectroscopy (CXMS) For CXMS, approximately 10 µg of purified exocyst complex was crosslinked at 25 °C with 0.25, 0.5, 1 mM DSS and BS 3 for 1 hour, or with 2 mM EDC plus 3 mM sulfo-NHS for 2 hours. The reactions were quenched with 20 mM NH 4 HCO 3 or 10 mM hydroxylamine, respectively. Proteins were precipitated with ice-cold acetone, resuspended in 8 M urea, 100 mM Tris pH 8.5, and then digested by trypsin (Promega, Inc.) in 2 M urea, 100 mM Tris (pH 8.5). The LC-MS/MS analysis was performed on an Easy-nLC 1000 II HPLC (Thermo Fisher Scientific) coupled to a Q-Exactive HF mass spectrometer (Thermo Fisher Scientific). Peptides were loaded on a pre-column (75 µm ID, 6 cm long, packed with ODS-AQ 120 Å–10 µm beads from YMC Co., Ltd.) and further separated on an analytical column (75 µm ID, 12 cm long, packed with Luna C18 1.9 µm 100 Å resin from Welch Materials) with a linear reverse-phase gradient from 100% buffer A (0.1% formic acid in H 2 O) to 30% buffer B (0.1% formic acid in acetonitrile) in 56 min at a flow rate of 200 nl/min. The top 15 most intense precursor ions from each full scan (resolution 60,000) were isolated for HCD MS2 (resolution 15,000; normalized collision energy 27) with a dynamic exclusion time of 30s. Precursors with 1+, 2+, 7+ or above, or unassigned charge states were excluded. The pLink software was used to identify cross-linked peptides with precursor mass accuracy at 20 ppm, fragment ion mass accuracy at 20 ppm, and the results were filtered by applying a 5% FDR cutoff at the spectral level and then an E-value cutoff at 0.001 51 .
EM data acquisition and processing
For negative staining EM sample preparation, 4 µl of purified exocyst complex at a concentration of ~0.02 mg/ml was applied to a glow-discharged holy carbon EM grid covered with a thin layer of carbon film (Zhongjingkeyi Technology Co. Ltd). The grid was then stained by 2% (w/v) uranyl acetate solution for 1 min, dried in air and stored at room temperature. For EM data collection, the negative-stained grid was transferred into an FEI Tecnai Spirit Bio-TWIN electron microscope operated at an acceleration voltage of 120kV to manually collect micrographs with random conical tilt strategy 52 , using a Gantan US4000 4k×4k CCD camera. Samples for cryo-EM were prepared with a Vitrobot Mark IV (FEI Company) under 100% humidity at 8 °C. 3.5 µl of 0.3 mg/ml untreated exocyst solution, or ~0.12 mg/ml of exocyst treated with freshly prepared glutaraldehyde at a final concentration of 0.0025% for 20 min on ice, was applied to a glow-discharged Quantifoil grid (Quantifoil Au R1.2/1.3), blotted for 2 seconds, and plunged into liquid ethane cooled by liquid nitrogen. To obtain enough particles with sufficient views for 3D reconstitution, we prepared cryo-EM specimens of exocyst complexes purified from several strains with different subunits fused to the TAP or ProA tag ( Fig 1a and Supplementary Fig. 2a ). The cryo-EM grids were transferred to a Titan Krios (FEI Company) electron microscope operated at 300kV and equipped with a direct electron counting device (Gatan K2 Summit). Using UCSF-Image4 interface 53 , we collected electron micrographs of the specimens with a nominal magnification of 22,500 in super-resolution mode on the K2 Summit camera as dose-fractionated movie stacks. Each movie stack contained 32 frames with a dose rate of about 8.25 counts per second per physical pixel (~6.25 e − /sec/Å 2 ), resulting in a total exposure time of 8s and 50 e- per stack. A total of 6,466 cryo-EM movie stacks with defocus values ranging from 2~3 µm were collected, aligned and summed using whole-image motion correction 54 , 55 with a binned pixel size of 1.30654 Å. Image processing 30 pairs of un-tilt (0°) – tilt (50°) micrographs were collected for the negative-stained exocyst complexes, from which 4516 tilt-pair particles were picked by EMAN2 56 subroutine e2RCTboxer.py in an interactive RCT-boxing mode. A low-resolution 3D map was then generated by SPIDER 57 and served as an initial model for cryo-EM 3D refinement. For the cryo-EM dataset, the movie stacks were first corrected for motion into summed images using MotionCorr program 54 . The defocus value of each image was determined by CTFFIND3 58 . From the summed micrographs, about 900,000 particles were semi-auto-picked by RELION1.4 59 . After reference-free 2D classification and 3D classification, through which contaminants and defective particles were removed, 343,342 particles were used for further processing ( Supplementary Fig. 1 ). The particles were classified into ten 3D classes to elucidate possible conformational variation; a density map with an overall resolution of 9.0 Å was obtained by auto-refinement, which was further improved to 7.35 Å by RELION post-processing and 6.75Å with body mask refinement. In parallel, we performed 5×5 fraction-image motion correction with MotionCor2 60 combined with dose weighting and re-extracted the 343,342 particles from the original stacks. This dataset was refined with post-processing to generate a reconstruction with an overall resolution of 5.5 Å. We also applied distortion magnification correction 61 , 62 and a second round body mask to the body-masked 7.02 Å map and obtained a map at 4.35 Å resolution. We further performed local mask refinement for the head and tail parts of the complex to improve the local density quality at 6.2 Å, and 4.65 Å, respectively. These maps were integrated in Chimera 63 for model building and figure presentation. Local resolution variations were estimated using ResMap 64 . Overall resolutions of the maps were based on the gold-standard FSC 0.143 criterion 65 .
Model building and refinement
We used a combination approach with the available crystal structures of some of the subunits and their homologues, the secondary and tertiary structural prediction, and the CXMS results to build models of the cryo-EM maps ( Supplementary Fig. 3 , Supplementary Video 1 ). Model building was initiated with the crystal structures of yeast exocyst subunits, Sec6 (a.a.411–805) (PDB code: 2FJI), Exo70 (a.a.67–623) (PDB code: 2B1E) and Exo84 (a.a.525–753) (PDB code: 2D2S). Exo84 (a.a.525–753) was fit into the map unambiguously as a rigid body by Situs 66 ( Supplementary Fig. 4a ). Exo70 (a.a.67–623) is an extended helical bundle that couldn’t be well-docked into the map as a whole body. Since Exo70 helical bundle has the tendency to bend in the middle 37 , we split it into two halves: Exo70 (a.a.67–344) and Exo70 (a.a.345–623). The two halves fit into the map with high degree of agreement as rigid bodies, with the break sites close enough to form a peptide bond ( Supplementary Fig. 4b ). Based on the intermolecular crosslinking pairs between Exo70 and Sec6, we depicted Sec6 (a.a.411–805) proximal to the N-terminus of Exo70 (a.a.67–623) in the cryo-EM map ( Supplementary Fig. 4c ). The Sec6 model fits in the corresponding density very well. At this point, we have docked all of the known crystal structures of the yeast exocyst subunits into the map. Next, we fit the map with predicted tertiary structures obtained from homologue modelling. The tertiary structure of Sec10 (a.a.234–867) was predicted with Swiss-Model 67 based on the atomic model of Zebrafish Sec10 (a.a.195–708) (PDB code: 5H11). After the loops of a.a.279–319 and a.a.456–568 were pruned, the protein was fit into the right edge of the back layer ( Supplementary. 4d ). For better fitting, it was split into two halves between Arg432 and Ser433 and docked into the map separately. The PH domain of Exo84 (a.a.346–470) and the C-terminal portion of Sec15 (a.a.482–896) were predicted by PHYRE2 68 based on the crystal structures of rat Exo84 (PDB code: 1ZC4) and Drosophila Sec15 (PDB code: 2A2F), and docked into the map ( Supplementary Fig. 4e–f ). From the above docked atomic models, we performed manual extension of the C-alpha peptides of the corresponding proteins following the map density connectivity by Coot 69 . We started with helices assignment based on the secondary structure predictions ( Supplementary Fig. 7 ) and then modeled the connecting loops guided by a lower threshold of the map showing the densities. Wherein a loop was too long and not enough density was visualized, the corresponding region was left un-modeled. Using such a strategy, near full-length Sec6, Sec10, Sec15 and Exo70, as well as Exo84 (a.a.170–753) were modeled in the map ( Supplementary Fig. 4g–k ). To build the models of Sec5 and Sec8, we first identified their densities based on several cross-linked residue pairs. Pairs Exo84(725)-Sec5(961) and Exo84(731)-Sec5(961) revealed that the C-terminal residues of Sec5 were adjacent to the C-terminal end of Exo84. This information, together with the pair Exo70(167)–Sec5(228), assigned the left branch of the front layer to Sec5 ( Supplementary. 5a ). Similarly, pairs Exo84(707)-Sec8(893), Exo84(343)-Sec8(238) and Sec6(237)-Sec8(125) indicated that the long axle of the front layer is Sec8 ( Supplementary. 5b ). We thus manually modeled Sec5 and Sec8 from their C- to N-terminus. After the above modeling, the remaining density corresponding to Arm I was assigned to Sec3 with one end of the density located near Exo70 and the other end reaching to the middle of Sec10. The crosslink pairs Exo70(228)-Sec3(613) and Sec10(515)-Sec3(1323) suggested that Sec3 extends from the first end with Lys613 to the second one with Lys1323. Based on the above information and the density shape, we manually modeled the Sec3(612–1332) into the map ( Supplementary Fig. 5c ). The very C-terminus of Sec3 starting from Phe1040 cannot be modeled precisely due to the poor density. Since the resolution of 4.4 Å is not sufficient for clear side chain modeling, all of the docked tertiary structures derived from homologue structure prediction and manually built models consist of poly-alanines to trace the main chains. Only side chains derived from the crystal structures of yeast exocyst subunits were kept in the docked structures. To facilitate the CXMS analysis, all of the models are presented with their original sequences. The exocyst model was then validated with independent CXMS analyses, in which different crosslinking chemicals were used ( Supplementary Tables 2–4 , Supplementary Video 2 ). The C α - C α distance restraint of BS 3 /DSS as well as EDC cross-links is normally within a range of 24 Å 19 , 51 , and approximately 70% of the DSS or BS 3 crosslinks are compatible with the X-ray structures 19 . As a common practice in protein structure modeling, the distance restraints are often relaxed to 30 Å or 35 Å 70 – 72 . When mapped onto the exocyst model, 96% of all crosslinks fall within 35 Å, 94% within 30 Å, 91% within 27 Å and 86% within 24 Å, confirming the overall accuracy of the assignment, fold and chain tracing of the exocyst model. After the validation, the exocyst model was subject to 100 iterations of Phenix.real_space_refine 73 against the 4.4 Å map with global geometry and secondary structure restraints. Sec6 was also auto-refined separately against the refined map of the head region ( Supplementary Fig. 1 ). The quality of the models was evaluated with MolProbity 74 . Chimera 63 was used for figure presentation.
Fluorescence microscopy
Yeast cells were grown to an OD 600 of 1.0–1.5 in Leu- synthetic complete medium at 25 °C and harvested by centrifugation at 3000 rpm for 1 min. 2 µl of cell suspension was processed for fluorescence microscopy with a Nikon ECLIPSE Ti confocal fluorescence microscope equipped with an Apo TIRF 100×/1.49 oil immersion objective lens. Images were collected with a digital camera (CSU-X1, Nikon) operating with NIS-Elements AR 4.60.00 software (Nikon). Rabbit anti-Sec4p polyclonal antibody diluted to 1:2000 was used for immunofluorescence microscopy.
Bgl2 secretion assay
Yeast strains expressing
SEC3-GFP and sec3(Δ621–710)-GFP under SEC3 promotor as the sole copy of Sec3 were grown to an early log phase in YPD medium at 25 °C, followed by another 2 hrs of culturing at 25 °C and 37 °C, respectively. 10 mM NaN 3 and 10 mM NaF were added into the culture and a total of 10 O.D.s of cells were collected for each sample. Cells were washed by 50 mM Tris pH 7.5, 10 mM NaN 3 and 10 mM NaF, and spheroplasted by Zymolase in spheroplast buffer containing 50 mM Tris pH 7.5, 1.4 M sorbitol, 10 mM NaN 3 and 10 mM NaF. After pelleting, the supernatant was taken for external Bgl2 measurement. The spheroplast was washed once by spheroplast buffer and lysed by 0.5% Triton, and was used for the internal Bgl2 determination. The amounts of external and internal Bgl2 were determined by Western blotting, with Adh1 as the loading control.
Invertase secretion assay
Yeast strains with SEC3-GFP and sec3(Δ621–710)-GFP were grown to early log phase in YPD medium at 25 °C. 7 O.D. 600 units of cells were collected for each strain and aliquoted into 7 tubes. 1 tube of the cells was immediately washed and resuspended in 10 mM NaN 3 as un-induced control. The remaining 6 tubes was subject to 90 min culture in YP (1% yeast extract + 2% peptone) plus 0.1% glucose at 25 °C (3 tubes) or 37 °C (3 tubes) to induce the expression of invertase. After induction, cells were washed and resuspended in 10 mM NaN 3 . Half of the cells in each of the 7 tubes were used to measure the external invertase and to measure the O.D. 600 for cell number normalization, while the other half was lysed for the measurement of the internal invertase. After normalization with cell number and subtracting the un-induced control, invertase secretion was calculated by external/ (external + internal). Student’s t-test (unpaired, two-tailed) was used for statistical analyses. Prism7 was used for data presentation. This assay was independently performed twice with similar results obtained.
Thin section electronic microscopy
Early log phase cells were harvested and prefixed with 0.1 M sodium cacodylate containing 3% glutaraldehyde, 5 mM CaCl 2 and 5 mM MgCl 2 , pH 7.4 at room temperature for 1 hr. The cells were then embedded in 2% low melting point agarose in a 1:1 ratio and cut into small pieces (~1mm 3 ). The samples were then fixed with 4% KMNO 4 for 1 hr at 25 °C. After extensive wash with double-distilled water, the pieces were treated with 0.5% sodium meta-periodate for 15 min to increase cell penetrability and then placed into 2% uranyl acetate overnight at 25 °C after another wash. On the next day, the samples were dehydrated through a graded series of ethanol (50%–100%) wash at 4 °C and 100% ethanol incubation overnight at 25 °C, followed by two washes with propylene oxide (PO) and PO/Spurr resin (1:1) agitation overnight at room temperature. Finally, the samples were embedded in 100% Spurr resin and sectioned for electronic microscopy. Cells were observed using a JEM-1011 JEOL transmission microscopy at 15,000× magnification.
Statistics
For invertase secretion assay analysis, the online GraphPad software was used to do the statistics. Un-paired student’s t-test was used to analyze the difference between invertase secretion rate of SEC3-GFP and sec3(Δ621–710)-GFP. For data collected at 25 °C, the two-tailed P value is 0.1376, t value is 1.8526 and degree of freedom is 4; for data collected at 37 °C, the two-tailed P value is less than 0.0001, t value is 53.7907, and degree of freedom is 4.
Data availability and Accession Code Availability Statements
EM structures and associated atomic model have been deposited into the Electron Microscopy Data Bank and Protein Data Bank with the accession code EMD-6827 and 5YFP, respectively. Source data for Figure 6c is available with the paper online. Other data supporting this study are available upon reasonable request. A Life Sciences Reporting Summary for this article is available.
Supplementary Material 1 2 3 Video - CXMS analysis of the exocyst complex Video - Model building of the exocyst complex Video - The assembly of the exocyst complex
📊 Figures
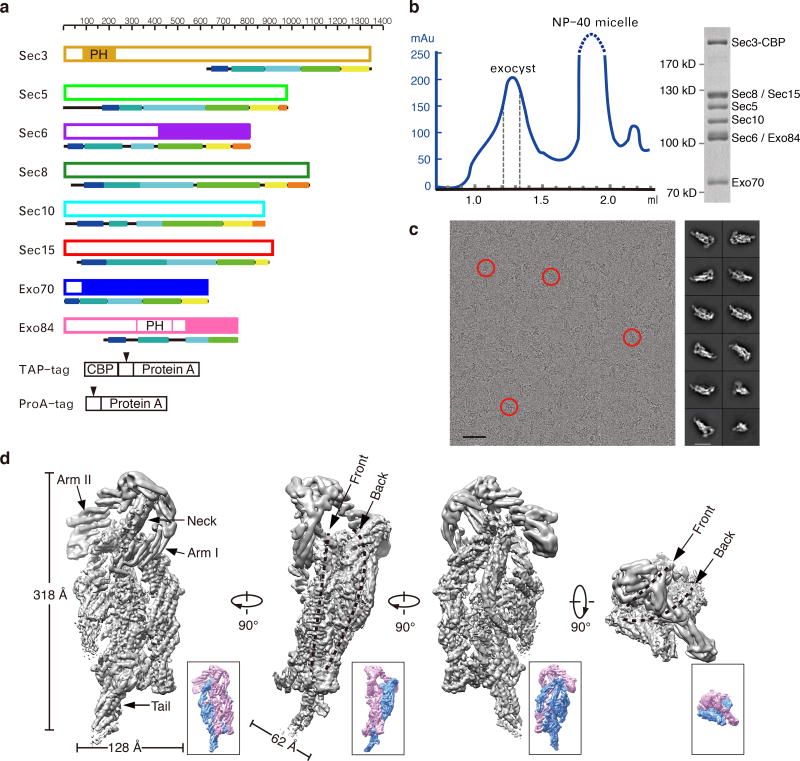
Figure 1
Cryo-EM structure of the exocyst complex
a. Schematic diagram of the yeast exocyst subunits with their affinity tags. Each subunit is drawn following the scale above and color-coded as in later figures for consistency and referencing. Fragme...
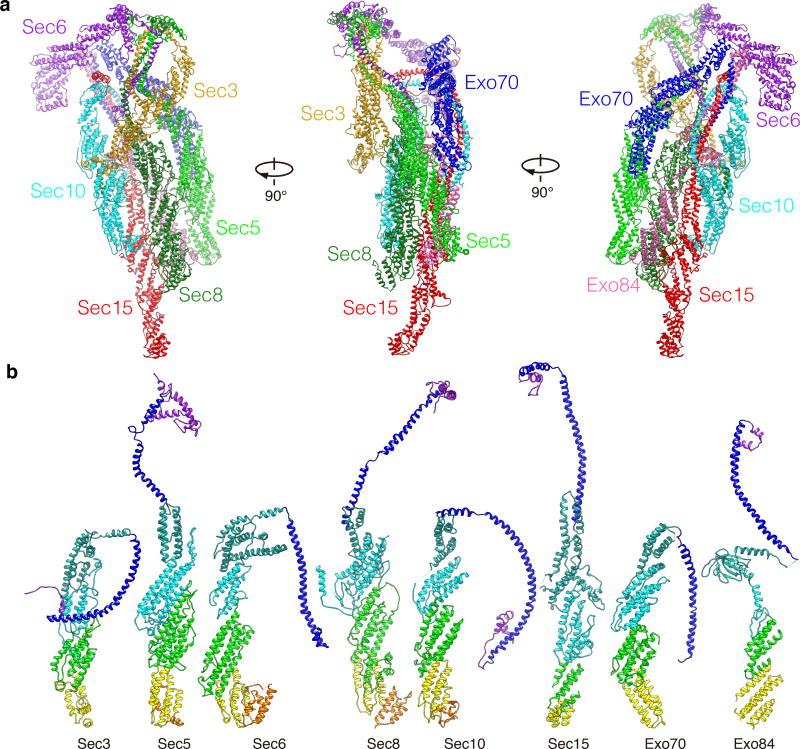
Figure 2
The structure of the holo-exocyst complex and individual subunits
a. The model of the exocyst complex. Subunits are color-coded as indicated. b. Structures of the exocyst subunits. All structures are color-coded based on domain arrangement (from N- to C-terminus: pu...
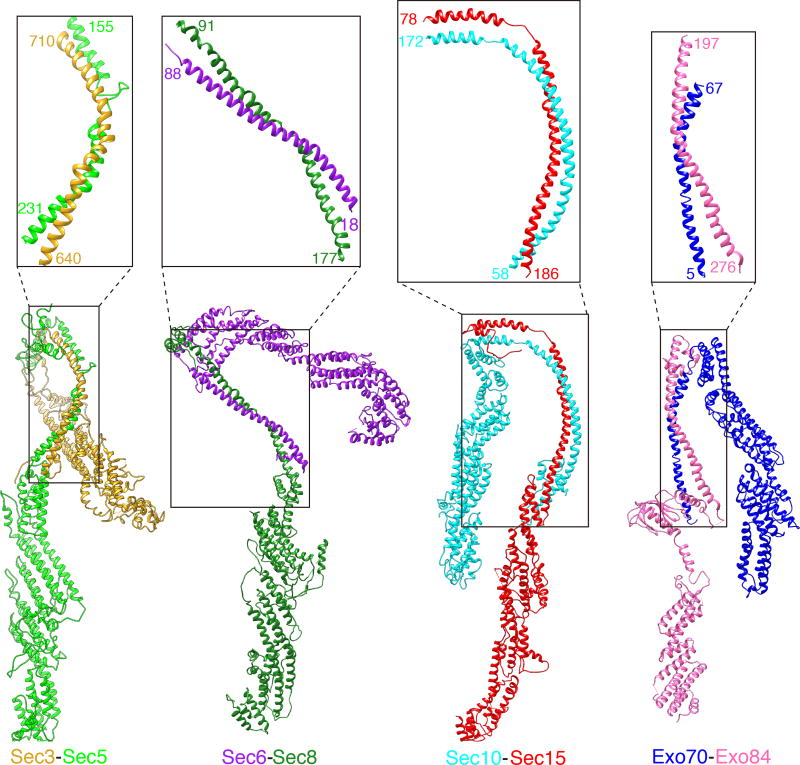
Figure 3
Pair-wise interactions of the exocyst subunits through the CorEx motifs
The four pairs of exocyst subunits, Sec3 and Sec5, Sec6 and Sec8, Sec10 and Sec15, Exo70 and Exo84, form zipper-like interactions through the CorEx motifs. The paring of the CorEx motifs is indicated ...
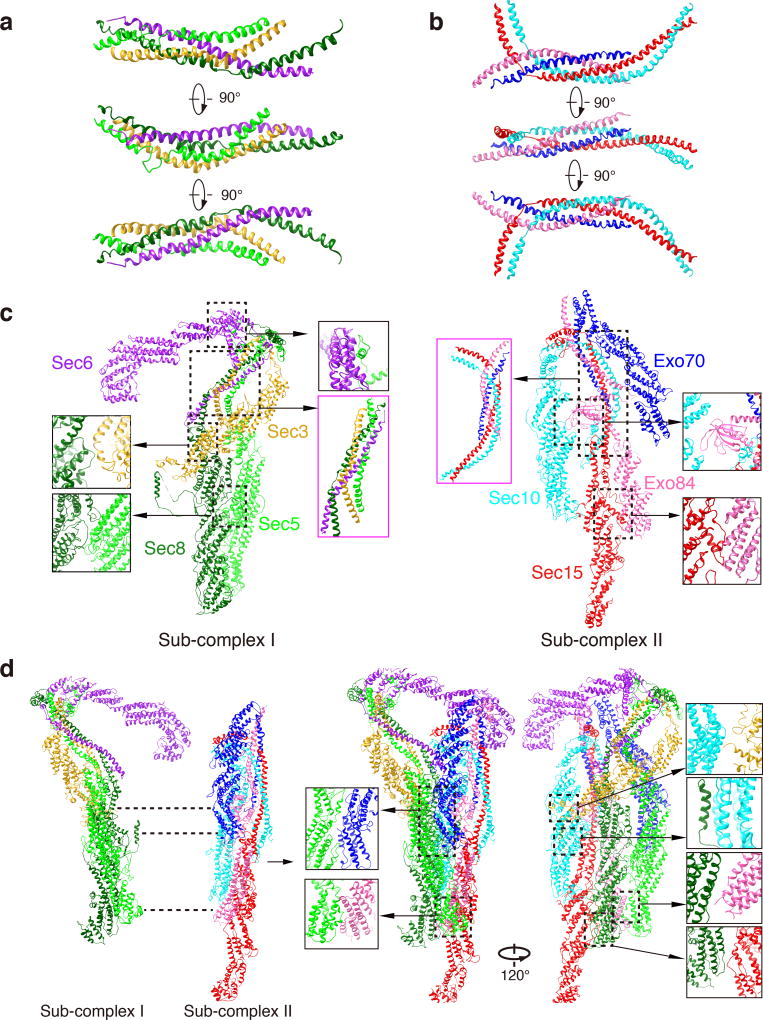
Figure 4
Assembly of the core sub-complexes and the holo-complex
a. The four-helical bundle formed by the CorEx motifs of Sec3, Sec5, Sec 6 and Sec8. b. The four-helical bundle formed by the CorEx motifs of Sec10, Sec15, Exo70 and Exo84. c. Sec3, Sec5, Sec6 and Sec...
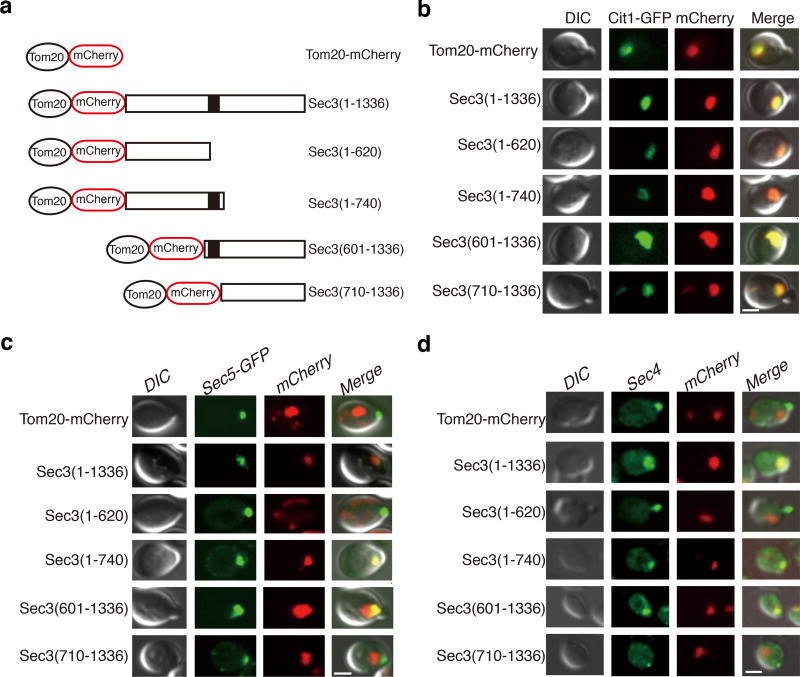
Figure 5
The CorEx motif of Sec3 is crucial for exocyst complex assembly and vesicle tethering
a. Schematic diagram of Sec3 full-length and truncation constructs for ectopic targeting to mitochondria through their fusion with Tom20-mCherry. The dark block indicates the CorEx motif. b. Co-locali...
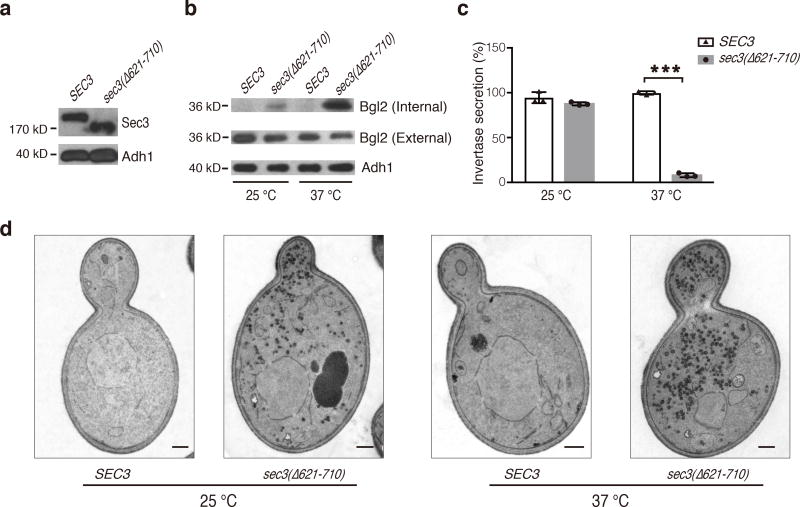
Figure 6
The Sec3 CorEx deletion mutant is defective in exocytosis
a. Expression of Sec3-GFP and Sec3(u0394621u2013710)-GFP in yeast cell lysates was detected by Western blotting with an anti-GFP antibody. Alcohol dehydrogenase-1 (u201cAdh1u201d) was used as a loadin...
Figure images are served from the NIH/NLM PubMed Central Open Access Subset or Europe PMC; copyright remains with the publishers and authors.
💬 Discussion
0 commentsNo comments yet. Be the first to start a discussion!
Leave a Comment