Abstract
AbstractPKD2L1, also termed TRPP3 from the TRPP subfamily (polycystic TRP channels), is involved in the sour sensation and other pH-dependent processes. PKD2L1 is believed to be a nonselective cation channel that can be regulated by voltage, protons, and calcium. Despite its considerable importance, the molecular mechanisms underlying PKD2L1 regulations are largely unknown. Here, we determine the PKD2L1 atomic structure at 3.38 Å resolution by cryo-electron microscopy, whereby side chains of nearly all residues are assigned. Unlike its ortholog PKD2, the pore helix (PH) and transmembrane segment 6 (S6) of PKD2L1, which are involved in upper and lower-gate opening, adopt an open conformation. Structural comparisons of PKD2L1 with a PKD2-based homologous model indicate that the pore domain dilation is coupled to conformational changes of voltage-sensing domains (VSDs) via a series of π–π interactions, suggesting a potential PKD2L1 gating mechanism.
🔬 Techniques
🔭 Microscopes
🧬 Organisms
✨ Fluorophores
🧪 Sample Preparation
🔬 Cell Lines
🏭 Microscope Brands
🧪 Reagent Suppliers
💻 Software Details
💾 Data Repositories
🏛️ Research Organizations (ROR)
Affiliated research institutions:
📋 Methods
Molecular biology Mus musculus PKD2L1 [GenBank: A2A259 ] was provided by Dr. H. Matsunami (Duke University). For structural studies, the truncated construct of mouse PKD2L1 (64–629) with an N-terminal triple Flag-tag (DYKDHDGDYKDHDIDYKDDDDK) and a C-terminal Strep-tag ® II (WSHPQFEKGGGSGGGSGGSAWSHPQFEK; from IBA GmbH) was also subcloned into a pCAG vector 51 . All segments subjected to PCR were verified by sequencing (All primer sequences used in this study are in a Supplementary Table 3 ). Transient expression of truncated mutant proteins The HEK 293F cell line (Invitrogen) was cultured in SMM 293T-I medium (Sino Biological Inc.) at 37 °C under 5% CO 2 in a Multitron-Pro shaker (Infors; 130 rpm). When cell density reached 2–2.5 × 10 6 cells per ml, PKD2L1 (residues 64–629) plasmids were transfected into the cells. For one liter of cell culture, 1.5 mg plasmid was pre-mixed with 4 mg 25-kDa linear polyethylenimines (PEIs) (Polysciences) in 50 ml fresh medium for 15–30 min before transfection. Transfection was initiated by adding the mixture into cell culture and incubating for 15 min. Transfected cells were cultured for 48–60 h before harvesting.
Whole-cell electrophysiology
We performed whole-cell recordings in HEK293T cells at room temperature. Electrodes were pulled and heat-polished, resulting in 1–3 MΩ resistances before using. Whole-cell signals were acquired and analyzed by Axophtch 200B amplifier and the pCLAMP system (Molucular Devices). The Rapid Solution Changer (RSC-200) was applied for fast exposure of acid or high Ca 2+ solution. Bath solutions were perfused into the recording chamber with Valve Commander ALA-VM4 (ALA Scientific Instruments). The pipette solutions contained 140 mM KCl,10 mM HEPES,0.5 mM EGTA, at 290 mOsm adjusted with glucose and at pH 7.4 adjusted with KOH. The extracellular solutions for Off-response contained 135 mM NaCl, 5 mM KCl, 10 mM HEPES, and 2 mM CaCl 2 , at ~300 mOsm adjusted with glucose and at pH 2.5 or 7.5 adjusted with HCl and NaOH. The extracellular solutions for Ca 2+ -response contained 100 mM CaCl 2 , 10 mM HEPES, at ~300 mOsm adjusted with glucose and at pH 7.5 adjusted with TEAOH. Data were analyzed in Clampfit (Molucular Devices, USA), Origin8 (OriginLab, USA) and Excel (Microsoft, USA). Standard error of the mean (S.E.M.) and student t -test (two-tailed, criteria of significance: p < 0.05, denoted as *; p < 0.01 as **; or p < 0.001 as ***) were calculated when applicable.
Show full methods section
Molecular biology Mus musculus PKD2L1 [GenBank: A2A259 ] was provided by Dr. H. Matsunami (Duke University). For structural studies, the truncated construct of mouse PKD2L1 (64–629) with an N-terminal triple Flag-tag (DYKDHDGDYKDHDIDYKDDDDK) and a C-terminal Strep-tag ® II (WSHPQFEKGGGSGGGSGGSAWSHPQFEK; from IBA GmbH) was also subcloned into a pCAG vector 51 . All segments subjected to PCR were verified by sequencing (All primer sequences used in this study are in a Supplementary Table 3 ). Transient expression of truncated mutant proteins The HEK 293F cell line (Invitrogen) was cultured in SMM 293T-I medium (Sino Biological Inc.) at 37 °C under 5% CO 2 in a Multitron-Pro shaker (Infors; 130 rpm). When cell density reached 2–2.5 × 10 6 cells per ml, PKD2L1 (residues 64–629) plasmids were transfected into the cells. For one liter of cell culture, 1.5 mg plasmid was pre-mixed with 4 mg 25-kDa linear polyethylenimines (PEIs) (Polysciences) in 50 ml fresh medium for 15–30 min before transfection. Transfection was initiated by adding the mixture into cell culture and incubating for 15 min. Transfected cells were cultured for 48–60 h before harvesting.
Whole-cell electrophysiology
We performed whole-cell recordings in HEK293T cells at room temperature. Electrodes were pulled and heat-polished, resulting in 1–3 MΩ resistances before using. Whole-cell signals were acquired and analyzed by Axophtch 200B amplifier and the pCLAMP system (Molucular Devices). The Rapid Solution Changer (RSC-200) was applied for fast exposure of acid or high Ca 2+ solution. Bath solutions were perfused into the recording chamber with Valve Commander ALA-VM4 (ALA Scientific Instruments). The pipette solutions contained 140 mM KCl,10 mM HEPES,0.5 mM EGTA, at 290 mOsm adjusted with glucose and at pH 7.4 adjusted with KOH. The extracellular solutions for Off-response contained 135 mM NaCl, 5 mM KCl, 10 mM HEPES, and 2 mM CaCl 2 , at ~300 mOsm adjusted with glucose and at pH 2.5 or 7.5 adjusted with HCl and NaOH. The extracellular solutions for Ca 2+ -response contained 100 mM CaCl 2 , 10 mM HEPES, at ~300 mOsm adjusted with glucose and at pH 7.5 adjusted with TEAOH. Data were analyzed in Clampfit (Molucular Devices, USA), Origin8 (OriginLab, USA) and Excel (Microsoft, USA). Standard error of the mean (S.E.M.) and student t -test (two-tailed, criteria of significance: p < 0.05, denoted as *; p < 0.01 as **; or p < 0.001 as ***) were calculated when applicable.
Confocal microscopy fluorescence imaging
Experiments were carried out in HEK293 cells expressing wild-type PKD2L1 or PKD2L1 (residues 64–629), each fused with a C-terminal YFP-tag and both expressed in complex with PKD1L3. The confocal fluorescence imaging experiments were performed with a ZEISS laser scanning confocal microscopy (LSM710). Data were collected and analyzed by ZEN 2012 Light Edition software.
Purification of truncated mutant proteins
For cell harvesting, transfected cells were centrifuged at 800 × g and resuspended in lysis buffer containing 20 mM HEPES, pH 7.5, 150 mM NaCl, 10% glycerol, 5 mM EDTA and protease inhibitor cocktail (Amresco; 2 μg/ml aprotinin, 2 μg/ml leupeptin, 2 μg/ml pepstanin). The suspension was frozen by liquid nitrogen and stored at −80 °C until further operations. When purifying the protein, the thawed suspension was homogenized with 1 mM phenylmethylsulfonyl fluoride (PMSF) added. Then 2% dodecyl maltoside (DDM), 0.5% soybean lipids (Sigma), 0.4% cholesterol hemisuccinate (CHS) (Anatrace) was supplemented and the mixture was incubated for 1.5–2 h at 4 °C. After ultra-centrifuged at 18,700 × g for 40–60 min, the supernatant was applied into anti-Flag M2 affinity gel (Sigma) for three times at 4 °C by gravity. The resin was rinsed eight times, 5 ml buffer containing 20 mM HEPES, pH 7.5, 150 mM NaCl, 10% glycerol and 0.06% digitonin (Sigma) per time. Target protein was then eluted with wash buffer plus 300–400 μg/ml Flag peptide (Sigma). The elution from Anti-Flag M2 column was loaded to Strep-Tactin resin (IBA company) for 1 h at 4 °C and then, the resin was washed extensively by the same wash buffer as above. Finally, the target protein PKD2L1 (residues 64–629) was eluted with wash buffer plus 5 mM D-Desthiobiotin (IBA). This final protein eluent was concentrated by a 100-kDa cut-off Centricon (Millipore) and further purified by Superose-6 column (GE Healthcare). The peak fractions were mixed with amphipols at 1:5 ratio (w/w), incubated overnight at 4 °C. Detergent was removed with Bio-Beads SM-2 (Bio-Rad; 4 °C for 2 h, 50–100 mg per 1 ml protein/detergent/amphipol mixture) added. Bio-Beads were eliminated by disposable needles and excess amphipols were removed by Superose-6 column (GE Healthcare) in a buffer composed of 20 mM HEPES, pH 7.5, 150 mM NaCl. The peak corresponding to tetrameric PKD2L1 channels was collected for cryo-EM analysis afterwards. This expression and purification strategy gives a typical yield of 0.02 mg homogeneous PKD2L1 (residues 64–629) with a N-terminal triple Flag and a C-terminal Strep II tag for every liter of HEK 293F cell culture. Electron microscopy grid preparation Aliquots (4 μl) of purified PKD2L1 (residues 64–629) at a concentration of approximately 5 mg/ml were placed on glow-discharged holey carbon grids (Quantifoil Cu 300 mesh, R1.2/1.3) which were glow discharged for 30 s (mid) after 2 min evacuation. The grids were blotted for 3.5 s and flash frozen in liquid ethane cooled by liquid nitrogen using Vitrobot Mark IV (FEI). All set grids were retained in liquid nitrogen until data collection.
Cryo-EM data acquisition
Grids of PKD2L1 (residues 64–629) were transferred to a 300 kV FEI Titan Krios TEM equipped with a FEI Falcon II direct electron detector and a Cs corrector. The Cs was adjusted lower than 10 µm. A total of 10,217 movie stacks were collected at a nominal magnification of 75,000 × (effective pixel size being 0.88 Å at the object scale) with the defocus ranging from −1.5 to −2.9 µm. Data collection was accomplished under low-dose conditions using automated software AutoEMation II (developed by Jianlin Lei) 52 . For each micrograph stack, 38 frames were collected, with a total electron dose at approximately 60 e - /Å2 with an exposure time of 2.25 s. The stacks were first motion corrected with MotionCorr 53 and the output stacks were further motion corrected with MotionCor2 54 . Dose weighting was performed concurrently 55 . Gctf 56 was used to estimate the defocus values.
Cryo-EM image processing
A representative diagram of image processing procedures on PKD2L1 is presented in Supplementary Fig. 2 . All in all, 8251 good micrographs were manually selected based on their Thon rings and contaminated conditions, and 2,659,411 particles were automatically picked through RELION 1.4 53 . C4 symmetry was applied in all three-dimensional classification and refinement steps unless specifically noted. The map of PKD2 obtained from Shen et al. was low-pass filtered to 60 Å and was used as the initial model. All of the particles were first subjected to global angular search three-dimensional (3D) classification using RELION 2.0 54 with one class and step size of 7.5°, and then to 3D classification with five classes and 3.75˚ local angular search step. The local angular search 3D classification was executed multiple times, during which the input was from different iterations of the global angular search 3D classification. At this stage, 870,465 good particles were combined and further subjected to 3D auto-refinement. The output from 3D auto-refinement was then filtered to 60 Å and used as the reference for 3D classification with skipping alignment in the next step. In all, 109,470 good particles were obtained and further exposed to 3D auto-refinement, after which the resolution was 3.34 Å, following the gold-standard FSC 0.143 criterion 27 with a high-resolution noise substitution method. To obtain better density information in the S6 region, particles were further subjected to local search 3D classification with five classes and with skipping alignment. Then after applying a local mask to selected particles and redo auto-refinement and post-processing, Finally, 22,296 good particles were obtained and subjected to the final resolution was 3.38 Å with better density information in the S6 area.
Model building and structure refinement
For model building of PKD2L1, the structure of PKD2 (PDB code: 5T4D ) was used as the starting model and was fitted into PKD2L1 EM maps with UCSF Chimera 57 . Model building was performed in COOT 58 . De novo model building was performed subsequently. Sequence assignment was guided mainly by bulky residues and the chemical properties of amino acids were considered during model building. A poly-Ala model was built in some areas where the resolution was insufficient for side-chain assignments. For structure refinement, we used the phenix.real_space_refine application of PHENIX 59 in real space with secondary structure as well as geometry restraints in order to prevent structure overfitting. To monitor overfitting of the overall model, we refined the model in one of the two independent maps from the gold-standard refinement approach and assessed the refined model against the other map 60 (Supplementary Figs. 1 and 3 ). The final model was evaluated using MolProbity 61 ; statistics of the 3D reconstruction and model refinement can be found in Supplementary Table 1 .
Data availability
The cryo-EM maps of the PKD2L1 structure have been deposited in the Electron Microscopy Data Bank (EMDB) with the accession code EMD-6877 . The atomic coordinates for the corresponding model has been deposited in the Protein Data Bank (PDB) under the accession code 5Z1W . Electrophysiology data including all other data supporting the findings of this study are available from the corresponding authors upon reasonable request.
Electronic supplementary material Supplementary Information(PDF 4169 kb) Peer Review File(PDF 254 kb) Description of Additional Supplementary Files(PDF 6 kb) Supplementary Movie 1 Supplementary Movie 2 Supplementary Movie 3
📊 Figures
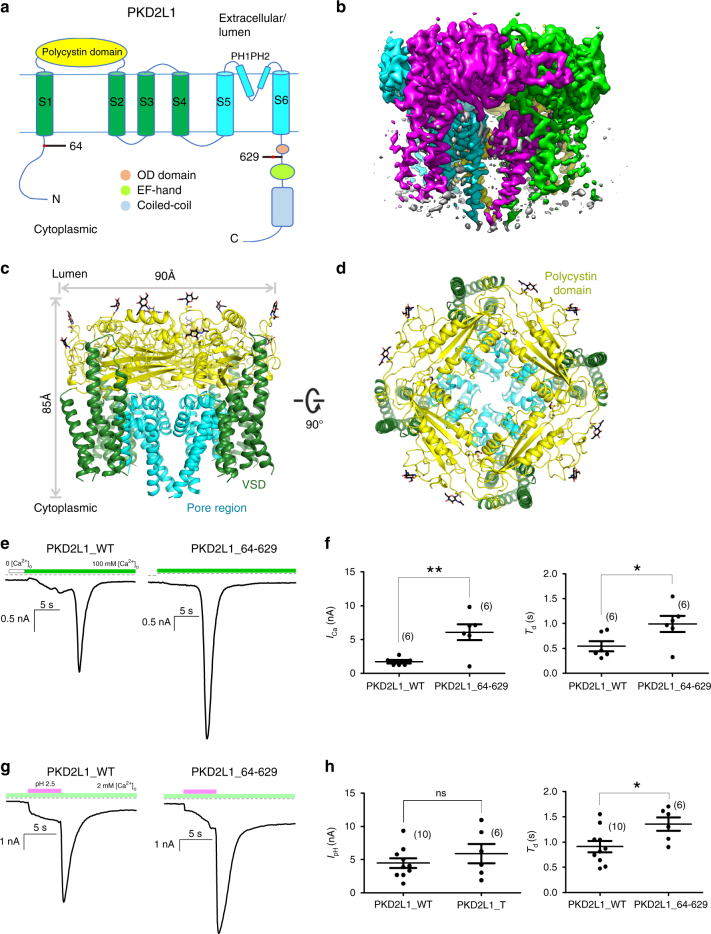
Fig. 1
Structural characterizations of PKD2L1. a General topology of PKD2L1. PKD2 has a similar topology with a longer N-terminus and no oligomerization domain (OD). b Overall EM map of PKD2L1 (residues 64u2...
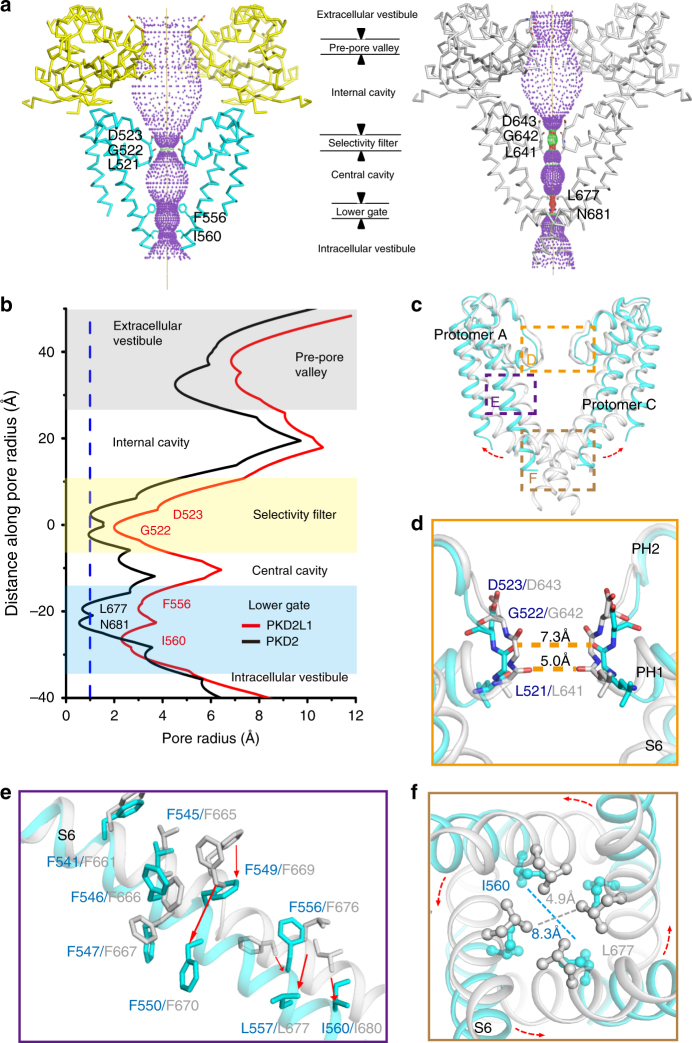
Fig. 2
PKD2L1 pore suggests its open conformation in comparison with PKD2 structure. Throughout the analysis, PKD2L1 structures are colored in cyan, green, or yellow according to different domains, and PKD2 ...
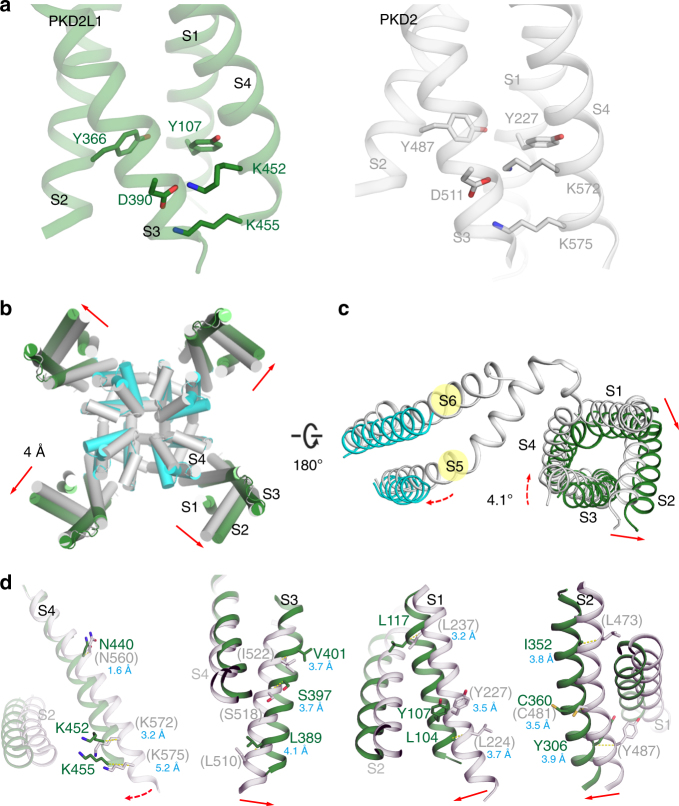
Fig. 3
Conformational changes of the VSDs modeled in PKD2L1. a PKD2L1 (green) and PKD2 (gray) both harbor two lysines, K452 and K455 (resp. K572 and K575 in PKD2) in S4, which increases their voltage sensiti...
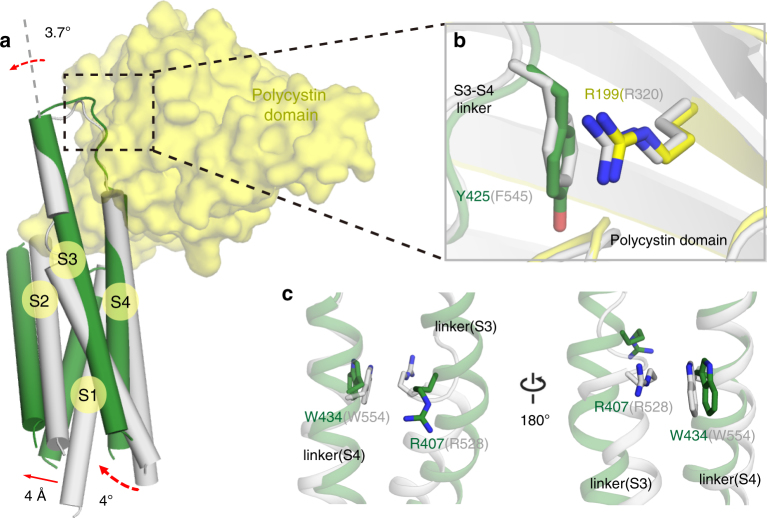
Fig. 4
Outward movements of the overall VSD modeled in PKD2L1. a The VSD domain of PKD2L1 (green) has an outward movement compared to that of the homologous PKD2L1 closed-state model (gray; the modeled struc...
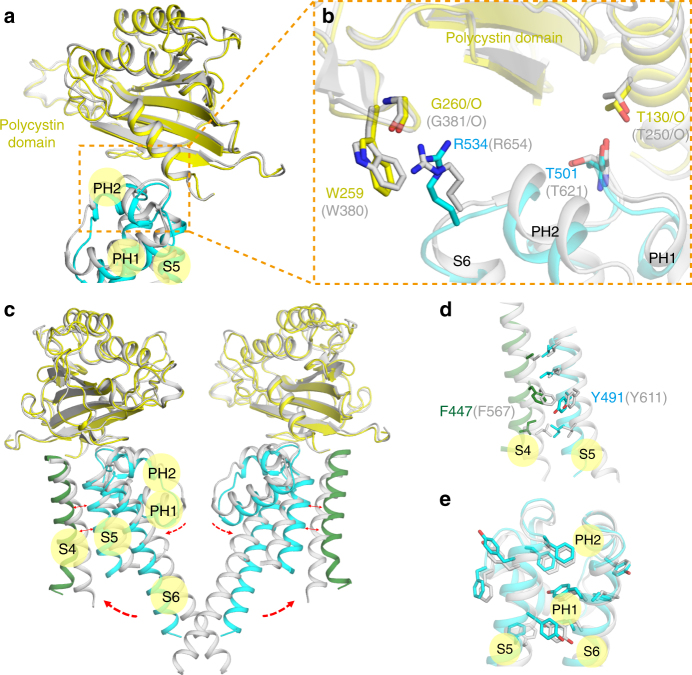
Fig. 5
Interactions between pore domains and neighboring domains modeled in PKD2L1. a The upper gate is persistently close to the polycystin domain in both closed and open states. For visual clarity, only on...
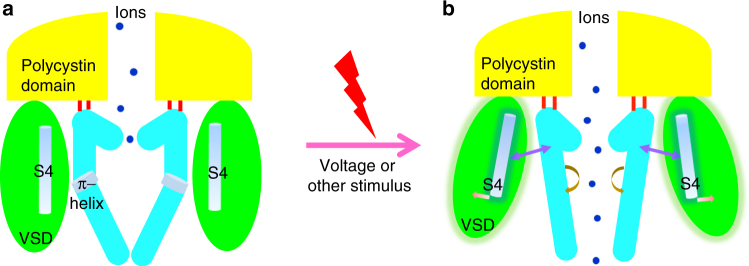
Fig. 6
Hypothetical model for PKD2L1 gating mechanisms. Mechanisms of gating for PKD2L1 channels can be described as shown in the schematic. The closed-state of PKD2L1 depicted by the homologous model of PKD...
Figure images are served from the NIH/NLM PubMed Central Open Access Subset or Europe PMC; copyright remains with the publishers and authors.
💬 Discussion
0 commentsNo comments yet. Be the first to start a discussion!
Leave a Comment