Abstract
Inosine monophosphate dehydrogenase (IMPDH) mediates the first committed step in guanine nucleotide biosynthesis and plays important roles in cellular proliferation and the immune response. IMPDH reversibly polymerizes in cells and tissues in response to changes in metabolic demand. Self-assembly of metabolic enzymes is increasingly recognized as a general mechanism for regulating activity, typically by stabilizing specific conformations of an enzyme, but the regulatory role of IMPDH filaments has remained unclear. Here, we report a series of human IMPDH2 cryo-EM structures in both active and inactive conformations. The structures define the mechanism of filament assembly, and reveal how filament-dependent allosteric regulation of IMPDH2 makes the enzyme less sensitive to feedback inhibition, explaining why assembly occurs under physiological conditions that require expansion of guanine nucleotide pools. Tuning sensitivity to an allosteric inhibitor distinguishes IMPDH from other metabolic filaments, and highlights the diversity of regulatory outcomes that can emerge from self-assembly.
🔬 Techniques
🔭 Microscopes
🧬 Organisms
💻 Software
✨ Fluorophores
🧪 Sample Preparation
🔬 Cell Lines
🏭 Microscope Brands
🧪 Reagent Suppliers
📷 Detectors
💻 Software Details
💾 Data Repositories
🏛️ Research Organizations (ROR)
Affiliated research institutions:
📋 Methods
Key resources table
Reagent type (species) or resource Designation Source or reference Identifiers Additional information Strain, strain background ( Eschericia coli ) BL21(DE3) Thermo Scientific EC0114 competent cells Recombinant DNA reagent pSMT3-hIMPDH2-WT (pJK053) https://doi.org/10.1091/mbc.E17-04-0263 expression plasmid Recombinant DNA reagent pSMT3-hIMPDH2-Y12A (pJK061) https://doi.org/10.1091/mbc.E17-04-0263 expression plasmid Peptide, recombinant protein Ubiquitin-like-specific protease 1 (ULP1) https://doi.org/10.1091/mbc.E17-04-0263 purified in house Peptide, recombinant protein human IMPDH2 https://doi.org/10.1091/mbc.E17-04-0263 purified in house Chemical compound, drug LB broth mix LabExpress 3003 bacterial growth media Chemical compound, drug IPTG GoldBio I2481C100 Chemical compound, drug MgCl2 Fisher Scientific BP215-500 Chemical compound, drug KPO4 Fisher Scientific BP362-500 Chemical compound, drug KCl Fisher Scientific BP217-3 Chemical compound, drug imidazole Sigma Aldrich SLBT7469 Chemical compound, drug urea Fisher Scientific BP169-212 Chemical compound, drug DTT Fisher Scientific 172–25 Chemical compound, drug HEPES Fisher Scientific BP310-1 Chemical compound, drug ATP Sigma Aldrich A2383-10G Chemical compound, drug GTP Sigma Aldrich G8877-1G Chemical compound, drug IMP Sigma Aldrich 57510–5G Chemical compound, drug NAD+ Sigma Aldrich N6522-1G Chemical compound, drug uranyl formate Electron Microscopy Sciences 22450 negative stain EM Software, algorithm GCTF https://doi.org/10.1016/j.jsb.2015.11.003 Software, algorithm Relion https://doi.org/10.7554/eLife.42166 Software, algorithm MotionCor2 https://doi.org/10.1038/nmeth.4193 Software, algorithm SWISS-MODEL https://doi.org/10.1093/nar/gky427 Software, algorithm UCSF Chimera https://doi.org/10.1002/jcc.20084 Software, algorithm COOT https://doi.org/10.1107/S0907444910007493 Software, algorithm PHENIX https://doi.org/10.1107/97809553602060000865 Software, algorithm LocScale https://doi.org/10.7554/eLife.27131 Software, algorithm Molprobity https://doi.org/10.1107/S0907444909042073 Software, algorithm EMRinger https://doi.org/10.1038/nmeth.3541 Other C-flat 2/2 holey carbon films on Cu 200 mesh grid Protochips, Inc CF-2/2–2C cryo-EM sample preparation Other HisTrap FF Crude 5 ml GE Life Sciences 17528601 protein purification Other Superose 6 Increase 10/300 GL GE Life Sciences 29-0916-96 protein purification Other Amicon Ulta-15 30K MWCO centrifugal filters Millipore UFC903008 protein concentration Recombinant IMPDH expression and purification Purified hIMPDH2 was prepared as described previously ( Anthony et al., 2017 ). BL21 (DE3) E. coli transformed with a pSMT3-Kan vector expressing N-terminal SMT3/SUMO-tagged hIMPDH2 were cultured in Luria broth at 37°C until reaching an OD 600 of 0.8 and then induced with 1 mM IPTG for 4 hr at 30°C and pelleted. The remainder of purification was performed at 4°C. Pellets were resuspended in lysis buffer (50 mM KPO4, 300 mM KCl, 20 mM imidazole, 800 mM urea, pH 8) and lysed with an Emulsiflex-05 homogenizer. Lysate was cleared by centrifugation and SUMO-tagged hIMPDH2 chromatagraphically purified with HisTrap FF columns (GE Healthcare Life Sciences) and an Äkta Start chromatography system. After in-column washing with lysis buffer and elution (with 50 mM KPO4, 300 mM KCl, 500 mM imidazole, pH 8), peak fractions were treated with 1 mg ULP 1 protease ( Mossessova and Lima, 2000 ) per 100 mg hIMPDH2 for 1 hr, followed by the addition of 1 mM dithiothreitol (DTT) and 800 mM urea. Protein was then concentrated using a 30,000 MWCO Amicon filter and subjected to size-exclusion chromatography using Äkta Pure system and a Superose 6 column pre-equilibrated in filtration buffer (20 mM HEPES, 100 mM KCl, 800 mM urea, 1 mM DTT, pH 8). Peak fractions were flash-frozen in liquid nitrogen and stored at −80°C.
Show full methods section
Key resources table
Reagent type (species) or resource Designation Source or reference Identifiers Additional information Strain, strain background ( Eschericia coli ) BL21(DE3) Thermo Scientific EC0114 competent cells Recombinant DNA reagent pSMT3-hIMPDH2-WT (pJK053) https://doi.org/10.1091/mbc.E17-04-0263 expression plasmid Recombinant DNA reagent pSMT3-hIMPDH2-Y12A (pJK061) https://doi.org/10.1091/mbc.E17-04-0263 expression plasmid Peptide, recombinant protein Ubiquitin-like-specific protease 1 (ULP1) https://doi.org/10.1091/mbc.E17-04-0263 purified in house Peptide, recombinant protein human IMPDH2 https://doi.org/10.1091/mbc.E17-04-0263 purified in house Chemical compound, drug LB broth mix LabExpress 3003 bacterial growth media Chemical compound, drug IPTG GoldBio I2481C100 Chemical compound, drug MgCl2 Fisher Scientific BP215-500 Chemical compound, drug KPO4 Fisher Scientific BP362-500 Chemical compound, drug KCl Fisher Scientific BP217-3 Chemical compound, drug imidazole Sigma Aldrich SLBT7469 Chemical compound, drug urea Fisher Scientific BP169-212 Chemical compound, drug DTT Fisher Scientific 172–25 Chemical compound, drug HEPES Fisher Scientific BP310-1 Chemical compound, drug ATP Sigma Aldrich A2383-10G Chemical compound, drug GTP Sigma Aldrich G8877-1G Chemical compound, drug IMP Sigma Aldrich 57510–5G Chemical compound, drug NAD+ Sigma Aldrich N6522-1G Chemical compound, drug uranyl formate Electron Microscopy Sciences 22450 negative stain EM Software, algorithm GCTF https://doi.org/10.1016/j.jsb.2015.11.003 Software, algorithm Relion https://doi.org/10.7554/eLife.42166 Software, algorithm MotionCor2 https://doi.org/10.1038/nmeth.4193 Software, algorithm SWISS-MODEL https://doi.org/10.1093/nar/gky427 Software, algorithm UCSF Chimera https://doi.org/10.1002/jcc.20084 Software, algorithm COOT https://doi.org/10.1107/S0907444910007493 Software, algorithm PHENIX https://doi.org/10.1107/97809553602060000865 Software, algorithm LocScale https://doi.org/10.7554/eLife.27131 Software, algorithm Molprobity https://doi.org/10.1107/S0907444909042073 Software, algorithm EMRinger https://doi.org/10.1038/nmeth.3541 Other C-flat 2/2 holey carbon films on Cu 200 mesh grid Protochips, Inc CF-2/2–2C cryo-EM sample preparation Other HisTrap FF Crude 5 ml GE Life Sciences 17528601 protein purification Other Superose 6 Increase 10/300 GL GE Life Sciences 29-0916-96 protein purification Other Amicon Ulta-15 30K MWCO centrifugal filters Millipore UFC903008 protein concentration Recombinant IMPDH expression and purification Purified hIMPDH2 was prepared as described previously ( Anthony et al., 2017 ). BL21 (DE3) E. coli transformed with a pSMT3-Kan vector expressing N-terminal SMT3/SUMO-tagged hIMPDH2 were cultured in Luria broth at 37°C until reaching an OD 600 of 0.8 and then induced with 1 mM IPTG for 4 hr at 30°C and pelleted. The remainder of purification was performed at 4°C. Pellets were resuspended in lysis buffer (50 mM KPO4, 300 mM KCl, 20 mM imidazole, 800 mM urea, pH 8) and lysed with an Emulsiflex-05 homogenizer. Lysate was cleared by centrifugation and SUMO-tagged hIMPDH2 chromatagraphically purified with HisTrap FF columns (GE Healthcare Life Sciences) and an Äkta Start chromatography system. After in-column washing with lysis buffer and elution (with 50 mM KPO4, 300 mM KCl, 500 mM imidazole, pH 8), peak fractions were treated with 1 mg ULP 1 protease ( Mossessova and Lima, 2000 ) per 100 mg hIMPDH2 for 1 hr, followed by the addition of 1 mM dithiothreitol (DTT) and 800 mM urea. Protein was then concentrated using a 30,000 MWCO Amicon filter and subjected to size-exclusion chromatography using Äkta Pure system and a Superose 6 column pre-equilibrated in filtration buffer (20 mM HEPES, 100 mM KCl, 800 mM urea, 1 mM DTT, pH 8). Peak fractions were flash-frozen in liquid nitrogen and stored at −80°C.
IMPDH assembly
Filaments (or, depending on ligand state, free octamers) were prepared by diluting aliquots of purified hIMPDH2 in activity buffer (20 mM HEPES, 100 mM KCl, 1 mM DTT, pH 7.5) to 2 μM in the presence of varying concentrations of ATP, GTP, IMP, and/or NAD + and incubating for 30 min at 20°C. Nucleotide stocks were prepared using ATP disodium salt hydrate (Sigma A2383), GTP sodium salt hydrate (Sigma G8877), IMP disodium salt hydrate (Acros AC226260050), and β-Nicotinamide adenine dinucleotide hydrate (Sigma N6522), For all buffers, protein preparations, and nucleotide stocks, final pH was checked and titrated if necessary to 7.5 with KOH or HCl.
IMPDH activity assays
Protein aliquots were diluted in activity buffer and pre-treated with varying concentrations of ATP, GTP, and IMP for 30 min at 20°C, in 96 well UV transparent plates (Corning model 3635). Reactions (100 uL total) were initiated by addition of varying concentrations of NAD + . NADH production was measured by optical absorbance (340 nm) in real-time using a Varioskan Lux microplate reader (Thermo Scientific) at 20°C, 1 measurement/min, for 20 min; absorbance was correlated with NADH concentration using a standard curve. Specific activity was calculated by linear interpretation of the reaction slope for a 5 min window beginning 3 min after reaction initiation.
Negatively stained electron microscopy
Protein preparations were applied to glow-discharged continuous carbon EM grids and negatively stained with 2% uranyl formate. Grids were imaged by transmission electron microscopy using an FEI Tecnai G2 Spirit at 120kV acceleration voltage and a Gatan Ultrascan 4000 CCD using the Leginon software package ( Suloway et al., 2009 ). Micrographs were collected at a nominal 67,000x magnification (pixel size 1.6 Å). GCTF was used for contrast transfer function (CTF) estimation, and Relion for particle picking and 2D classification ( Scheres, 2012 ; Zhang, 2016 ; Zivanov et al., 2018 ).
Electron cryo-microscopy sample preparation and data collection
Protein preparations were applied to glow-discharged C-flat holey carbon EM grids (Protochips), blotted, and plunge-frozen in liquid ethane using an Vitrobot plunging apparatus (FEI) at 20°C, 100% relative humidity. High-throughput data collection was performed using an FEI Titan Krios transmission electron microscope operating at 300 kV and equipped with a Gatan image filter (GIF) and post-GIF Gatan K2 Summit direct electron detector using the Leginon software package ( Suloway et al., 2009 ). For the two datasets with non-filament octamers of IMPDH, which exhibit a preferred orientation, it was necessary to collect images with the stage tilted in order to capture a sufficient range of views for 3D reconstruction ( Figure 4—figure supplement 3A , Figure 5—figure supplement 2A ).
Electron cryo-microscopy image processing
Movies were collected in super-resolution mode, then aligned and corrected for beam-induced motion using Motioncor2, with 2X Fourier binning and dose compensation applied during motion correction ( Suloway et al., 2009 ; Zheng et al., 2017 ). CTF was estimated using GCTF ( Zhang, 2016 ). Relion 3.0 was used for all subsequent image processing ( Zhang, 2016 ; Zivanov et al., 2018 ). Although multiple datasets of hIMPDH2 under the different ligand states were collected, each dataset was individually processed using approximately the same overall pipeline ( Figure 2—figure supplement 1E–G ), with some variations from dataset to dataset ( Figure 3—figure supplement 1 , Figure 4—figure supplement 2 , Figure 4—figure supplement 3 , Figure 5—figure supplement 2 , Figure 5—figure supplement 3 , Figure 5—figure supplement 4 ). First, for each dataset, autopicking templates and initial 3D references maps were prepared by manually picking and extracting boxed particles from a small subset of micrographs, and classifying/refining in 2D and 3D. For these initial 3D refinements, a featureless, soft-edged cylinder was used as a refinement template of filaments, and a previously published cryo-em map (EMDB-8692) was used as template for non-filament octamers ( Anthony et al., 2017 ). Because IMPDH filament segments possess D4 point-group symmetry, two different locations along filaments may be used as symmetry origins: the centers of canonical octamer segments, or the centers of the assembly interface between segments. For the filament datasets, we prepared and used auto-picking templates centered on the filament assembly interface. For the datasets containing non-filament octamers of hIMPDH2, auto-picking templates centered on these non-filament particles were also included. Due to the flexibility of hIMPDH2 filaments, helical segments were processed as single particles, and at no point was helical symmetry applied during image processing. After template-based autopicking of each complete dataset, picked particles were boxed and extracted from micrographs, and subjected to hierarchical 2D classification to select the best-resolved classes. These selected particles were then auto-refined in 3D as a single class with symmetry applied (D4 for filament segments and free octamers, C4 for filament ends). Exploratory image processing of the assembly interface-centered filament reconstructions made it apparent that the eight catalytic domains surrounding this interface appeared conformationally homogenous, while the Bateman domains and neighboring octamers appeared conformationally varied. Additionally, due to the flexibility of the filaments, and the tendency of filament ends to adhere to the air-water interface, many filaments were tilted out of plane, with neighboring segments overlapping in projection. To improve resolution, partial signal subtraction was performed at this stage, using a mask that left only the central eight catalytic domains of the filament assembly interface, subtracting the poorly resolved Bateman domains and neighboring segments, which served to improve resolution after subsequent auto-refinement. Per-particle defocus and per-micrograph astigmatism were then optimized using CTF refinement, which improved resolution further. The resulting consensus refinements of the filament assembly interfaces were well-resolved, however data on Bateman domain conformation was missing, with these regions very poorly resolved when subtracted regions were restored to the reconstructions by reversion to original non-subtracted particles (data not shown). To resolve the different Bateman domain conformations, we applied particle symmetry expansion (D4 to C1) and classified particles without additional alignment. Because at this stage the reconstructions were centered on the filament assembly interface, each boxed ‘particle’ contained elements of two different neighboring octamers. The potential conformational space was reduced by applying a mask enclosing only one of these two octamers. By hierarchical focused classification of the off-origin octamers we were able to classify multiple conformations of the octameric filament segments, as well as incomplete segments and filament ends. Symmetry expansion was also applied to the non-filament octamer datasets, with a mask including the entire particle, which allowed classification of the most symmetric and well-resolved classes. To further improve resolution of the varying symmetry-expanded segment classes, the reconstruction symmetry origins were moved from the filament assembly interface to the canonical octamers by re-extraction with re-centering. For each class, symmetry was then collapsed by removing redundant overlapping particles, Euler angles reset to zero. After auto-refining once again, we observed that the most well-resolved octameric segments from the asymmetric symmetry-expanded classifications exhibited some apparent symmetry, with fully extended or fully compressed octamers appearing D4 symmetric, and some bent classes apparently D1 symmetric. We therefore applied these symmetries during subsequent refinement and classification of these new octamer-centered classes. As before, signal subtraction of neighboring filament segments improved resolution considerably. Additional rounds of CTF refinement and 3D classification identified the best-resolved particles from each of these conformational classes. Final overall resolution (according to the FSC = 0.143 criterion), as well as local resolution, was assessed using Relion postprocessing.
Model building and refinement
As initial templates for model building, two hybrid models (representing hIMPDH2 in either an extended or compressed state) were prepared by combining elements from existing crystal structures. For both templates, the catalytic domain and substrate poses (residues 18–107, and 245–514) were taken from a crystal structure of an inhibitor-bound hIMPDH2 (PDB 1nf7), and the Bateman domains and ligand poses (residues 108–244) were based on fungal ( A. gossypii) IMPDH crystallized in either the extended or compressed states (PDB 5mcp and 5tc3, respectively), and SWISS-MODEL homology modeling ( Buey et al., 2017 ; Sintchak et al., 1996 ; Waterhouse et al., 2018 ). The N-terminus (residues 1–17) were modeled by hand. In all maps, a single active site loop (residues 421 to 436) was unresolved, and these residues were not modeled. After rigid-body fitting of templates into the cryo-EM densities using UCSF Chimera, repeated cycles of manual fitting with Coot, automated fitting with phenix.real_space_refine (employing rigid-body refinement, NCS constraints, gradient-driven minimization and simulated annealing) and local B-factor sharpening of cryo-EM data via LocScale were used for final atomic model refinement and local sharpening of cryo-EM maps ( Adams et al., 2012 ; Emsley et al., 2010 ; Jakobi et al., 2017 ; Pettersen et al., 2004 ). Final models were evaluated with MOLPROBITY and EMRinger ( Barad et al., 2015 ; Chen et al., 2010 ). Data collection parameters and refinement statistics are summarized in Figure 3—source data 1 , Figure 3—source data 2 , Figure 3—source data 3 , Figure 4—source data 1 , Figure 4—source data 2 , Figure 5—source data 1 . Figures were prepared with UCSF Chimera ( Pettersen et al., 2004 ). Fourier shell correlations between the final models and maps were calculated with phenix.mtriage, and to probe for overfitting, a model refined against one half-map was likewise used to calculate FSCs between both that half-map (FSC-work) and the other half-map (FSC-test) ( Afonine et al., 2018 ) ( Figure 3—figure supplement 2 , Figure 4—figure supplement 3 , Figure 4—figure supplement 5 , Figure 5—figure supplement 5 , Figure 5—figure supplement 6 ). Classification of cryo-EM data against synthetic templates and calculation of interfaced octamer odds ratios The five interface-centered filament particle stacks were re-extracted to a larger box size and a common pixel size (2 Å/px) and a larger box size (576 Å) that completely included both interfaced octamers ( Figure 5—figure supplement 8A ). Synthetic templates representing different octamer conformations and orientations for either of these interfaced octamers were prepared using a subset of the final experimental models, and simulating EM density using the Eman2 tool pdb2mrc ( Tang et al., 2007 ) ( Figure 5—figure supplement 8B ). The paired octamers from each interface were then classified in Relion for a single iteration, without additional alignment, using masks to focus on one octamer or the other. Odds ratios (and associated 95% confidence intervals) were then calculated for all possible pairs of classified conformations between the sets of interfaced octamers (( Figure 5—figure supplement 8C , ( Figure 5—figure supplements 9 – 13 ).
Additional files Transparent reporting form
📊 Figures
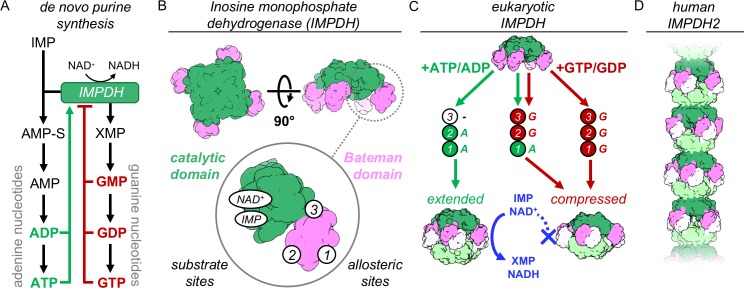
Figure 1.
IMPDH structure and function.
( A ) De novo purine nucleotide biosynthesis pathways. ( B ) IMPDH consists of a catalytic domain with two substrate binding sites (green), and a regulatory Bateman domain (pink) with three allosteric...
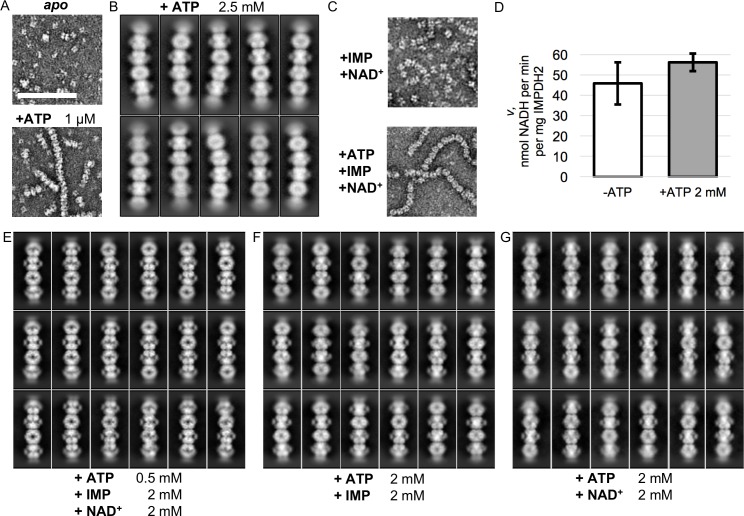
Figure 2.
Electron microscopy of uninhibited IMPDH2 filaments.
( A ) Negative stain EM of purified human IMPDH2.u00a0Treatment with 1 u03bcM ATP induces filament assembly. Scale bar 100 nm. ( B ) Representative 2D class averages from the 2.5 mM ATP cryo-EM datase...
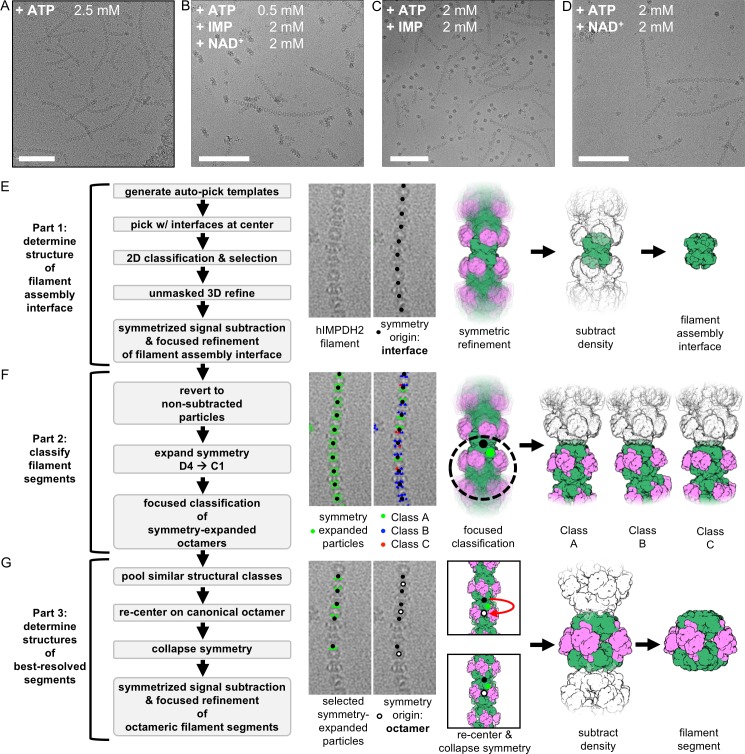
Figure 2u2014figure supplement 1.
A cryo-EM image processing workflow for structure determination of flexible IMPDH2 filaments.
( A-D ) Representative cryo-EM micrographs of IMPDH2 treated with 2.5 mM ATP ( A ), 0.5 mM ATP, 2 mM IMP, and 2 mM NAD + ( B ), 2 mM ATP and 2 mM IMP ( C ), or 2 mM ATP and 2 mM NAD + ( D ).u00a0Full ...
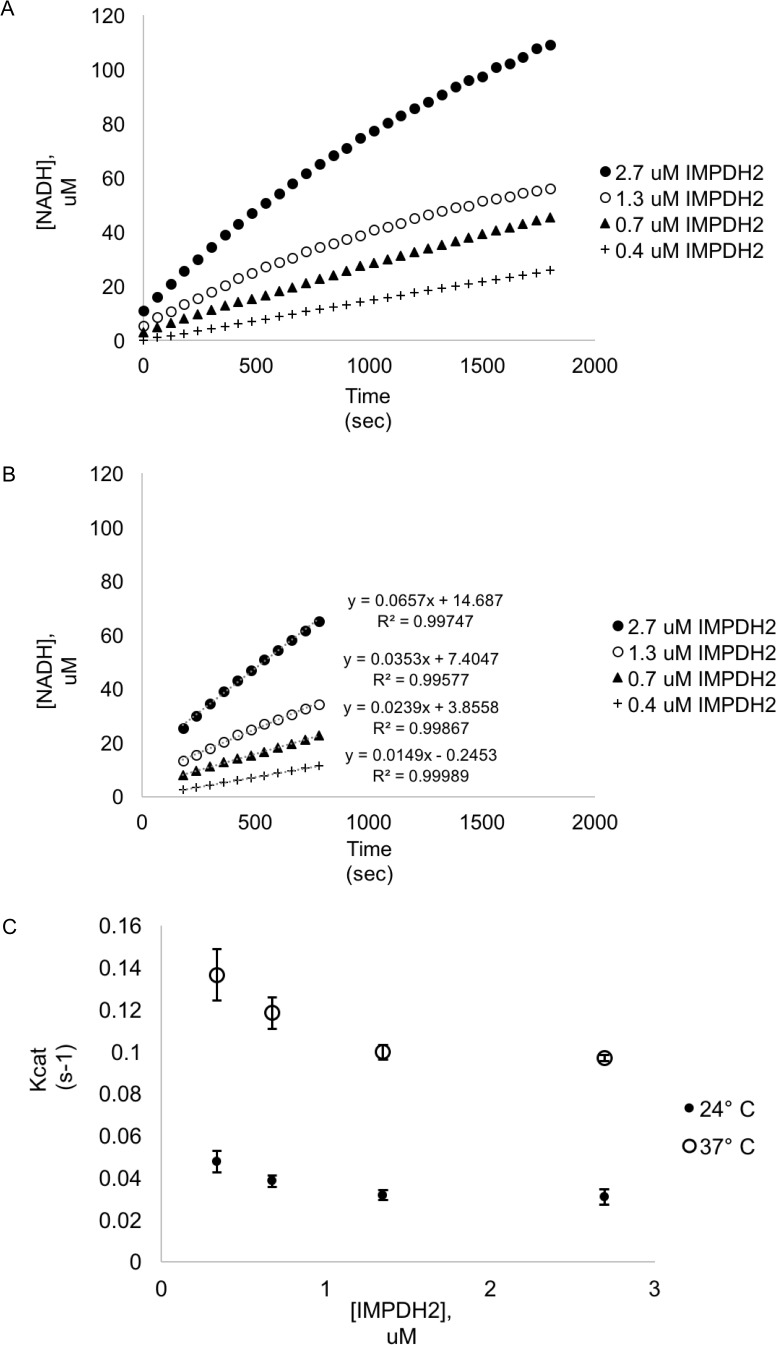
Figure 2u2014figure supplement 2.
Kinetic data of IMPDH2.
( A ) Example spectrophotomer trajectories from IMPDH2 kinetic assays at different protein concentrations (1 mM NAD + , 1 mM IMP). ( B ) The same curves from A), showing only the range used to calcula...
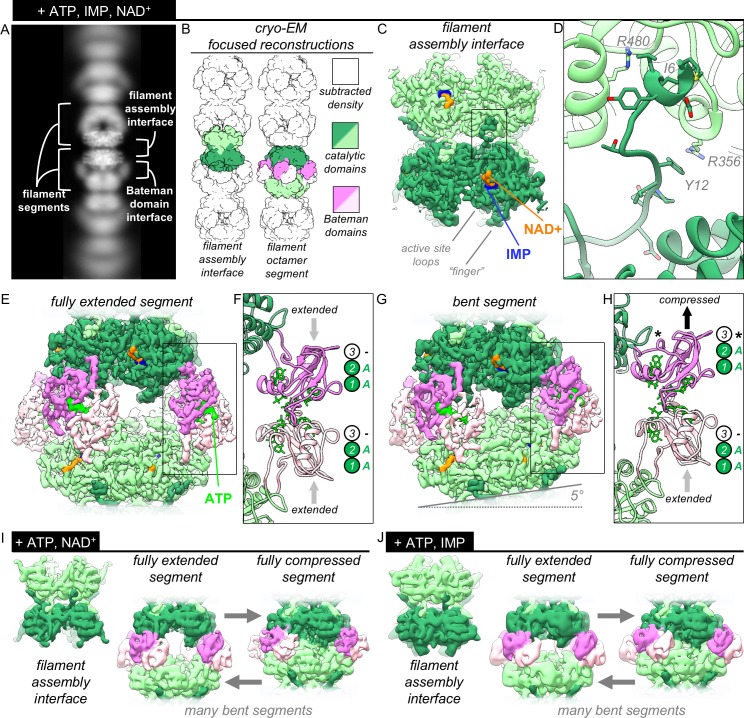
Figure 3.
The structures of uninhibited IMPDH2 filaments.
( A ) Cryo-EM of IMPDH2 filaments with both substrates (representative 2D class average).u00a0( B ) We resolved two types of structures from IMPDH filaments: the consensus filament assembly interface,...
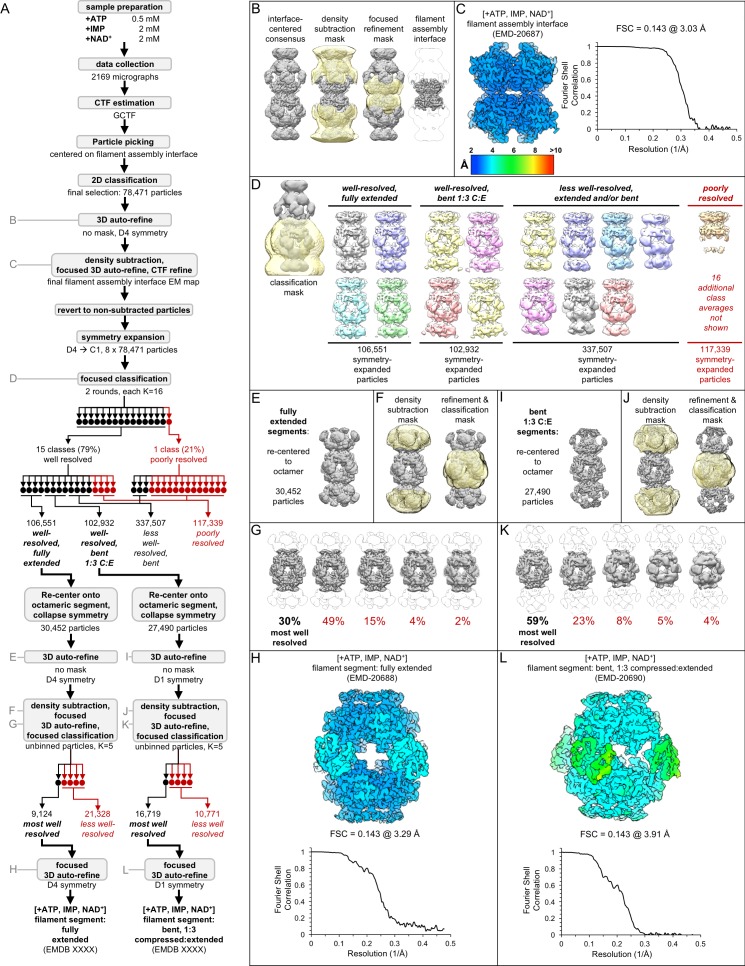
Figure 3u2014figure supplement 1.
Image processing of the IMPDH2 +ATP, IMP, NAD + cryo-EM dataset.
Nucleotide concentrations for this dataset: 0.5 mM ATP, 2 mM IMP, 2 mM NAD + . ( A ) Flow chart summarizing data processing strategy. ( B ) Density subtraction and focused refinement of the consensus ...
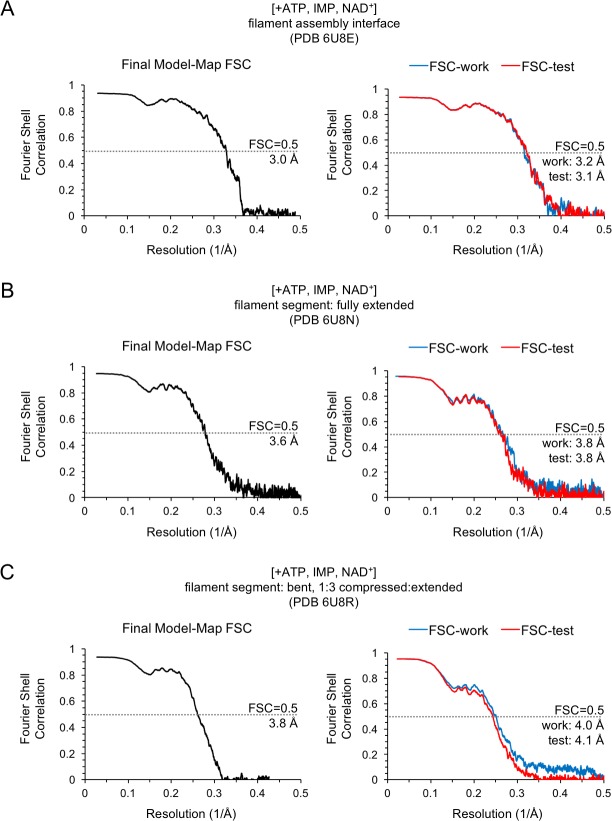
Figure 3u2014figure supplement 2.
Model/Map FSC curves for the IMPDH2 +ATP, IMP, NAD + cryo-EM dataset.
Nucleotide concentrations for this dataset: 0.5 mM ATP, 2 mM IMP, 2 mM NAD + . For each structure, model/map Fourier shell correlations were calculated between the final map and model (left), as well ...
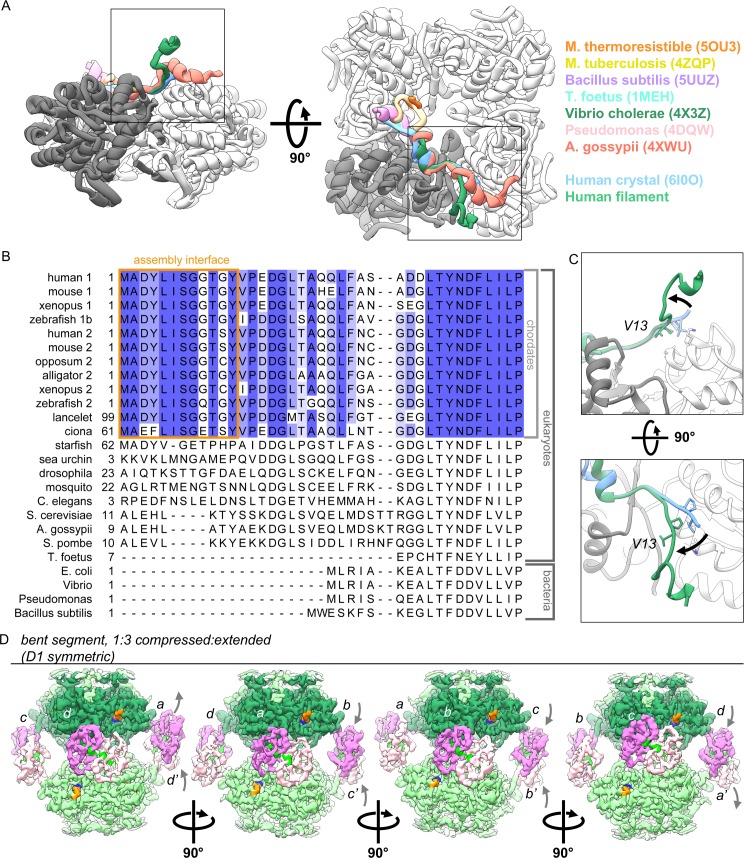
Figure 3u2014figure supplement 3.
The vertebrate-specific N-terminus mediates IMPDH2 assembly of ATP-bound IMPDH2 filaments, in which individual protomers can extend or compress freely.
( A )u00a0The conformation of the N-terminus seen in assembled filaments of human IMPDH2 is unique among solved IMPDH structures, including other human structures. Boxed regions correspond to views in...
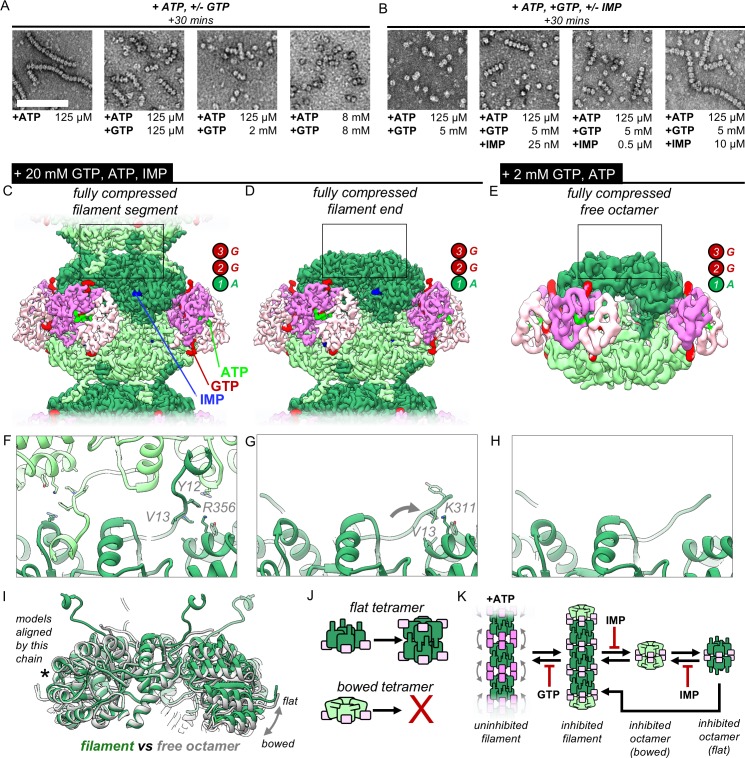
Figure 4.
IMP and GTP allosterically modulate filament assembly and disassembly.
( A ) Roughly 2 mM GTP inhibits filament assembly of IMPDH by ATP. Negative stain EM, protein concentration 2 uM. Scale bar 100 nm. Final nucleotide concentrations for each EM grid were as indicated b...
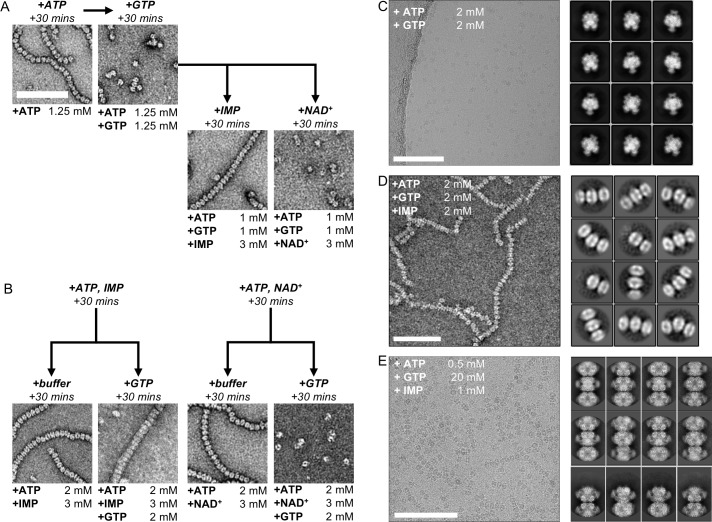
Figure 4u2014figure supplement 1.
Electron microscopy of human IMPDH2 treated with ATP, GTP, IMP, and NAD + .
( A ) IMP, but not NAD+, promotes re-assembly of GTP-disassembled filaments.u00a0Reagents added sequentially, with 30 min room-temperature incubation steps between. Final nucleotide concentrations for...
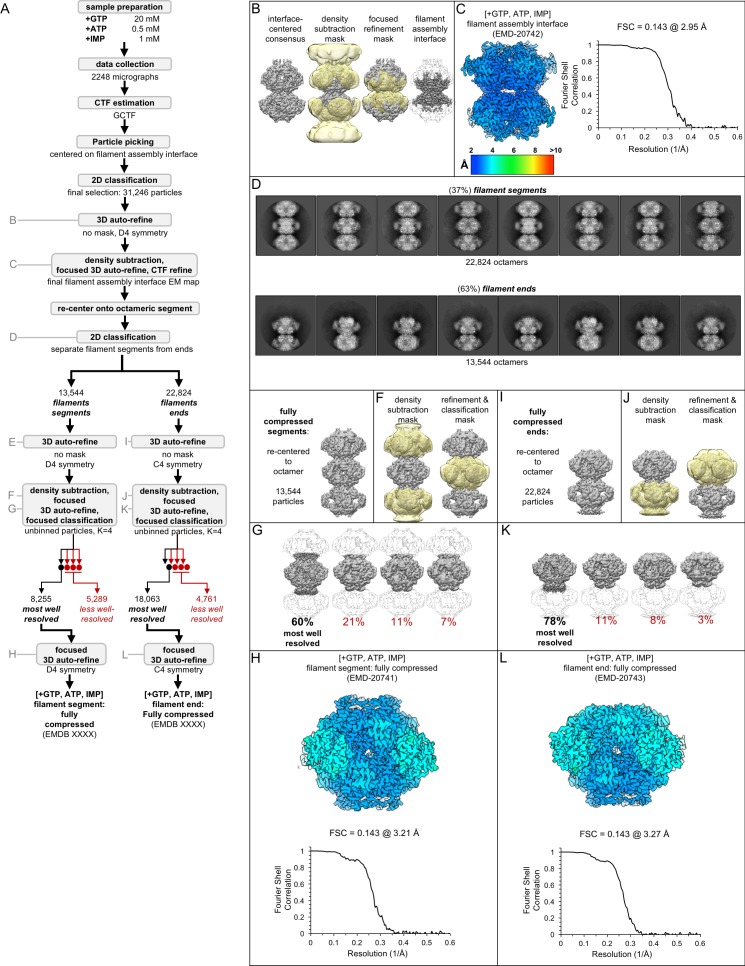
Figure 4u2014figure supplement 2.
Image processing of the IMPDH2 +ATP, IMP, 20 mM GTP cryo-EM dataset.
Nucleotide concentrations for this dataset: 20 mM GTP, 0.5 mM ATP and 1 mM IMP. ( A ) Flow chart summarizing data processing strategy. ( B ) Density subtraction and focused refinement of the consensus...
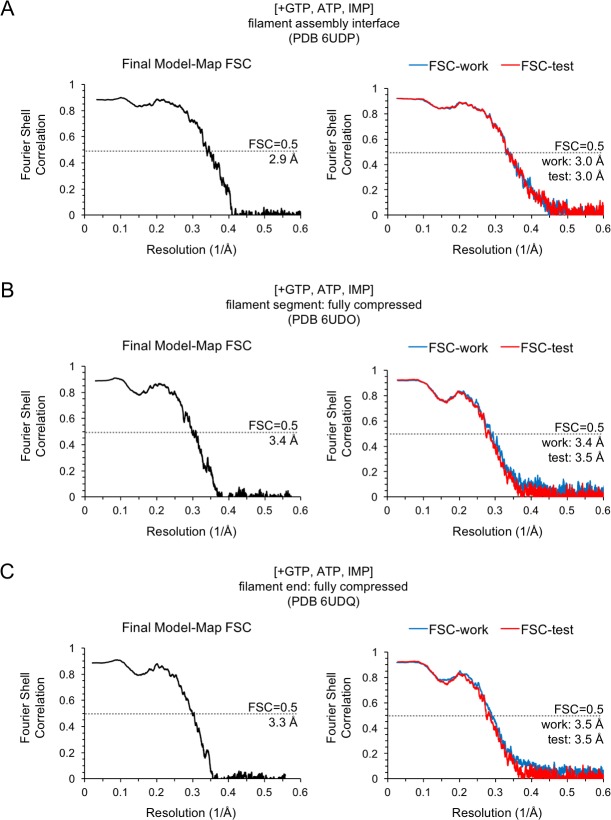
Figure 4u2014figure supplement 3.
Model/Map FSC curves for the IMPDH2 +ATP, IMP, 20 mM GTP cryo-EM dataset.
Nucleotide concentrations for this dataset: 20 mM GTP, 0.5 mM ATP and 1 mM IMP. For each structure, model/map Fourier shell correlations were calculated between the final map and model (left), as well...
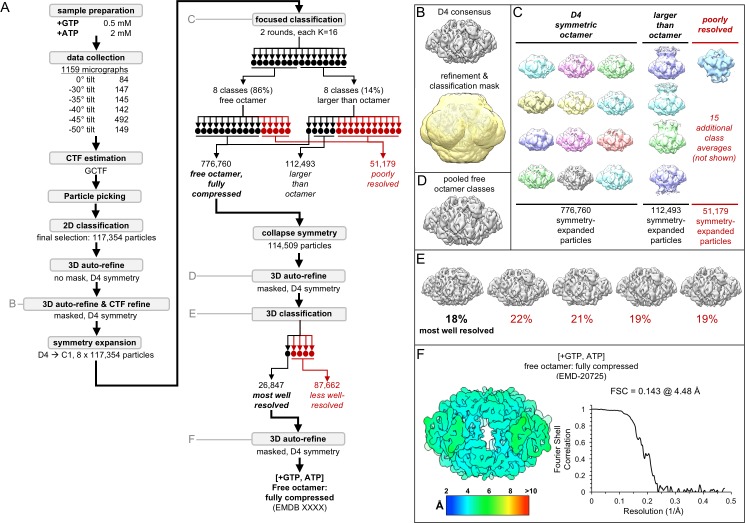
Figure 4u2014figure supplement 4.
Image processing of the IMPDH2 +ATP, 2 mM GTP cryo-EM dataset.
Nucleotide concentrations for this dataset: 2 mM GTP and 2 mM ATP. ( A ) Flow chart summarizing data processing strategy. ( B ) Masked 3D refinement and all particles from 2D classification/refinement...
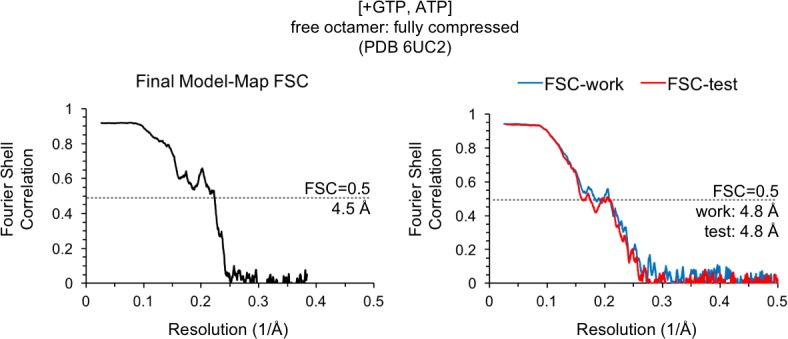
Figure 4u2014figure supplement 5.
Model/Map FSC curves for the IMPDH2 +ATP, 2 mM GTP cryo-EM dataset.
Nucleotide concentrations for this dataset: 2 mM GTP and 2 mM ATP. Model/map Fourier shell correlations were calculated between the final map and model (left), as well as between a model refined again...
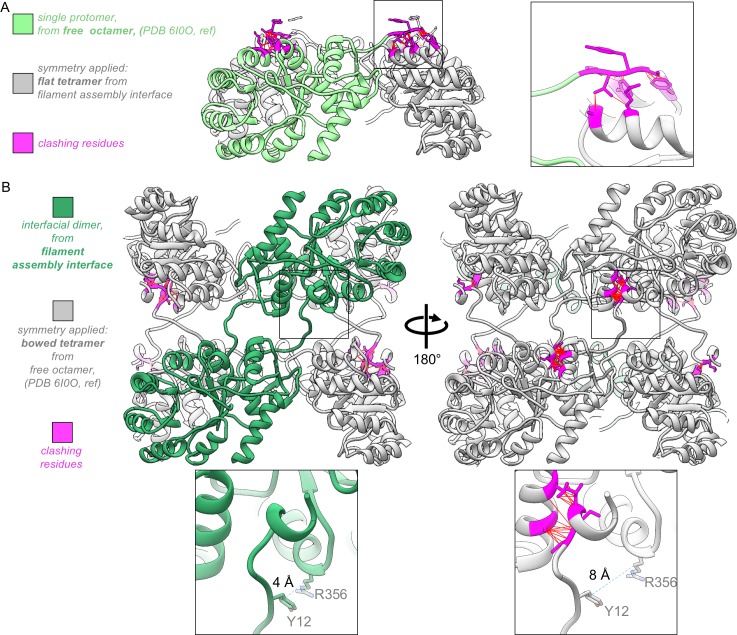
Figure 4u2014figure supplement 6.
The assembled IMPDH2 filament interface is not compatible with the u2018bowedu2019 tetramer conformation seen in the unassembled GTP-bound free octamer.
( A ) The protomer from the +GTP crystal structure 6I0O (green), with applied symmetry from the filament assembly interface u2018flatu2019 tetramer (gray). N-terminus residues that now clash are color...
Video 1.
Comparison between the u2018flatu2019 tetramer of assembled filaments and the u2018bowedu2019 tetramer of free octamers.
Morph comparison between catalytic tetramers of the GTP/ATP/IMP filament assembly interface and the GTP/ATP free octamer. For visualization purposes, we have depicted the complete N-terminus in both c...
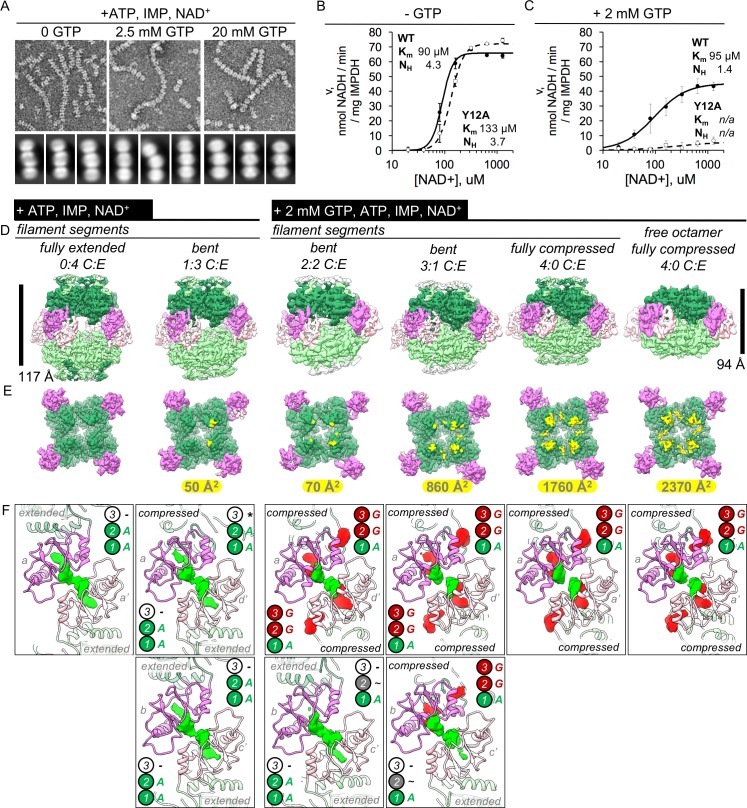
Figure 5.
IMPDH2 filaments resist GTP inhibition by promoting bent octamer conformations that separate opposing active sites.
( A ) Negatively stained EM of uninhibited (left), partially inhibited (center), and fully inhibited (right) IMPDH2. Representative micrographs and reference free 2D class averages. Prepared with 1 mM...
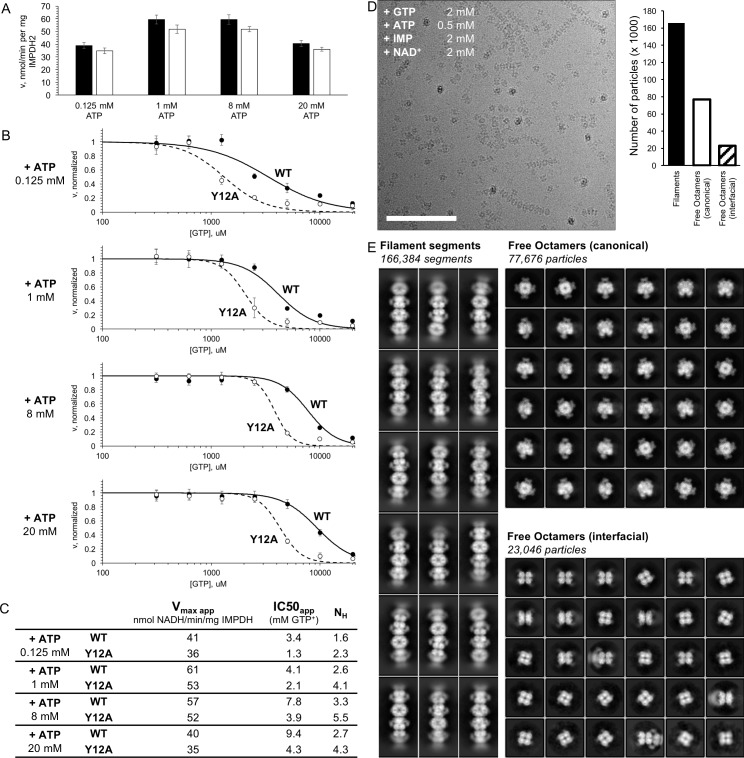
Figure 5u2014figure supplement 1.
IMPDH2 filaments resist GTP inhibition.
( A ) Initial reaction rates for uninhibited WT enzyme and the filament non-assembly mutant Y12A under various ATP concentrations.u00a0High concentrations of ATP likely inhibit by competing with co-su...
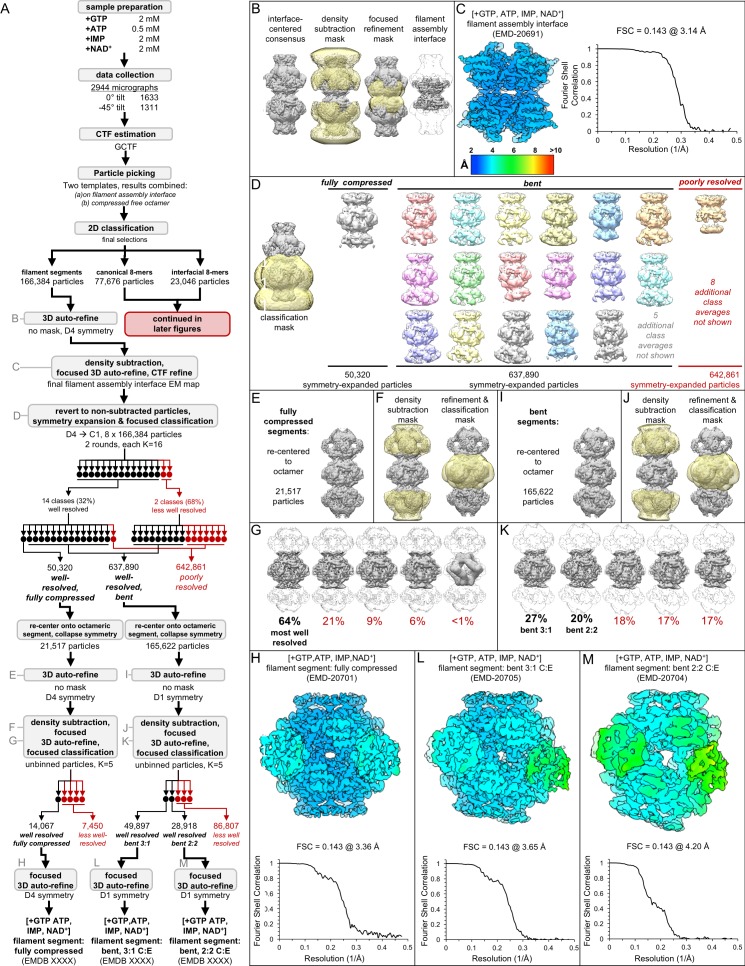
Figure 5u2014figure supplement 2.
Image processing of the IMPDH2 +ATP, IMP, NAD + , 2 mM GTP cryo-EM dataset, part 1: initial processing, and processing of filament segments.
Nucleotide concentrations for this dataset: 2 mM GTP, 0.5 mM ATP, 2 mM IMP, 2 mM NAD + . ( A ) Flow chart summarizing data processing strategy. ( B ) Density subtraction and focused refinement of the ...
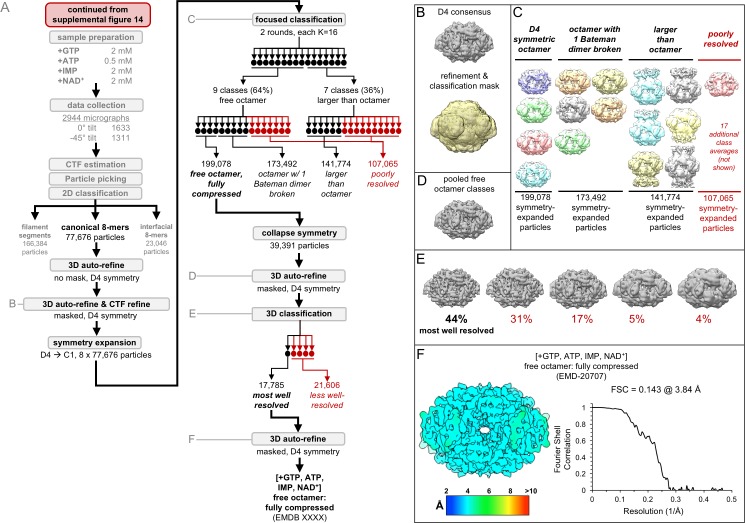
Figure 5u2014figure supplement 3.
Image processing of the IMPDH2 +ATP, IMP, NAD + , 2 mM GTP cryo-EM dataset, part 2: the free canonical octamers.
Nucleotide concentrations for this dataset: 2 mM GTP, 0.5 mM ATP, 2 mM IMP, 2 mM NAD + .u00a0( A ) Flow chart summarizing data processing strategy. ( B ) Masked 3D refinement and all particles from 2D...
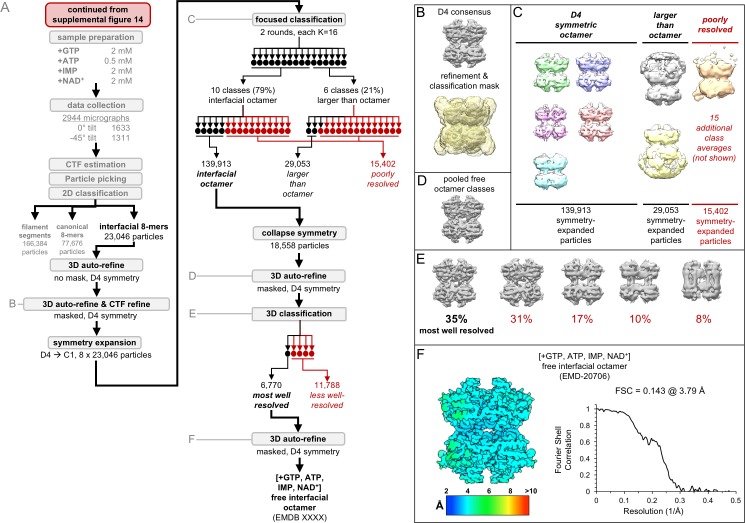
Figure 5u2014figure supplement 4.
Image processing of the IMPDH2 +ATP, IMP, NAD + , 2 mM GTP cryo-EM dataset, part 3: the free interfacial octamers.
Nucleotide concentrations for this dataset: 2 mM GTP, 0.5 mM ATP, 2 mM IMP, 2 mM NAD + .u00a0( A ) Flow chart summarizing data processing strategy. ( B ) Masked 3D refinement and all particles from 2D...
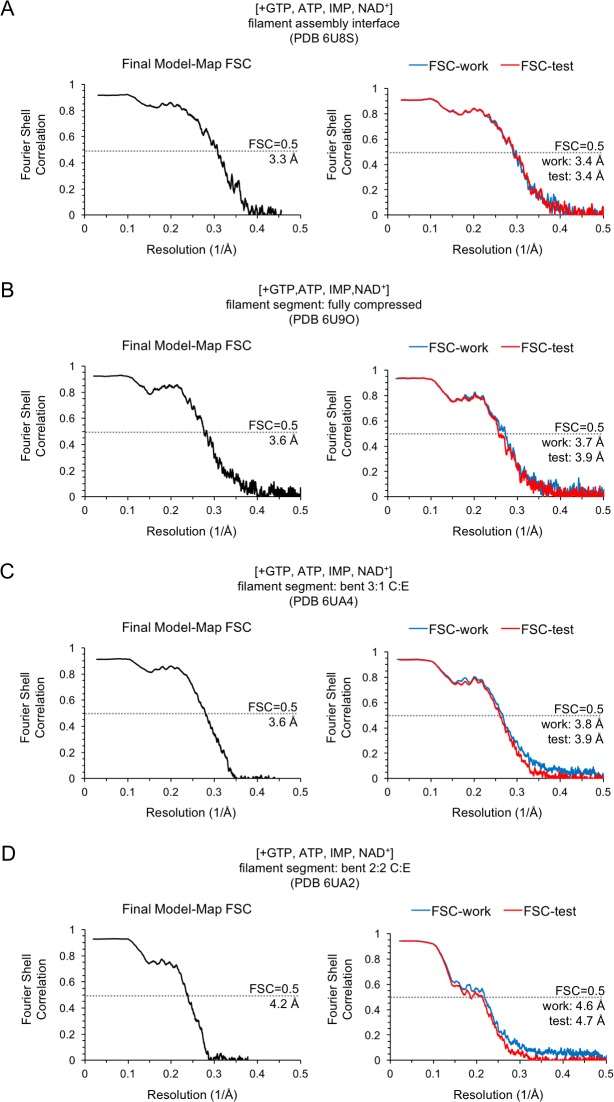
Figure 5u2014figure supplement 5.
Model/Map FSC curves for the IMPDH2 +ATP, IMP, NAD + , 2 mM GTP cryo-EM dataset (filament structures).
Nucleotide concentrations for this dataset: 2 mM GTP, 0.5 mM ATP, 2 mM IMP, 2 mM NAD + . For each structure, model/map Fourier shell correlations were calculated between the final map and model (left)...
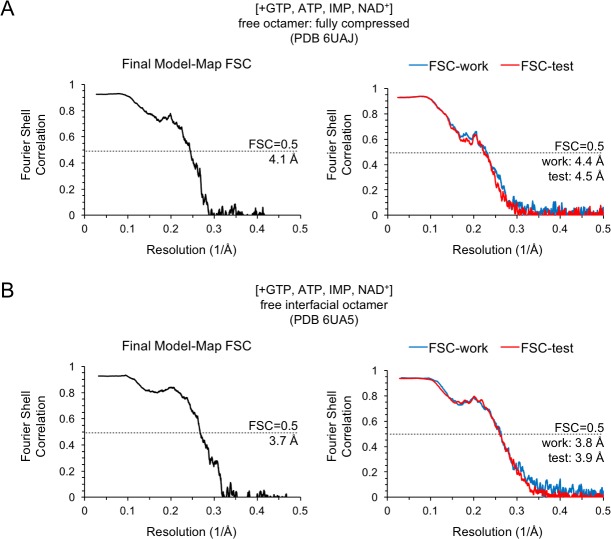
Figure 5u2014figure supplement 6.
Model/Map FSC curves for the IMPDH2 +ATP, IMP, NAD + , 2 mM GTP cryo-EM dataset (non-filament structures).
Nucleotide concentrations for this dataset: 2 mM GTP, 0.5 mM ATP, 2 mM IMP, 2 mM NAD + . For each structure, model/map Fourier shell correlations were calculated between the final map and model (left)...
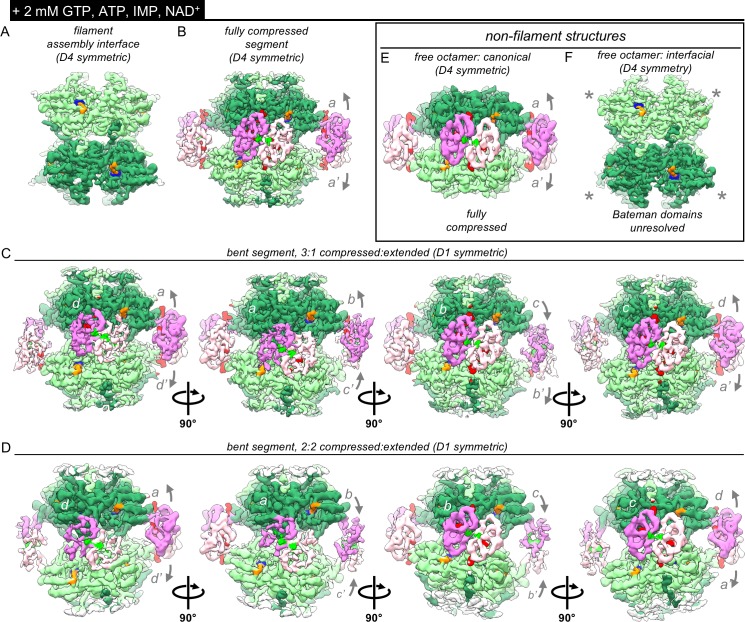
Figure 5u2014figure supplement 7.
Bateman domains of partially inhibited IMPDH2 filaments are in a mix of compressed and extended states.
Nucleotide concentrations for this dataset: 2 mM GTP, 0.5 mM ATP, 2 mM IMP, 2 mM NAD + . ( A ) Cryo-EM density of the consensus filament assembly interface from the ATP/IMP/NAD + /[2 mM]GTP dataset, w...
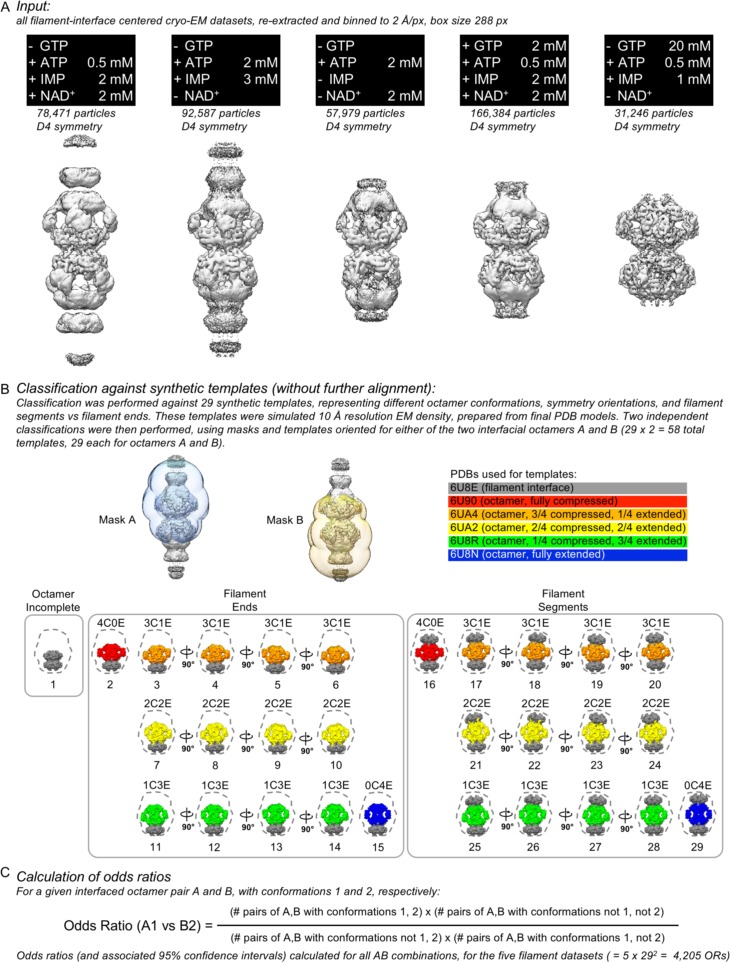
Figure 5u2014figure supplement 8.
Classification of interfaced octamer pairs against synthetic templetes, and calculation of interfaced octamer odds ratios.
( A ) The five interface-centered filament datasets were re-extracted to a common pixel size and box size, large enough to contain both interface octamers (nucleotide concentrations were as shown). ( ...
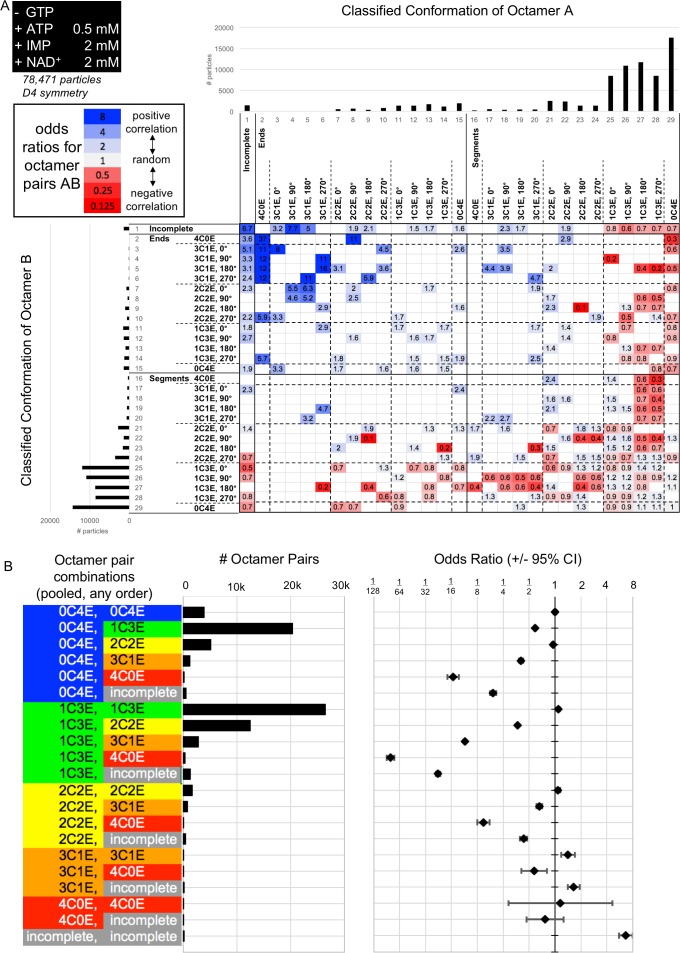
Figure 5u2014figure supplement 9.
Interfaced octamer odds ratios for the 0.5 mM ATP, 2 mM IMP, 2 mM NAD + cryo-EM dataset.
( A ) Class distribution histograms and odds ratios for all combinations of classes of octamer A vs octamer B. Only ORs for which the associated 95% confidence interval does not include 1 are displaye...
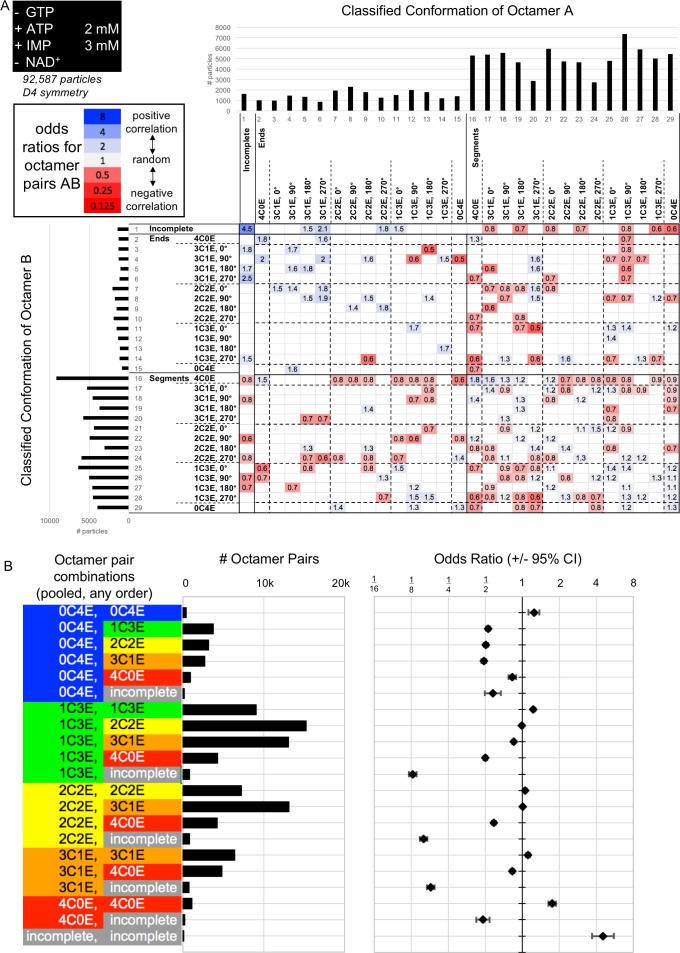
Figure 5u2014figure supplement 10.
Interfaced octamer odds ratios for the 2 mM ATP, 3 mM IMP cryo-EM dataset.
( A ) Class distribution histograms and odds ratios for all combinations of classes of octamer A vs octamer B. Only ORs for which the associated 95% confidence interval does not include 1 are displaye...
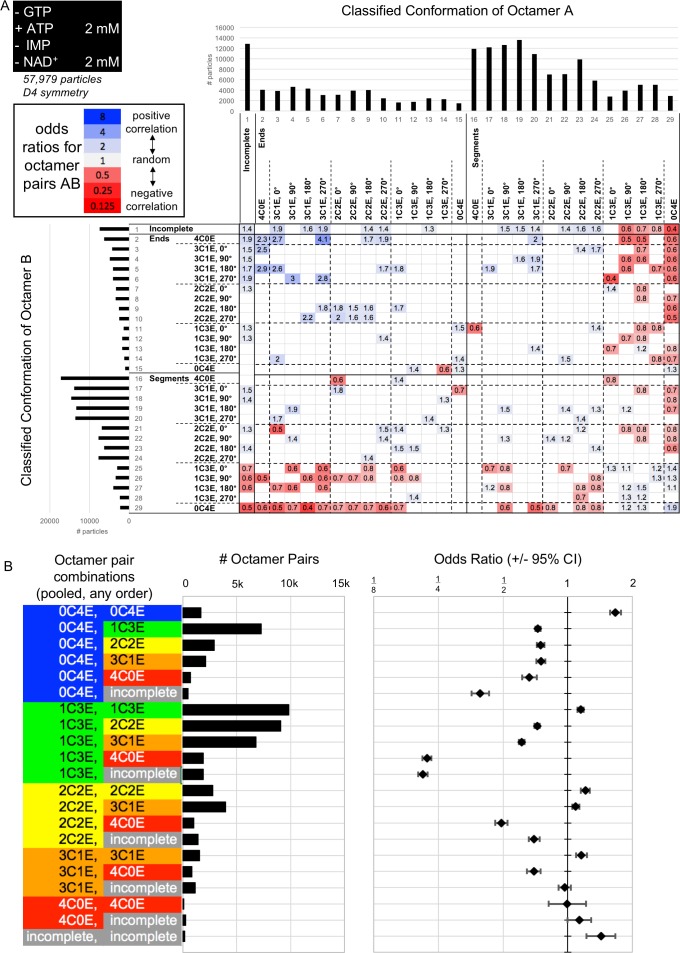
Figure 5u2014figure supplement 11.
Interfaced octamer odds ratios for the 2 ATP, 2 mM NAD + cryo-EM dataset.
( A ) Class distribution histograms and odds ratios for all combinations of classes of octamer A vs octamer B. Only ORs for which the associated 95% confidence interval does not include 1 are displaye...
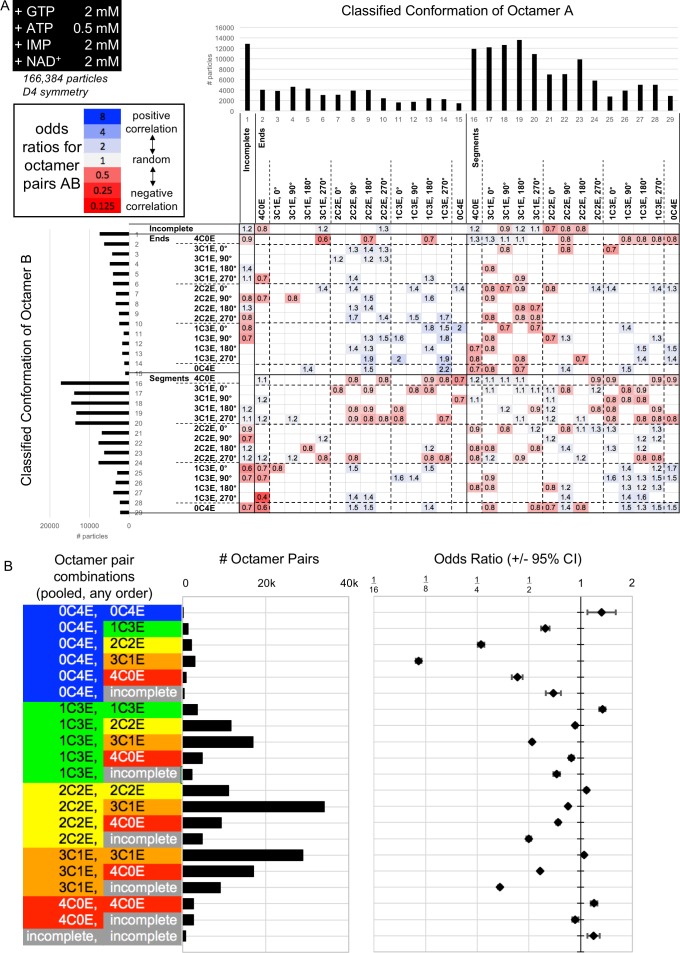
Figure 5u2014figure supplement 12.
Interfaced octamer odds ratios for the 2 mM GTP, 0.5 mM ATP, 2 mM IMP, 2 mM NAD + cryo-EM dataset.
( A ) Class distribution histograms and odds ratios for all combinations of classes of octamer A vs octamer B. Only ORs for which the associated 95% confidence interval does not include 1 are displaye...
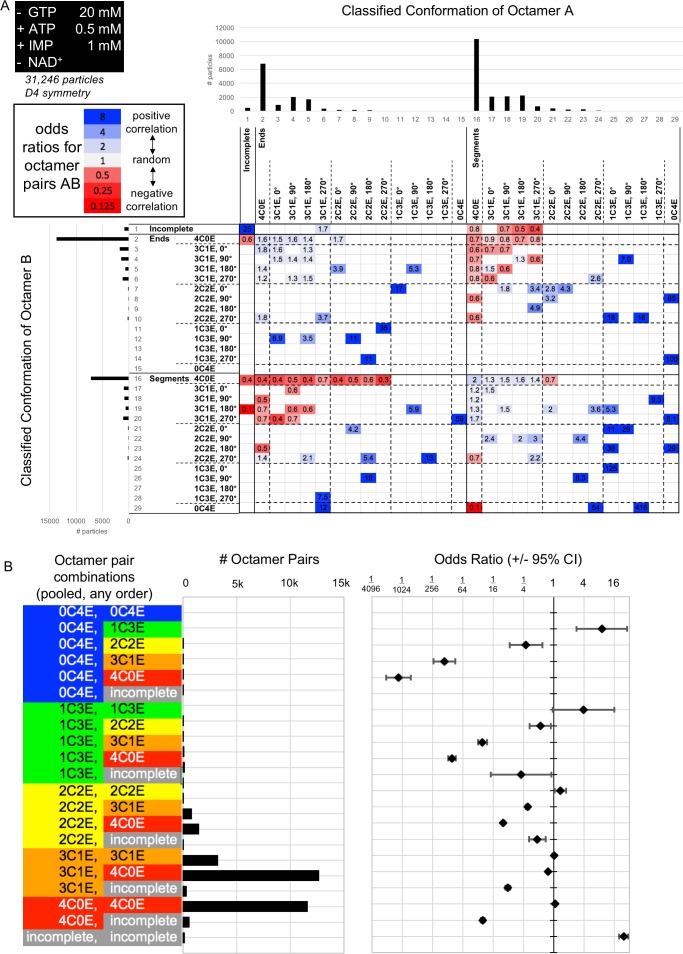
Figure 5u2014figure supplement 13.
Interfaced octamer odds ratios for the 20 mM GTP, 0.5 mM ATP, 1 mM IMP cryo-EM dataset.
( A ) Class distribution histograms and odds ratios for all combinations of classes of octamer A vs octamer B. Only ORs for which the associated 95% confidence interval does not include 1 are displaye...
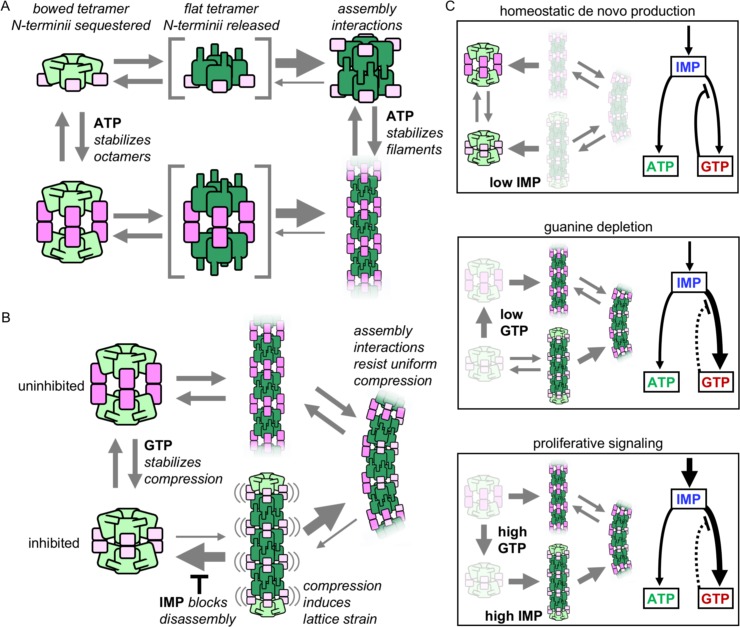
Figure 6.
Model of IMPDH2 assembly and filamentsu2019 role in guanine nucleotide regulation.
( A ) Filament assemble when octamer interactions are stabilized by ATP binding to the regulatory domain (pink), and the N-terminal residues (blue) are released by flattening of the catalytic tetramer...
Figure images are served from the NIH/NLM PubMed Central Open Access Subset or Europe PMC; copyright remains with the publishers and authors.
💬 Discussion
0 commentsNo comments yet. Be the first to start a discussion!
Leave a Comment