Abstract
Hypoosmotic conditions activate volume-regulated anion channels in vertebrate cells. These channels are formed by leucine-rich repeat-containing protein 8 (LRRC8) family members and contain LRRC8A in homo- or hetero-hexameric assemblies. Here, we present single-particle cryo-electron microscopy structures of Mus musculus LRRC8A in complex with the inhibitor DCPIB reconstituted in lipid nanodiscs. DCPIB plugs the channel like a cork in a bottle - binding in the extracellular selectivity filter and sterically occluding ion conduction. Constricted and expanded structures reveal coupled dilation of cytoplasmic LRRs and the channel pore, suggesting a mechanism for channel gating by internal stimuli. Conformational and symmetry differences between LRRC8A structures determined in detergent micelles and lipid bilayers related to reorganization of intersubunit lipid binding sites demonstrate a critical role for the membrane in determining channel structure. These results provide insight into LRRC8 gating and inhibition and the role of lipids in the structure of an ionic-strength sensing ion channel.
🔬 Techniques
🔭 Microscopes
🧬 Organisms
💻 Software
✨ Fluorophores
🧪 Sample Preparation
🏭 Microscope Brands
🧪 Reagent Suppliers
📷 Detectors
💻 Software Details
💾 Data Repositories
🏷️ Research Resource Identifiers (RRIDs)
Verified research resources used in this paper:
🏛️ Research Organizations (ROR)
Affiliated research institutions:
📋 Methods
Key resources table
Reagent type (species) or resource Designation Source or reference Identifiers Additional information Gene ( Mus musculus ) LRRC8A Gen9 synthesis Uniprot: Q80WG5 Codon-optimized for Spodoptera frugiperda Cell Line ( Spodoptera frugiperda ) Sf9 Expression Systems Catalog Number: 94–001F Peptide, recombinant protein MSP1E3D1 Prepared as described in doi: 10.1016/S0076-6879(09)64011–8 His-tag cleaved Peptide, recombinant protein MSP2N2 Prepared as described in doi: 10.1016/S0076-6879(09)64011–8 His-tag cleaved Chemical compound, drug DDM Anatrace Part Number: D310S Chemical compound, drug CHS Anatrace Part Number: CH210 Chemical compound, drug Digitonin EMD Chemicals CAS 11024-24-1 Chemical compound, drug 16:0-18:1 PC (POPC) lipid Avanti Polar Lipids SKU: 850457C Chemical compound, drug DCPIB Tocris CAS Number: 82749-70-0, Catalog Number: 1540 Software, algorithm RELION doi: 10.7554/eLife.42166 Relion 3.0 Software, algorithm Gctf doi: 10.1016/j.jsb.2015.11.003 Gctf v1.06 Software, algorithm UCSF Chimera UCSF RRID: SCR_004097 http://plato.cgl.ucsf.edu/chimera/ Software, algorithm COOT RRID: SCR_014222 http://www2.mrc-lmb.cam.ac.uk/personal/pemsley/coot/ Software, algorithm Phenix RRID: SCR_014224 https://www. phenix-online.org/ Software, algorithm PyMOL PyMOL MolecularGraphicsSystem, Schrodinger LLC RRID: SCR_000305 https://www.pymol.org/ Protein expression The coding sequence for LRRC8A from Mus musculus was codon optimized for Spodoptera frugiperda and synthesized (Gen9, Cambridge, MA). The sequence was then cloned into a custom vector based on the pACEBAC1 backbone (MultiBac; Geneva Biotech, Geneva, Switzerland) with an added C-terminal PreScission protease (PPX) cleavage site, linker sequence, superfolder GFP (sfGFP) and 7xHis tag, generating a construct for expression of mmLRRC8A-SNS-LEVLFQGP-SRGGSGAAAGSGSGS-sfGFP-GSS-7xHis. MultiBac cells were used to generate a Bacmid according to manufacturer’s instructions. Spodoptera frugiperda (Sf9) cells were cultured in ESF 921 medium (Expression Systems, Davis, CA) and P1 virus was generated from cells transfected with Cellfectin II reagent (Life Technologies, Carlsbad, CA) according to manufacturer’s instructions. P2 virus was then generated by infecting cells at 2 million cells/mL with P1 virus at an MOI ~ 0.1, with infection monitored by fluorescence of sfGFP-tagged protein and harvested at 72 hr. P3 virus was generated in a similar manner to expand the viral stock. The P3 viral stock was then used to infect 1 L of Sf9 cells at 4 million cells/mL at an MOI ~ 2–5. At 72 hr, infected cells containing expressed LRRC8A-sfGFP protein were harvested by centrifugation at 2500 x g and frozen at −80°C.
Show full methods section
Key resources table
Reagent type (species) or resource Designation Source or reference Identifiers Additional information Gene ( Mus musculus ) LRRC8A Gen9 synthesis Uniprot: Q80WG5 Codon-optimized for Spodoptera frugiperda Cell Line ( Spodoptera frugiperda ) Sf9 Expression Systems Catalog Number: 94–001F Peptide, recombinant protein MSP1E3D1 Prepared as described in doi: 10.1016/S0076-6879(09)64011–8 His-tag cleaved Peptide, recombinant protein MSP2N2 Prepared as described in doi: 10.1016/S0076-6879(09)64011–8 His-tag cleaved Chemical compound, drug DDM Anatrace Part Number: D310S Chemical compound, drug CHS Anatrace Part Number: CH210 Chemical compound, drug Digitonin EMD Chemicals CAS 11024-24-1 Chemical compound, drug 16:0-18:1 PC (POPC) lipid Avanti Polar Lipids SKU: 850457C Chemical compound, drug DCPIB Tocris CAS Number: 82749-70-0, Catalog Number: 1540 Software, algorithm RELION doi: 10.7554/eLife.42166 Relion 3.0 Software, algorithm Gctf doi: 10.1016/j.jsb.2015.11.003 Gctf v1.06 Software, algorithm UCSF Chimera UCSF RRID: SCR_004097 http://plato.cgl.ucsf.edu/chimera/ Software, algorithm COOT RRID: SCR_014222 http://www2.mrc-lmb.cam.ac.uk/personal/pemsley/coot/ Software, algorithm Phenix RRID: SCR_014224 https://www. phenix-online.org/ Software, algorithm PyMOL PyMOL MolecularGraphicsSystem, Schrodinger LLC RRID: SCR_000305 https://www.pymol.org/ Protein expression The coding sequence for LRRC8A from Mus musculus was codon optimized for Spodoptera frugiperda and synthesized (Gen9, Cambridge, MA). The sequence was then cloned into a custom vector based on the pACEBAC1 backbone (MultiBac; Geneva Biotech, Geneva, Switzerland) with an added C-terminal PreScission protease (PPX) cleavage site, linker sequence, superfolder GFP (sfGFP) and 7xHis tag, generating a construct for expression of mmLRRC8A-SNS-LEVLFQGP-SRGGSGAAAGSGSGS-sfGFP-GSS-7xHis. MultiBac cells were used to generate a Bacmid according to manufacturer’s instructions. Spodoptera frugiperda (Sf9) cells were cultured in ESF 921 medium (Expression Systems, Davis, CA) and P1 virus was generated from cells transfected with Cellfectin II reagent (Life Technologies, Carlsbad, CA) according to manufacturer’s instructions. P2 virus was then generated by infecting cells at 2 million cells/mL with P1 virus at an MOI ~ 0.1, with infection monitored by fluorescence of sfGFP-tagged protein and harvested at 72 hr. P3 virus was generated in a similar manner to expand the viral stock. The P3 viral stock was then used to infect 1 L of Sf9 cells at 4 million cells/mL at an MOI ~ 2–5. At 72 hr, infected cells containing expressed LRRC8A-sfGFP protein were harvested by centrifugation at 2500 x g and frozen at −80°C.
Protein purification
Cells from 1 L of culture (~15–20 mL of cell pellet) were thawed in 100 mL of Lysis Buffer containing (in mM) 50 HEPES, 150 KCl, 1 EDTA pH 7.4. Protease inhibitors (Final Concentrations: E64 (1 µM), Pepstatin A (1 µg/mL), Soy Trypsin Inhibitor (10 µg/mL), Benzimidine (1 mM), Aprotinin (1 µg/mL), Leupeptin (1 µg/mL), and PMSF (1 mM)) were added to the lysis buffer immediately before use. Benzonase (4 µl) was added after cell thaw. Cells were then lysed by sonication and centrifuged at 150,000 x g for 45 min. The supernatant was discarded and residual nucleic acid was removed from the top of the membrane pellet using DPBS. Membrane pellets were scooped into a dounce homogenizer containing Extraction Buffer (50 mM HEPES, 150 mM KCl, 1 mM EDTA, 1% n-Dodecyl-β-D-Maltopyranoside (DDM, Anatrace, Maumee, OH), 0.2% Cholesterol Hemisuccinate Tris Salt (CHS, Anatrace) final pH 7.4). A 10%/2% solution of DDM/CHS was dissolved and clarified by bath sonication in 200 mM HEPES pH eight prior to addition to buffer to the indicated final concentration. Membrane pellets were then homogenized in Extraction Buffer and this mixture (150 mL final volume) was gently stirred at 4°C for 3 hr. The extraction mixture was centrifuged at 33,000 x g for 45 min and the supernatant, containing solubilized membrane protein, was bound to 4 mL of sepharose resin coupled to anti-GFP nanobody for 1 hr at 4°C. The resin was then collected in a column and washed with 10 mL of Buffer 1 (20 mM HEPES, 150 mM KCl, 1 mM EDTA, 0.025% DDM, pH 7.4), 40 mL of Buffer 2 (20 mM HEPES, 500 mM KCl, 1 mM EDTA, 0.025% DDM, pH 7.4), and 10 mL of Buffer 1. The resin was then resuspended in 6 mL of Buffer 1 with 0.5 mg of PPX and rocked gently in the capped column for 2 hr. Cleaved LRRC8A protein was then eluted with an additional 8 mL of Wash Buffer, spin concentrated to ~500 µl with Amicon Ultra spin concentrator 100 kDa cutoff (Millipore), and then loaded onto a Superose 6 Increase column (GE Healthcare, Chicago, IL) on an NGC system (Bio-Rad, Hercules, CA) equilibrated in buffer 1. Peak fractions containing LRRC8A channel were then collected and spin concentrated. Purification in digitonin was performed analogously with the following modifications. Tris buffer was used instead of HEPES buffer during purification. Washing and cleavage steps were carried out in 0.1% DDM and 0.02% CHS and cleavage was performed overnight. Digitonin (EMD Chemicals Inc, San Diego, CA) Buffer containing 20 mM Tris, (70, 150, or 600) mM KCl, 1 mM EDTA, 0.05% Digitonin (final pH 8) was prepared by dissolving digitonin in buffer at room temperature, cooling buffer to 4°C, and 0.2 µm filtering the buffer to remove insoluble material. Protein was exchanged into digitonin buffer by gel filtration in a Superose 6 Increase column. Fractions containing LRRC8A channel were pooled and spin concentrated.
Electrophysiology
For proteoliposome patching experiments, we incorporated protein into lipid and generated proteoliposome blisters for patch recordings using dehydration and rehydration as described previously ( Brohawn et al., 2014 ; Del Mármol et al., 2018 ) with the following modifications. LRRC8A was first purified into Column Buffer with DDM/CHS at 0.025%/0.005%. Protein was then exchanged into lipid with the addition of Biobeads SM2 and an overnight incubation. Dried proteoliposomes in a dish were rehydrated overnight in a buffer containing 10 mM HEPES, 70 mM KCl, pH 7.4. The next day, the dish was filled with a bath solution containing 10 mM HEPES, 20 mM MgCl 2 , 30 mM KCl pH 7.4. The pipette solution was 10 mM HEPES, 70 mM KCl, pH 7.4. All experiments were conducted at room temperature. Nanodisc formation Freshly purified LRRC8A from gel filtration in Buffer one was reconstituted into MSP1E3D1 nanodiscs with POPC lipid (Avanti, Alabaster, Alabama) at a final molar ratio of 1:2.5:250 (Monomer Ratio: LRRC8A, MSP1E3D1, POPC). First, solubilized lipid in Column Buffer (20 mM HEPES, 150 mM KCl, 1 mM EDTA pH 7.4) was mixed with additional DDM detergent, Column Buffer, and LRRC8A. This solution was mixed at 4°C for 30 min before addition of purified MSP1E3D1. This addition brought the final concentrations to approximately 10 µM LRRC8A, 25 µM MSP1E3D1, 2.5 mM POPC, and 4 mM DDM in Column Buffer. The solution with MSP1E3D1 was mixed at 4°C for 30 min before addition of 160 mg of Biobeads SM2 (Bio-Rad). Biobeads (washed into methanol, water, and then Column Buffer) were weighed with liquid removed by P1000 tip (Damp weight). This mix was incubated at 4°C for 30 min before addition of another 160 mg of Biobeads (final 320 mg of Biobeads per mL). This final mixture was then mixed at 4°C overnight (~12 hr). Supernatant was cleared of beads by letting large beads settle and by 0.2 µm filtering. Sample was spun for 5 min at 21,000 x g before loading onto a Superose six column in Column Buffer. Peak fractions corresponding to LRRC8A in MSP1E3D1 were collected, 100 kDa cutoff spin concentrated, and then re-run on the Superose 6. The fractions corresponding to the center of the peak were then pooled and concentrated prior to grid preparation. For MSP2N2 nanodiscs, reconstitution was carried out with a molar ratio of 1:2:300 (Monomer Ratio: LRRC8A, MSP2N2, POPC (Avanti)). The final 1 mL reaction mix contained 5 µM LRRC8A monomer, 10 µM MSP2N2, 1.5 mM POPC,~2.6 mM DDM, and 200 mg of Biobeads in Column Buffer. Column purification was performed similarly to the MSP1E3D1 preparation. Nanodisc proteins were prepared as described in Ritchie et al. (2009) and His-tags were cleaved with TEV protease.
Grid preparation
For the MSP1E3D1 nanodisc samples, 100 µM of DCPIB (Tocris, Bristol, UK) was added to sample to give a final concentration of 0.8 mg/mL LRRC8A-MSP1E3D1. DCPIB was allowed to equilibrate and bind complex on ice for 1 hr prior to freezing grids. Sample with drug was cleared by a 5 min 21,000 x g spin prior to grid making. For freezing grids, a 3 µl drop of protein was applied to freshly glow discharged Holey Carbon, 400 mesh R 1.2/1.3 gold grids (Quantifoil, Großlöbichau, Germany). A FEI Vitrobot Mark IV (ThermoFisher Scientific) was utilized with 22°C, 100% humidity, one blot force, and a 3 s blot time, before plunge freezing in liquid ethane. Grids were then clipped in autoloader cartridges (FEI, Hillsboro, Oregon) and shipped in a dry shipper for data collection. The MSP2N2 sample was frozen without drug at 0.8 mg/mL with the same conditions as the MSP1E3D1 grids. For the digitonin sample, purified protein was shipped in a refrigerated container. The next day, for freezing, a 3 µL drop of protein was applied to a freshly glow discharged Holey Carbon, 400 mesh R 1.2/1.3 gold grid (Quantifoil). A FEI Vitrobot Mark IV (ThermoFisher Scientific) was utilized with 22°C, 100% humidity, one blot force, and a 5 s blot time, before plunge freezing in liquid ethane. Grids were then clipped and used for data collection.
Cryo-EM data acquisition
For the digitonin-solubilized channels in 150 and 600 mM KCl, grids were transferred to an FEI Titan Krios cryo-EM operated at an acceleration voltage of 300 kV. Images were recorded in an automated fashion with SerialEM ( Mastronarde, 2005 ) with a defocus range of −1.2 ~ −2.5 µm over 8 s as 40 subframes with a Gatan K2 direct electron detector in super-resolution mode with a super-resolution pixel size of 0.544 Å. The electron dose was 8 e - /pixel/s at the detector level and total accumulated dose was 54 e - /Å 2 . For the digitonin-solublized channels in 70 mM KCl, grids were transferred to an FEI Titan Krios cryo-EM operated at an acceleration voltage of 300 kV. Images were recorded in an automated fashion with Leginon ( Suloway et al., 2005 ) with a defocus range of −1.2 ~ −2.5 µm over 8 s as 40 subframes with a Gatan K2 direct electron detector in super-resolution mode with a super-resolution pixel size of 0.536 Å. The electron dose was 9 e - /pixel/s at the detector level and total accumulated dose was 55.6 e - /Å 2 . For MSP2N2 nanodisc-reconstituted samples, grids were transferred to an FEI Titan Krios cryo-EM operated at an acceleration voltage of 300 kV. Images were recorded in an automated fashion with Leginon with a defocus range of −1.2 ~ −2.5 µm over 10 s as 40 subframes with a Gatan K2 direct electron detector in super-resolution mode with a super-resolution pixel size of 0.536 Å. The MSP1E3D1 nanodisc-reconstituted samples were recorded in two sessions. For the first session, grids were transferred to an FEI Titan Krios cryo-EM operated at an acceleration voltage of 300 kV. Images were recorded in an automated fashion with SerialEM with a defocus range of −1.2 ~ −2.5 µm over 8 s as 40 subframes with a Gatan K2 direct electron detector in super-resolution mode with a super-resolution pixel size of 0.544 Å. The electron dose was 9 e - /pixel/s at the detector level and total accumulated dose was 60.8 e - /Å 2 . For the second session, grids were transferred to an FEI Titan Krios cryo-EM operated at an acceleration voltage of 300 kV. Images were recorded in an automated fashion with Leginon with a defocus range of −1.2 ~ −2.5 µm over 8 s as 40 subframes with a Gatan K2 direct electron detector in super-resolution mode with a super-resolution pixel size of 0.536 Å. The electron dose was 9 e - /pixel/s at the detector level and total accumulated dose was 55.6 e - /Å 2 . Also see Tables 1 and 2.
Cryo-EM data processing
Processing was carried out using Relion 3.0 ( Zivanov et al., 2019 ; Zivanov et al., 2018 ). Movies were gain and motion corrected with the Relion MotionCor2 package (standalone MotionCor2 for the digitonin datasets) ( Zheng et al., 2017 ), and the data were binned to 1.088 Å/pixel. Ctf estimation was performed with Gctf 1.06. For particle picking, 1000–2000 particles were picked manually to generate references for autopicking. For the MSP1E3D1 and MSP2N2 Relion-3 processed datasets, 2x particle binning was performed at extraction for initial particle cleanup, before re-extraction to 1.088 Å/pixel for final classification and refinement. For the other datasets, particles were 2x binned for all processing steps except final 2D comparisons. For the contracted and expanded LRRC8A states, we first noted differences in the linker region during initial full particle classing and blurred helical density in this region during full particle refinement. We therefore used a mask encompassing the linker region and the bottom of the transmembrane helices during classification without angular sampling to separate particles in these two classes. To obtain high-resolution particles for the final reconstruction, masking out the LRR region was crucial. For the final particle sets, we also performed unmasked refinement, which generated the full particle map shown in Figure 1 for the contracted state. The full particles for the expanded state were consistently more difficult to refine to high resolution and also saw no benefit from Ctf Refinement, potentially due to their additional LRR heterogeneity. For symmetry testing on the digitonin, MSP2N2, and MSP1E3D1 datasets, 2x binned particles (2.176 Å/pixel or 2.298 Å/pixel for MSP2N2) were first cleaned using 2D classification and 3D Classification using C1 symmetry with the same Gaussian filtered initial reference. For final symmetry analysis, three 3D Classifications were performed using the same reference and C1, C3, and C6 symmetry operations. For further comparison of digitonin and MSP2N2 particles, the best C1 classes were then used for final refinements in C3 and C6. Overall resolution was estimated using Relion 3.0 and Phenix.mtriage. Local resolution was calculated using Relion. For a detailed pipeline see Figure 1—figure supplements 3 – 10 .
Modeling and refinement
Cryo-EM maps were sharpened using Phenix.autosharpen. The structures were modeled ab inito in Coot for all regions outside of the LRRs and refined in real space using Phenix.real_space_refine implementing Ramachandran and NCS restraints. Restraints for DCPIB and POPC ligands were generated using Phenix.elbow from SMILES string inputs and optimized with the eLBOW AM1 QM method. Validation tools in Phenix, EMRinger ( Barad et al., 2015 ), and Molprobity were used to guide two subsequent rounds of iterative manual adjustment in Coot and refinement in Phenix. For cross-validation, atoms in the final model were randomly displaced up to 0.5 Å and refined against one half-map (‘work’). FSC curves were then calculated between the refined model and each half-map (‘work’ and ‘free’) using Phenix.mtriage. The absence of significant differences between the FSC curves is indicates the model was not overfit to the original map. Superpositions with published LRRC8A-detergent structures, which were not used as guides during model building, also demonstrate good overall correspondence aside from symmetry and conformational changes. For illustration of average LRR position in Figure 1 , the 1.8 Å crystal structure from PDB 6FNW was docked as a rigid body into unmasked maps using Phenix. Channel cavity measurements were made with HOLE implemented in Coot. Electrostastic potential was calculated using APBS-PDB2PQR ( Dolinsky et al., 2004 ). Figures were prepared using PyMOL, Chimera, ChimeraX, Fiji, Prism, and Adobe Photoshop and Illustrator software.
Additional files Transparent reporting form
📊 Figures
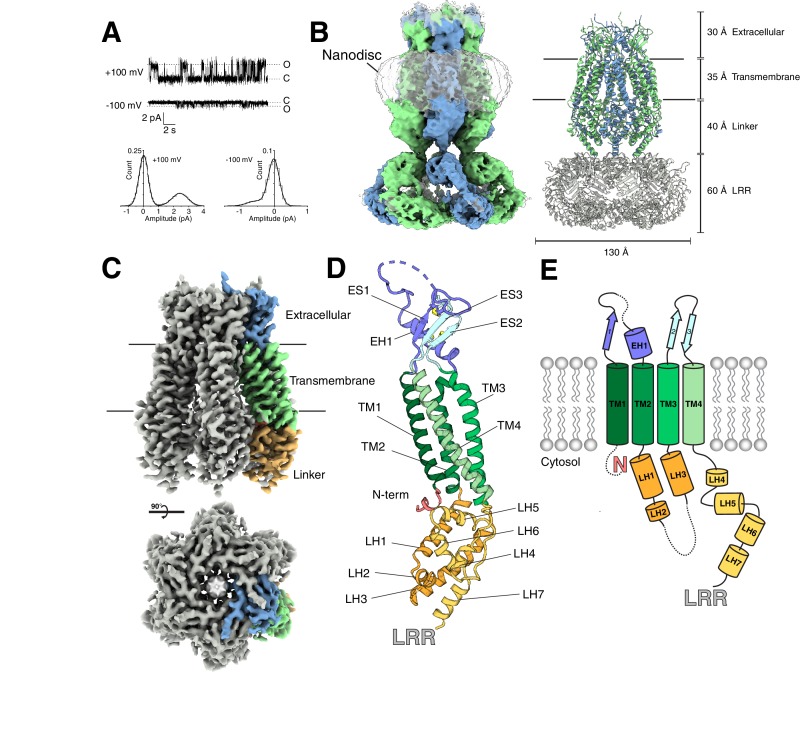
Figure 1.
Structure of an LRRC8A-DCPIB complex in lipid nanodiscs.
( A ) Representative single channel recording from an excised patch containing purified LRRC8A reconstituted into phosphatidyl choline lipids (P o =u00a00.3, u03b3u00a0=u00a024 pS atu00a0+100 mV; P o ...
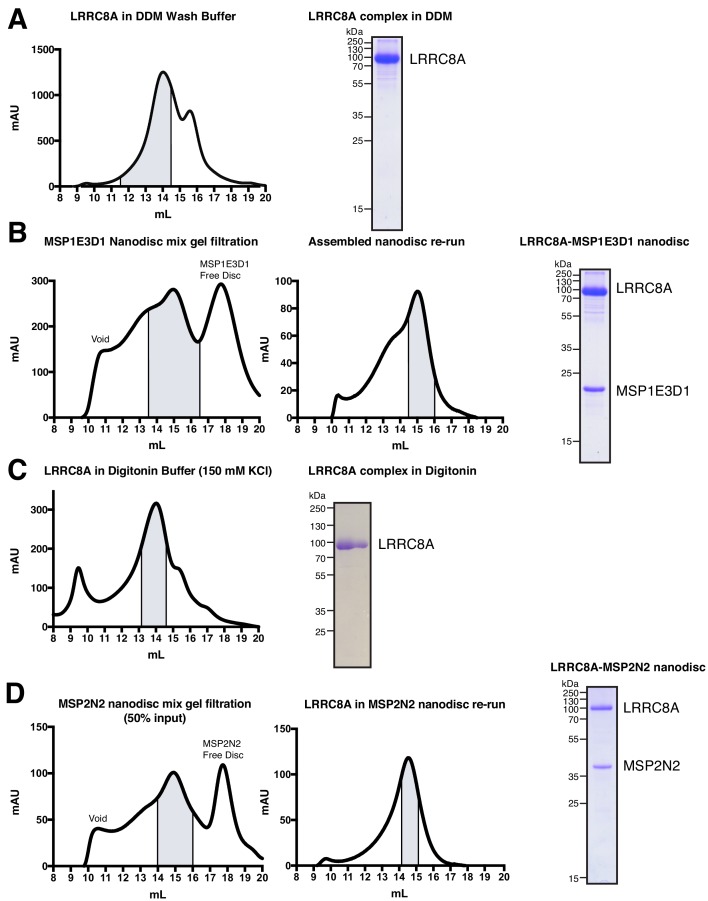
Figure 1u2014figure supplement 1.
Complex purification and reconstitution.
( A ) Superose six gel filtration of LRRC8A in DDM-containing wash buffer. Peak fractions corresponding to LRRC8A complex are highlighted. On the right, coomassie gel of purified LRRC8A protein in DDM...
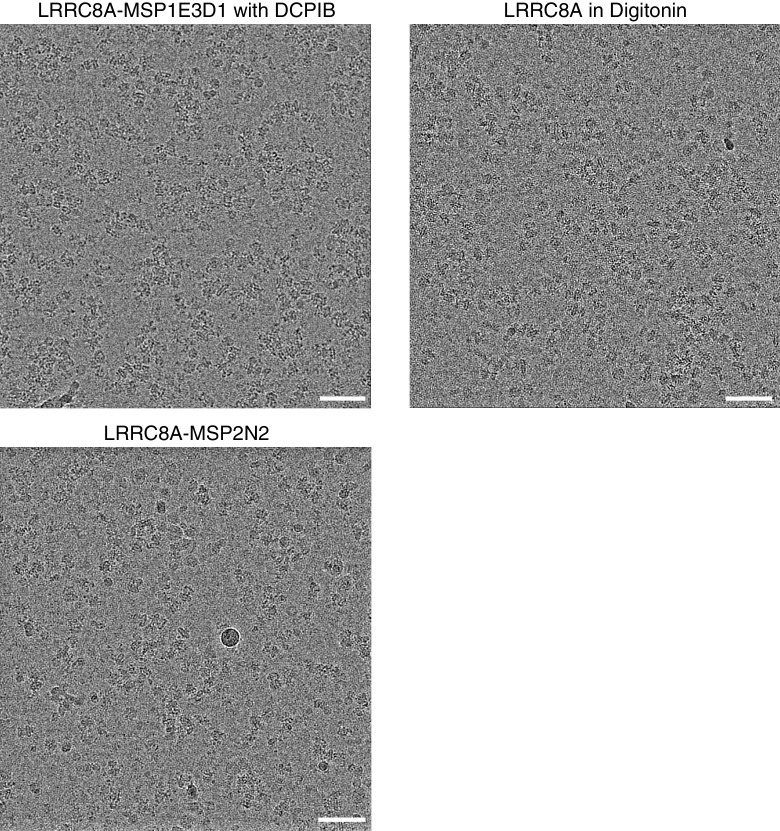
Figure 1u2014figure supplement 2.
Representative micrographs from LRRC8A preparations in MSP1E3D1 nanodiscs with DCPIB, digitonin, and MSP2N2 nanodiscs.
Scale bars, 500 u00c5.
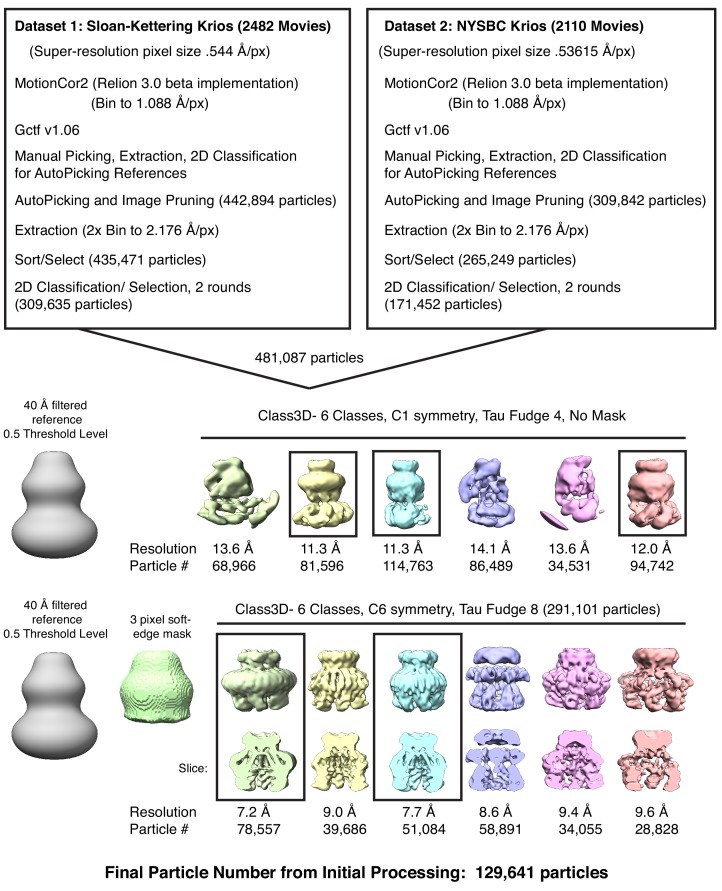
Figure 1u2014figure supplement 3.
Initial processing for LRRC8A-DCPIB in MSP1E3D1 nanodisc datasets.
Particles from boxed classes were passed to the next round.
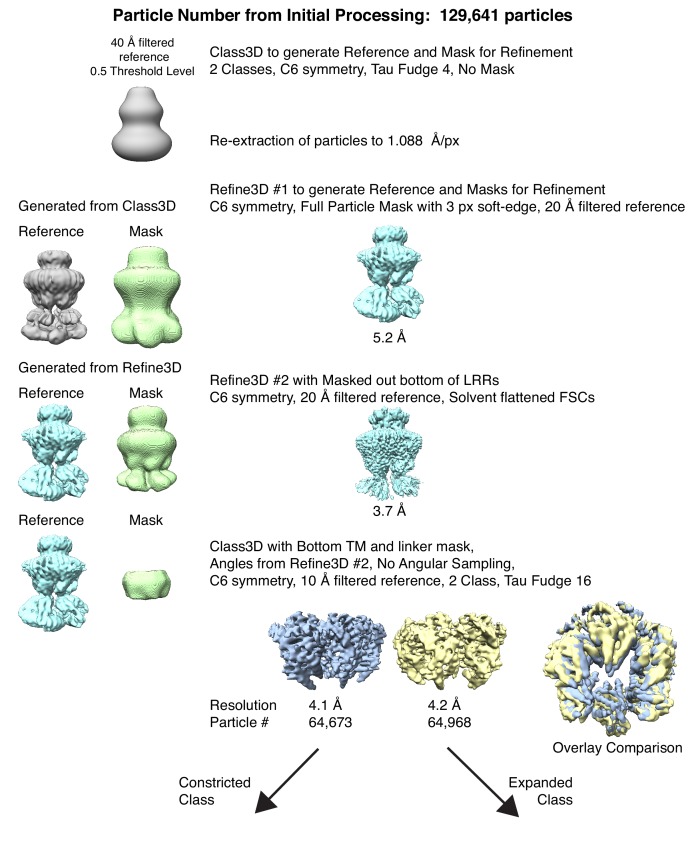
Figure 1u2014figure supplement 4.
The refinement and classification performed to separate constricted and expanded particles for LRRC8A-DCPIB in MSP1E3D1.
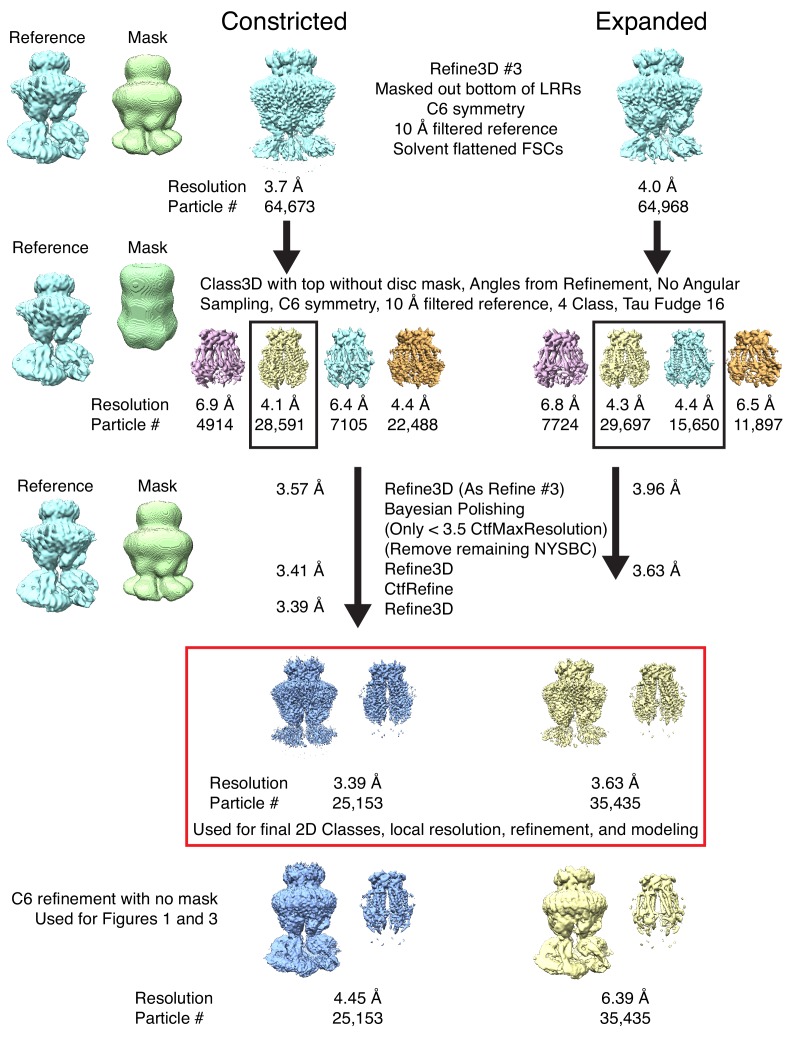
Figure 1u2014figure supplement 5.
The final classification and refinement performed on constricted and expanded particles to obtain high-resolution maps for LRRC8A-DCPIB in MSP1E3D1.
Particles from boxed classes were passed to the next round. The masked refinements used for generating final maps and modeling are boxed in red. Below are the unmasked refinements used in Figures 1 an...
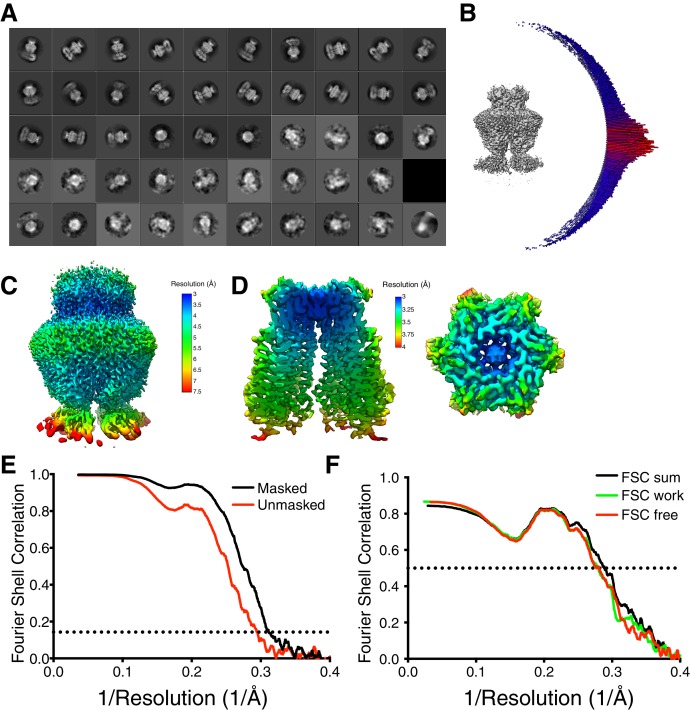
Figure 1u2014figure supplement 6.
Constricted map and model validation for LRRC8A-DCPIB in MSP1E3D1.
( A ) Two-dimensional classes from a fifty-class classification of the final particles. ( B ) Angular distribution of particle views. ( C ) Local resolution using Relion locally filtered map at 0.012 ...
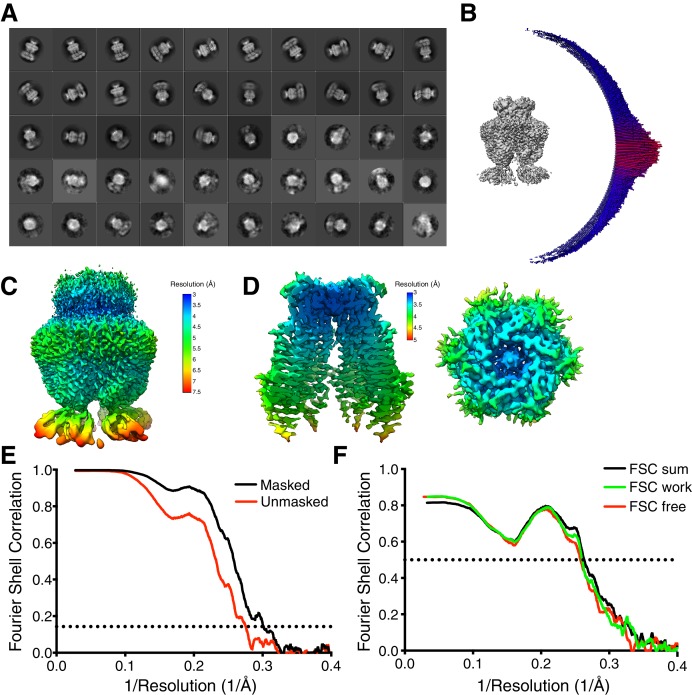
Figure 1u2014figure supplement 7.
Expanded map and model validation for LRRC8A-DCPIB in MSP1E3D1.
( A ) Two-dimensional classes from a fifty-class classification of the final particles. ( B ) Angular distribution of particle views. ( C ) Local resolution using Relion locally filtered map at 0.012 ...
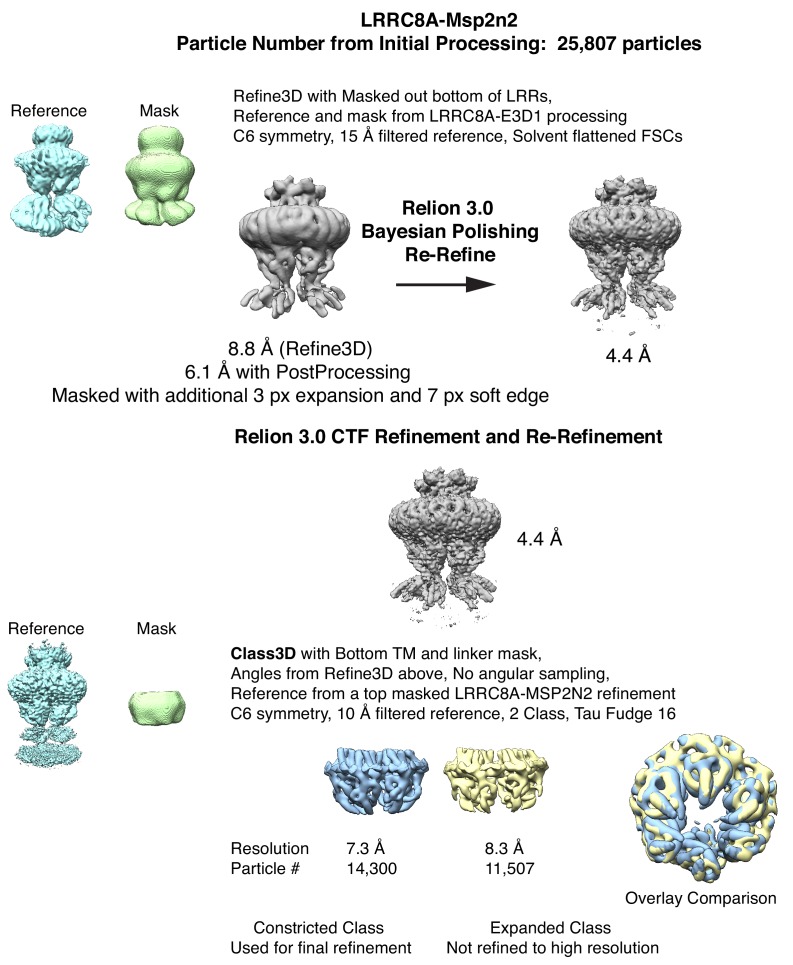
Figure 1u2014figure supplement 8.
LRRC8A in MSP2N2 refinement, particle polishing, and classing into constricted and expanded linker particles.
Notably, Relion 3.0 Bayesian Polishing was crucial to obtain a high-resolution reconstruction for this dataset. The constricted particle set was refined for a final map. However, the expanded particle...
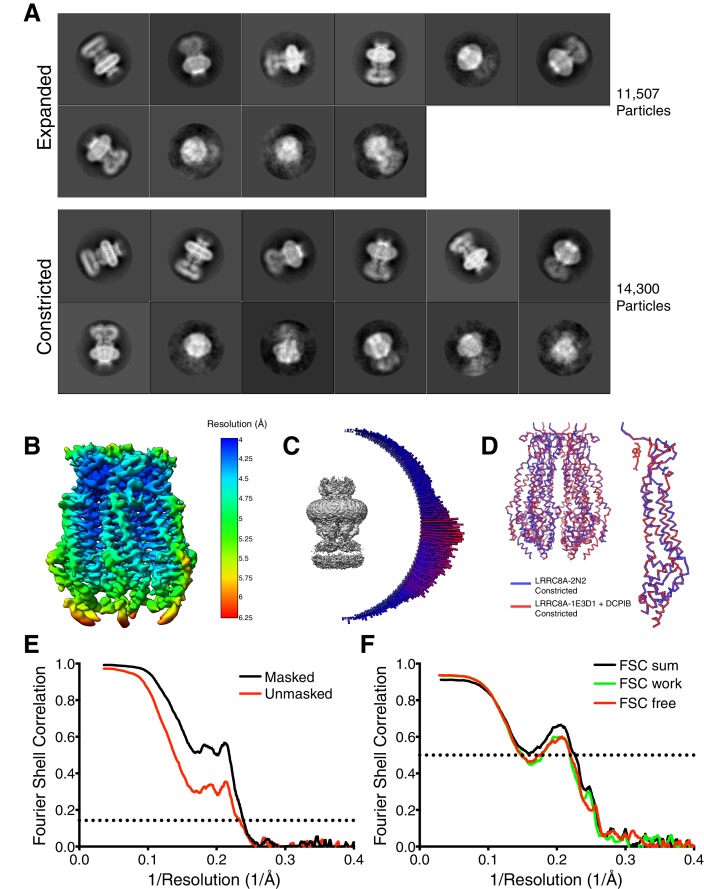
Figure 1u2014figure supplement 9.
Final particle set 2D classes and the model validation for constricted map of LRRC8 in MSP2N2.
( A ) 2D classes from a 12-class job for the expanded (top) and constricted (bottom) particles. For the expanded set, two sparsely populated classes were removed for this visualization. ( B ) Local re...
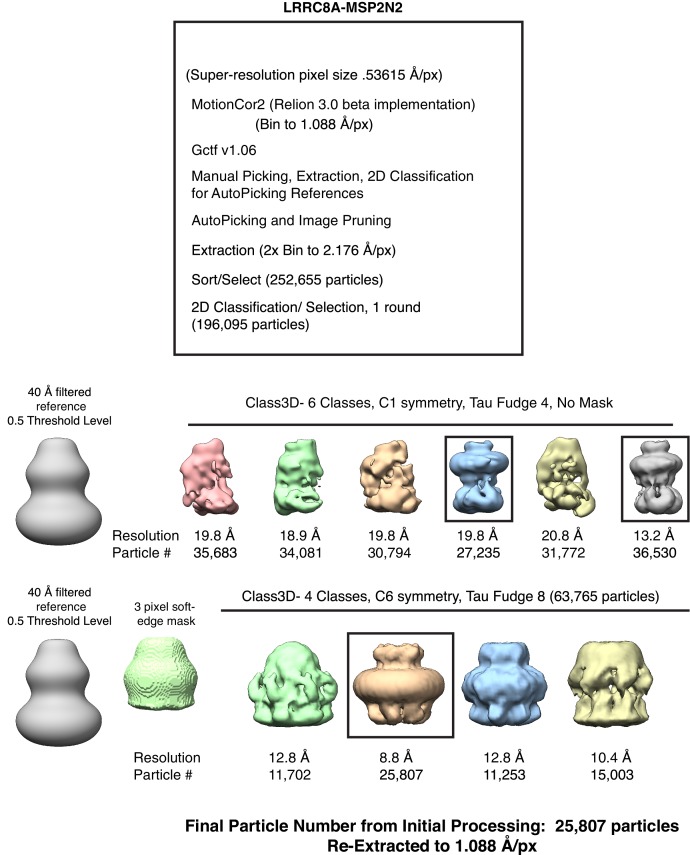
Figure 1u2014figure supplement 10.
Initial processing for the LRRC8A in MSP2N2 nanodisc dataset.
Particles from boxed classes were passed to the next round.
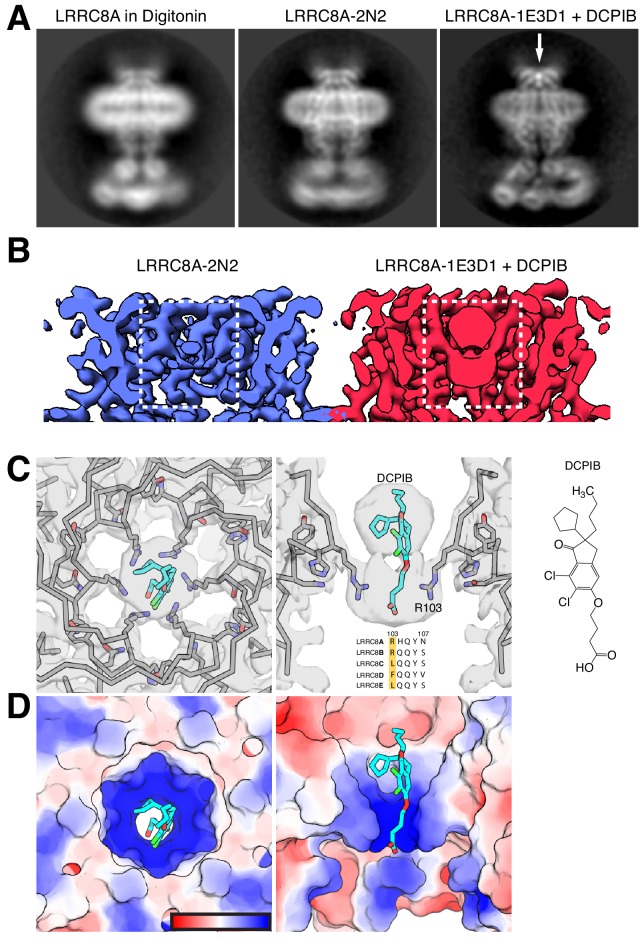
Figure 2.
DCPIB inhibitor binding site.
( A ) Representative side-view two-dimensional class averages of LRRC8A (left) solubilized in digitonin, (middle) reconstituted in MSP2N2 lipid nanodiscs, or (right) MSP1E3D1 lipid nanodiscs and compl...
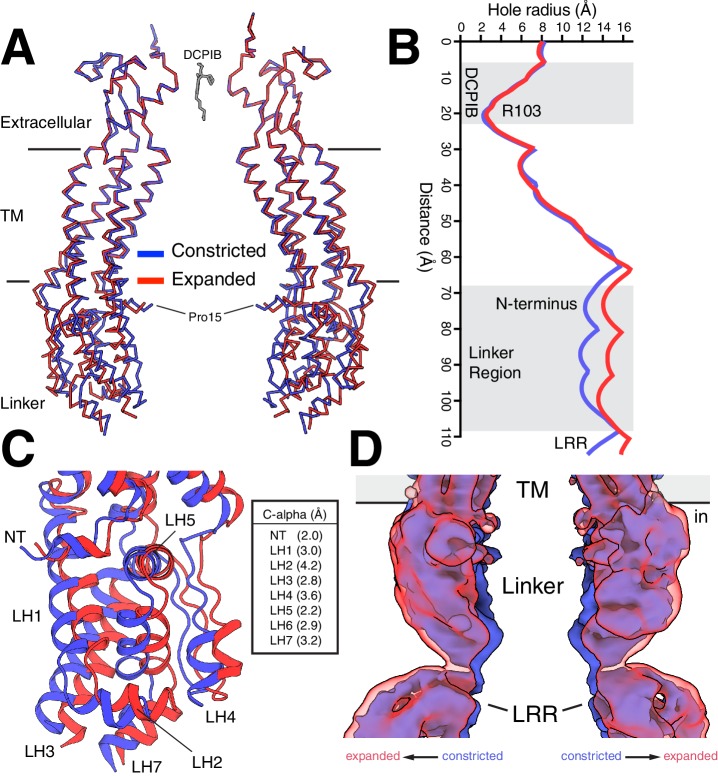
Figure 3.
Constricted and expanded LRRC8A structures.
( A ) Overlay of constricted (blue) and expanded (red) structures of LRRC8A viewed from the membrane with two opposing subunits shown for each structure in ribbon representation.u00a0DCPIB is shown in...
Video 1.
Motion of two opposing chains (as in Figure 3A ) as a cartoon-representation morph between constricted and expanded states.
Measurement in u00c5 between the C-alpha of Pro15 is included.
Video 2.
Linker region (as in Figure 3C ) motion as a cartoon-representation morph between constricted and expanded states.
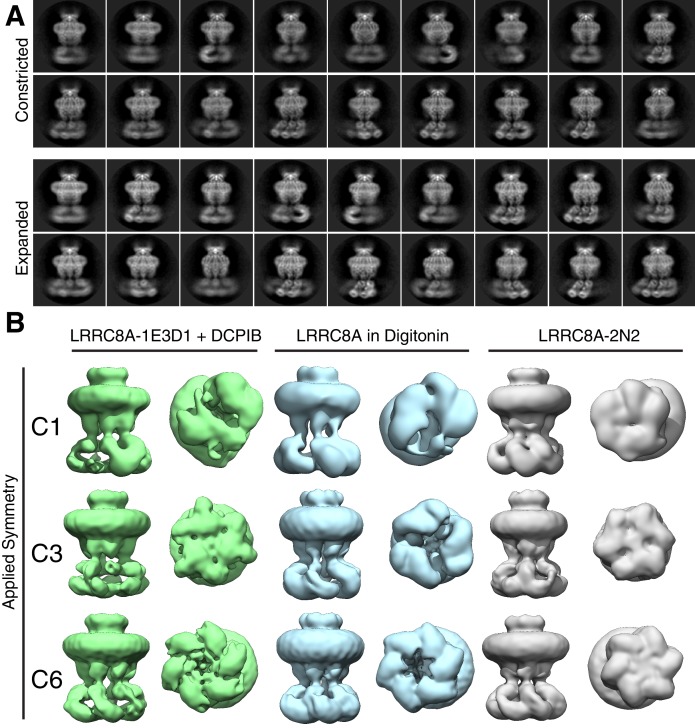
Figure 4.
LRR position and channel symmetry differences in lipid and detergent environments.
( A ) Side-views of two-dimensional class averages from the (top) constricted and (bottom) expanded particle classes illustrating variation in LRR position.u00a0Also see Videos 3 and 4 . ( B ) Symmetr...
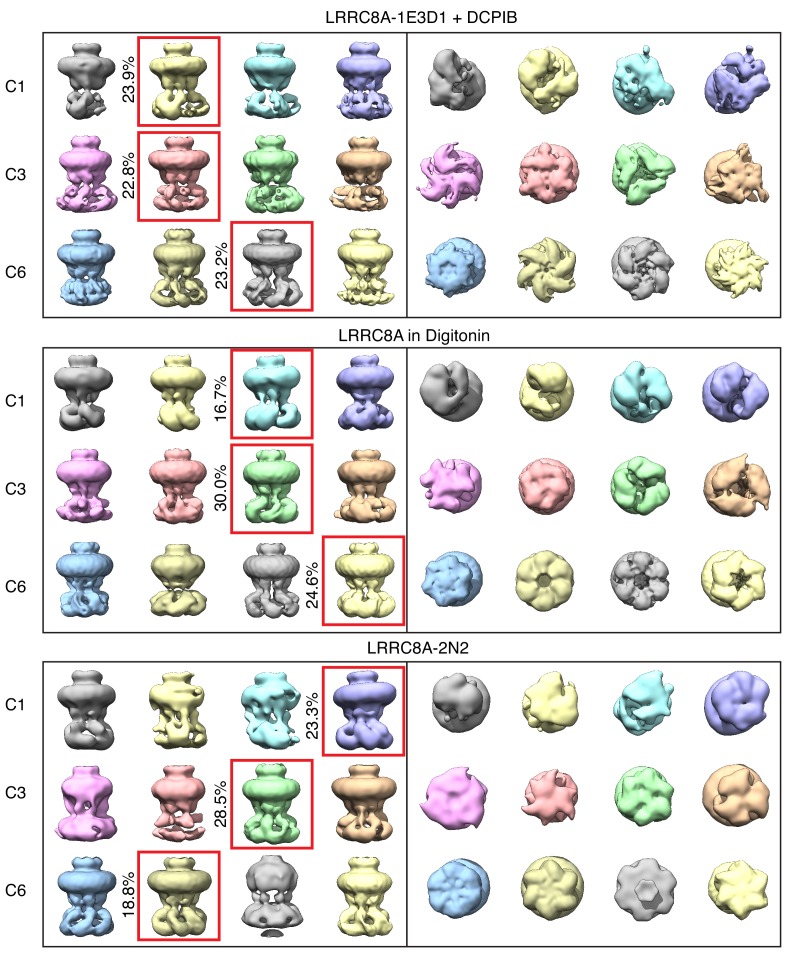
Figure 4u2014figure supplement 1.
Full three-dimensional classification output for symmetry testing.
All maps are shown at 0.015 threshold. Classes selected for display in Figure 4 are boxed in red with the percentage of particles contributing to the class on the left.
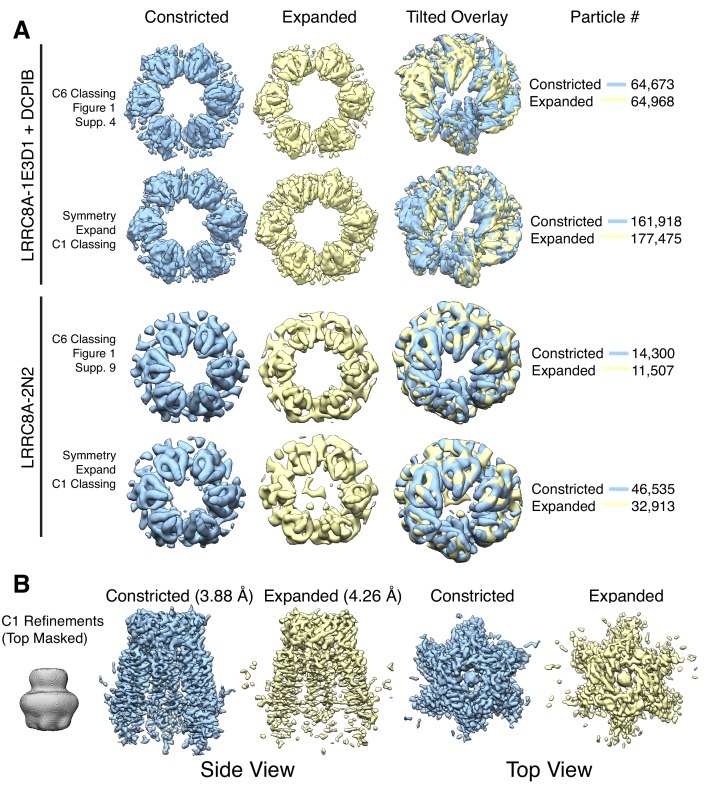
Figure 4u2014figure supplement 2.
Classification of constricted and expanded states.
( A ) To test if asymmetric linker states were present in the data we performed symmetry expansion followed by classing with C1 symmetry for both the LRRC8A-DCPIB in MSP1E3D1 and LRRC8A in MSP2N2 data...
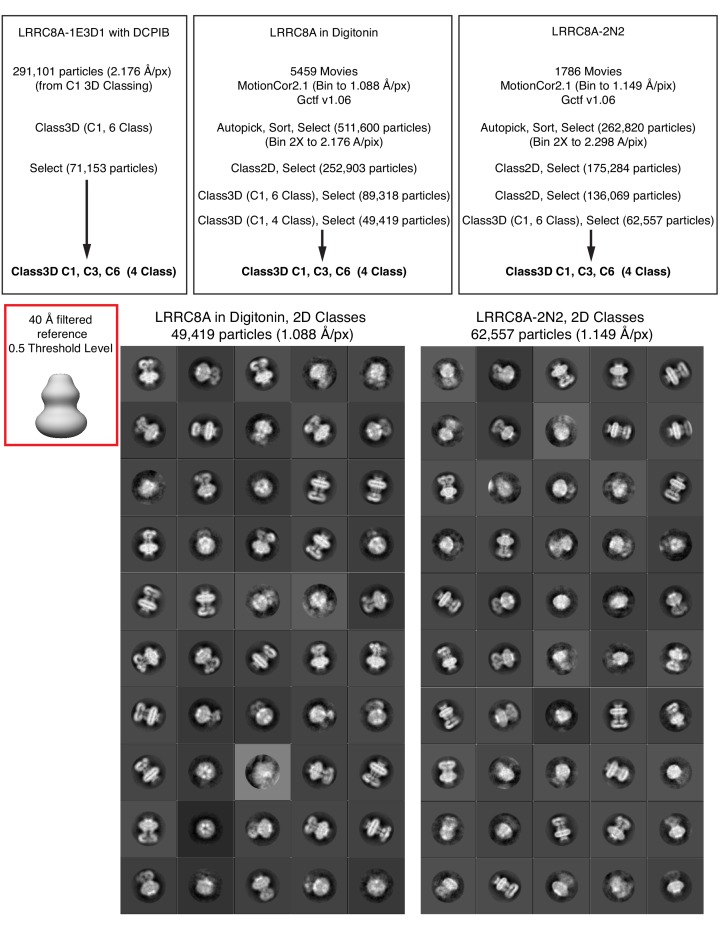
Figure 4u2014figure supplement 3.
Initial processing for symmetry testing.
(Top) The reference used for the three-dimensional classification is shown boxed in red. No masking was utilized during classification. (Bottom) Two-dimensional class averages from a fifty-class job f...
Video 3.
Constricted state side-views of LRRC8A-DCPIB in MSP1E3D1 nanodiscs illustrating heterogenous LRR positions.
Video 4.
Expanded state side-views of LRRC8A-DCPIB in MSP1E3D1 nanodiscs illustrating heterogenous LRR positions.
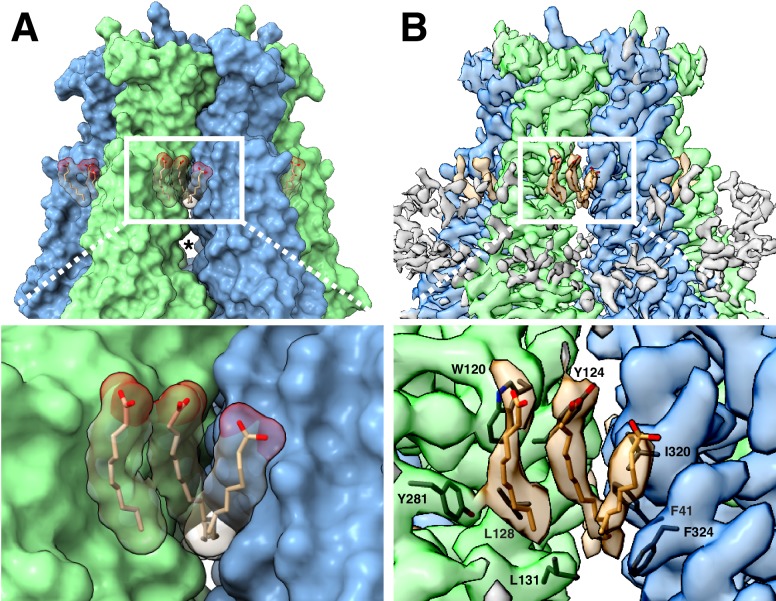
Figure 5.
LRRC8A-lipid interactions.
( A , above) Surface representation of the constricted LRRC8A class viewed from the membrane with docked POPC lipid chains depicted in stick (tan) and space-filling (transparent) representations.u00a0...
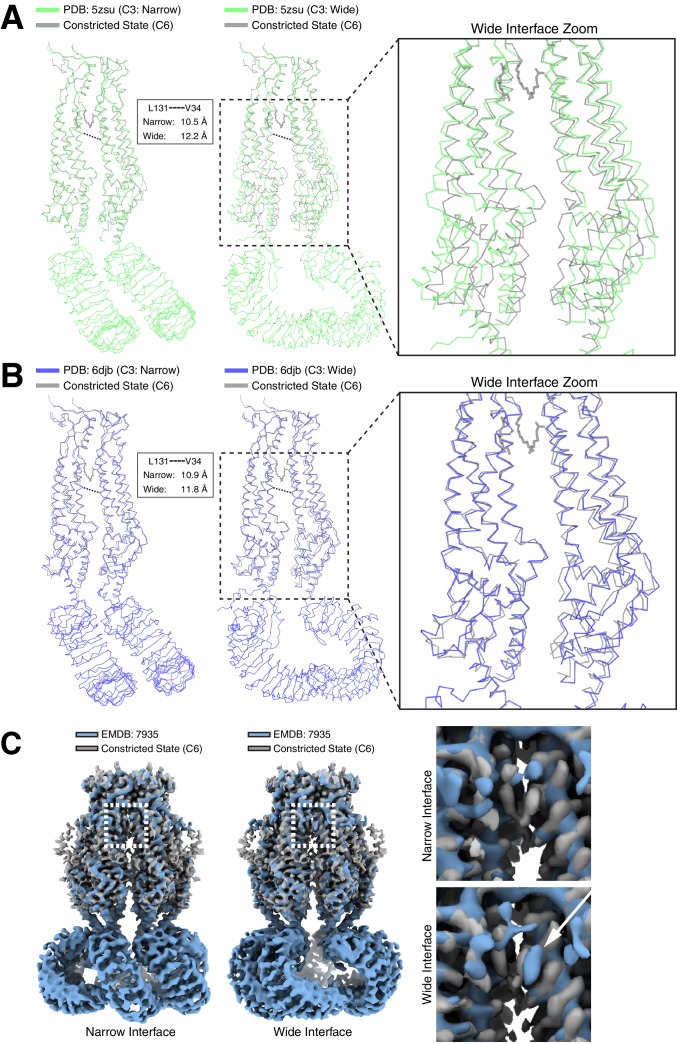
Figure 6.
Differences in LRRC8A structures solved in lipid bilayers and detergent micelles.
Overlays of extracellular domain-aligned models of the constricted state structure determined in lipid nanodiscs (gray) and the (left) narrow and (middle) wide subunit interfaces from structures deter...
Video 5.
Overlay of the constricted state and narrow and wide interfaces of PDB: 6djb.
Video 6.
Overlay of the constricted state and narrow and wide interfaces of PDB: 5zsu.
Figure images are served from the NIH/NLM PubMed Central Open Access Subset or Europe PMC; copyright remains with the publishers and authors.
💬 Discussion
0 commentsNo comments yet. Be the first to start a discussion!
Leave a Comment