Abstract
Abstract The SARS-CoV-2 protein Nsp2 has been implicated in a wide range of viral processes, but its exact functions, and the structural basis of those functions, remain unknown. Here, we report an atomic model for full-length Nsp2 obtained by combining cryo-electron microscopy with deep learning-based structure prediction from AlphaFold2. The resulting structure reveals a highly-conserved zinc ion-binding site, suggesting a role for Nsp2 in RNA binding. Mapping emerging mutations from variants of SARS-CoV-2 on the resulting structure shows potential host-Nsp2 interaction regions. Using structural analysis together with affinity tagged purification mass spectrometry experiments, we identify Nsp2 mutants that are unable to interact with the actin-nucleation-promoting WASH protein complex or with GIGYF2, an inhibitor of translation initiation and modulator of ribosome-associated quality control. Our work suggests a potential role of Nsp2 in linking viral transcription within the viral replication-transcription complexes (RTC) to the translation initiation of the viral message. Collectively, the structure reported here, combined with mutant interaction mapping, provides a foundation for functional studies of this evolutionary conserved coronavirus protein and may assist future drug design.
🔬 Techniques
🧬 Organisms
✨ Fluorophores
🧪 Sample Preparation
🔬 Cell Lines
🏭 Microscope Brands
🧪 Reagent Suppliers
📷 Detectors
💻 Software Details
💻 Code & Software
💾 Data Repositories
🏛️ Research Organizations (ROR)
Affiliated research institutions:
📋 Methods
Nsp2 Expression SARS-CoV-2 Nsp2, codon optimized for Escherichia coli expression, was cloned in a pET-29b(+) vector backbone with N-terminus 10XHis-tag and SUMO-tag (Ep156). For expression, the plasmid Ep156 was transformed in the LOBSTR E. coli strain and a single colony was inoculated in LB media with 50 μg/ml kanamycin overnight at 37°C. 1% overnight culture was inoculated in 1 L TB media with 50 μg/ml kanamycin and and grown at 37°C till O.D. 600nm reached 0.8. The culture was transferred to 20°C and induced with 0.5 mM IPTG for 16 h. The cells were harvested and washed with PBS, flash-frozen and stored at −80°C.
Nsp2 Purification
To a 6 L equivalent of cell pellet, 150 mL of lysis buffer (50 mM HEPES pH 7.5, 300 mM NaCl, 10% glycerol, 2 mM MgCl 2 ) supplemented with 2 protease inhibitor tablets (Roche), 1 mM PMSF, and 30 μL benzonase nuclease (Millipore Sigma) was added. Cells were resuspended and dounce homogenized before either sonication (3 × 10 min cycles using a sonifier (Branson), at 50% duty cycle (1 sec on, 1 sec off), followed by ≥5 mins on ice, or high pressure homogenizer (3 times passage through the EmulsiFlex-C3 [Avestin] at ~15,000 psi, 4°C). After centrifugation for 40 mins at 25,000xg, 4°C, clarified samples were transferred to a 50 mL conical tube and supplemented with a final 20 mM imidazole pH 7.5 before batch-binding with Ni-NTA superflow resin (Qiagen) for ~1 hr at 4°C. The resins were collected in a gravity flow column, washed with 15 CV lysis buffer, followed by 2× 7.5 CV sulfate wash buffer (25 mM Tris pH 8.5, 300 mM NaCl, 10% glycerol, 100 mM Na 2 SO 4 ), 2× 7.5 CV wash buffer (25 mM Tris pH 8.5, 300 mM NaCl, 10% glycerol, 30 mM imidazole), 2× 7.5 CV wash buffer supplemented with 2 mM ATP, 4 mM MgCl 2 , and eluted in 2× 2.5 CV elution buffer (25 mM Tris pH 8.0, 300 mM NaCl, 10% glycerol, 300 mM imidazole, 2 mM MgCl 2 ). The elution was treated with benzonase and Ulp1 protease and dialyzed overnight at 4°C in dialysis buffer (25 mM Tris pH 8.5, 75 mM NaCl, 10% glycerol, 0.5 mM TCEP, 2 mM MgCl 2 ). The tagless Nsp2 was further purified using a 5 mL HiTrap Heparin HP column (Cytiva) using a linear gradient of 7.5% Heparin buffer A (30 mM Tris pH 8, 1 mM DTT) to 50% Heparin buffer B (30 mM Tris pH 8, 1 M NaCl, 1 mM DTT). Peak fractions corresponding to Nsp2 were concentrated and further purified using a Superdex 200 increase 10/300 GL column (Cytiva) in SEC buffer (20 mM Tris pH 8.0, 250 mM NaCl, 0.5 mM TCEP) to yield a single peak. The peak fractions were pooled and concentrated and used for CryoEM. For the Zn containing sample, 10 μM ZnCl 2 was kept in all the buffers of the purification protocol mentioned above.
Show full methods section
Nsp2 Expression SARS-CoV-2 Nsp2, codon optimized for Escherichia coli expression, was cloned in a pET-29b(+) vector backbone with N-terminus 10XHis-tag and SUMO-tag (Ep156). For expression, the plasmid Ep156 was transformed in the LOBSTR E. coli strain and a single colony was inoculated in LB media with 50 μg/ml kanamycin overnight at 37°C. 1% overnight culture was inoculated in 1 L TB media with 50 μg/ml kanamycin and and grown at 37°C till O.D. 600nm reached 0.8. The culture was transferred to 20°C and induced with 0.5 mM IPTG for 16 h. The cells were harvested and washed with PBS, flash-frozen and stored at −80°C.
Nsp2 Purification
To a 6 L equivalent of cell pellet, 150 mL of lysis buffer (50 mM HEPES pH 7.5, 300 mM NaCl, 10% glycerol, 2 mM MgCl 2 ) supplemented with 2 protease inhibitor tablets (Roche), 1 mM PMSF, and 30 μL benzonase nuclease (Millipore Sigma) was added. Cells were resuspended and dounce homogenized before either sonication (3 × 10 min cycles using a sonifier (Branson), at 50% duty cycle (1 sec on, 1 sec off), followed by ≥5 mins on ice, or high pressure homogenizer (3 times passage through the EmulsiFlex-C3 [Avestin] at ~15,000 psi, 4°C). After centrifugation for 40 mins at 25,000xg, 4°C, clarified samples were transferred to a 50 mL conical tube and supplemented with a final 20 mM imidazole pH 7.5 before batch-binding with Ni-NTA superflow resin (Qiagen) for ~1 hr at 4°C. The resins were collected in a gravity flow column, washed with 15 CV lysis buffer, followed by 2× 7.5 CV sulfate wash buffer (25 mM Tris pH 8.5, 300 mM NaCl, 10% glycerol, 100 mM Na 2 SO 4 ), 2× 7.5 CV wash buffer (25 mM Tris pH 8.5, 300 mM NaCl, 10% glycerol, 30 mM imidazole), 2× 7.5 CV wash buffer supplemented with 2 mM ATP, 4 mM MgCl 2 , and eluted in 2× 2.5 CV elution buffer (25 mM Tris pH 8.0, 300 mM NaCl, 10% glycerol, 300 mM imidazole, 2 mM MgCl 2 ). The elution was treated with benzonase and Ulp1 protease and dialyzed overnight at 4°C in dialysis buffer (25 mM Tris pH 8.5, 75 mM NaCl, 10% glycerol, 0.5 mM TCEP, 2 mM MgCl 2 ). The tagless Nsp2 was further purified using a 5 mL HiTrap Heparin HP column (Cytiva) using a linear gradient of 7.5% Heparin buffer A (30 mM Tris pH 8, 1 mM DTT) to 50% Heparin buffer B (30 mM Tris pH 8, 1 M NaCl, 1 mM DTT). Peak fractions corresponding to Nsp2 were concentrated and further purified using a Superdex 200 increase 10/300 GL column (Cytiva) in SEC buffer (20 mM Tris pH 8.0, 250 mM NaCl, 0.5 mM TCEP) to yield a single peak. The peak fractions were pooled and concentrated and used for CryoEM. For the Zn containing sample, 10 μM ZnCl 2 was kept in all the buffers of the purification protocol mentioned above.
CryoEM grid freezing and data collection
Purified nsp2 was diluted to 6 μM for the apo sample and 5.7 μM for the Zn containing sample. 400 mesh 1.2/1.3R Au Quantifoil grids were glow discharged at 15 mA for 30 seconds. Vitrification was done using FEI Vitrobot Mark IV (ThermoFisher) set up at 4°C and 100% humidity. 3.5 μl sample was applied to the grids and the blotting was performed with a blot force of 0 for 4–6 s prior to plunge freezing into liquid ethane. For the apo sample, two datasets comprising of 804 and 1116 118-frame super-resolution movies each were collected with a 3×3 image shift at a magnification of 105,000x with physical pixel size of 0.834 Å/pix on a Titan Krios (ThermoFisher) equipped with a K3 camera and a Bioquantum energy filter (Gatan) set to a slit width of 20 eV. Collection dose rate was 8 e − /pixel/second for a total dose of 66 e − /Å 2 . Defocus range was 0.8 to 2.4 μm. Each collection was performed with semi-automated scripts in SerialEM. Nsp2 with Zn grids were prepared using a similar protocol. 1149 118-frame movies were collected for this sample at a 105,000x magnification with physical pixel size of 0.834 Å/pix on Titan Krios similar to without Zn sample. Collection dose rate was 8 e − /pixel/second for a total dose of 67 e − /Å 2 . Data Processing Without Zn: Initial processing was done in Cryosparc (v2.15.0) 17 18 . The first dataset with 801 dose-weighted motion corrected micrographs 44 was imported and Patch CTF(M) was performed. This dataset required thorough manual curation and led to selection of 388 micrographs for further processing. Blob-picker was used to pick 363145 particles and extraction was done with a box size of 288 px. 2D-classification was done into 150 classes and good looking classes were selected with total 91181 particles. A second dataset with 1116 dose-weighted micrographs was processed in a similar manner. After Patch CTF(M), 748 micrographs were curated based on CTF-fit resolution ( 0.5 or < 0.5 were separated into Fig 5A – C and Sup Fig 5A , respectively). For those interacting with wild-type, a quantitative statistical analysis was performed (this quantitation was not possible for those not interacting with wild-type Nsp2 due to the lack of detection). Specifically, prey intensities in each affinity purification were normalized to the corresponding bait abundance using MSstats 59 (globalStandards norm). Log 2 fold changes and BH-adjusted p-values were calculated by comparing each mutant to the wild-type from this study.
Scheduled parallel reaction monitoring
(PRM) analysis of Nsp2 interactors. Peptides for targeted MS were selected after importing the msms.txt file derived from the previously described MaxQuant search into Skyline (v20.2.0.343) 60 . Proteotypic peptides passing an Andromeda score of 0.95 were selected and manually inspected to choose precursors suitable for targeted proteomics. In total 4 peptides per protein were selected for targeted analysis. For WASHC4 and EIF4E2 all peptides identified by DDA were used (3 and 2 respectively). The samples from AP-MS were acquired in Partial Reaction Monitoring mode (PRM) 61 on a Q-Exactive Orbitrap (Thermo Fisher) connected to a nanoLC easy 1200 (Thermo Fisher). Peptides for the scheduled analysis were separated in 75 minutes using the same chromatographic gradient and source parameter to the DDA samples. Precursor ion scans were recorded in the Orbitrap at 70’000 resolution (at 400 m/z) for 100 ms or until the ion population reached an AGC value of 1e 6 . Peptides in the inclusion list were fragmented using HCD with a normalized collisional energy of 27, an isolation window of 2 Da and a scheduled retention time window of 7 minutes. Fragments were acquired in the Orbitrap at 17’500 resolution (at 400 m/z) for 100 ms or until reaching an AGC of 2e 5 . Loop count was set to 20. For data analysis, the PRM data was searched with MaxQuant using a FASTA file containing only the target proteins and default settings. The msms.txt was imported into Skyline using the ‘import peptide search’ option and setting the search type to targeted. To import the files, the following transition settings were used: The MS1 filter was disabled, ion types were set to y and b and MS/MS settings were set to Orbitrap as mass analyzer, type as targeted and resolution of 17500 (at 400 m/z). Peptides with poor coeluting fragments (dotp lower than 0.9) were removed. WASHC4 peptides did not pass this quality control criterion and thus WASHC4 was not considered for further analysis. After import, peak boundaries were manually corrected and noisy transitions were removed. The resulting data was exported at the transition level and transitions missing in more than half of the samples were removed to ensure robust quantitation. The resulting transitions were summed up per peptide and then the experiment was mean centered using the average peptide level for the bait protein (using SARS-Cov-2 Nsp2 quantity for SARS-CoV-2 mutants). Normalized peptide-level abundances were averaged to reach protein level and log 2 transformed. The fold change and BH-adjusted p-values for condition were calculated against the wild-type Nsp2.
Supplementary Material Supplement 1 Supplement 2
📊 Figures
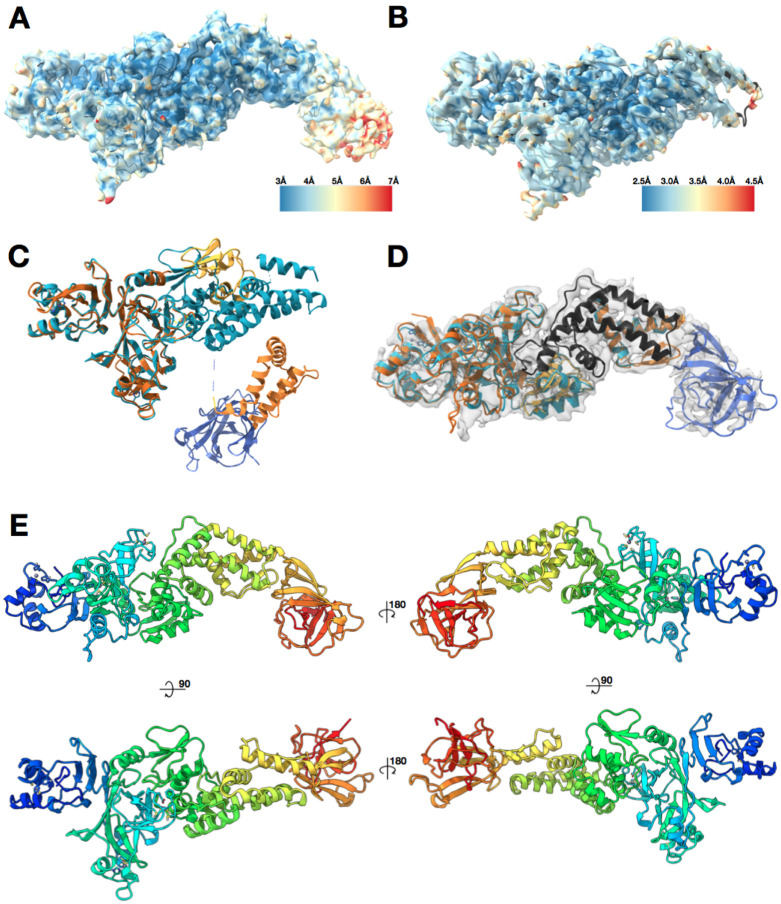
Figure 1.
Nsp2 cryo-EM density and model overview.
(A) 3.8 u00c5 cryo-EM map of Nsp2 colored by local resolution showing the extra density at the C-terminus (B) 3.2 u00c5 cryo-EM map of Nsp2 colored by local resolution with the resulting model in ribb...
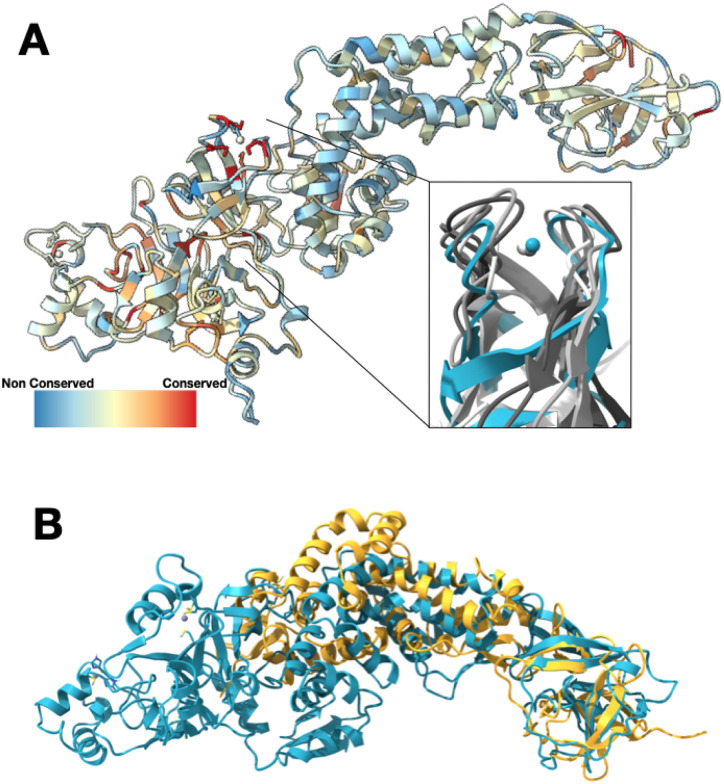
Figure 2.
Nsp2 has a conserved zinc binding motif but otherwise shows low conservation.
(A) Nsp2 structure depicted as ribbon and colored by conservation (see methods for details). The four cysteines show the highest conservation and are indicated in red. The magnified insert shows the z...
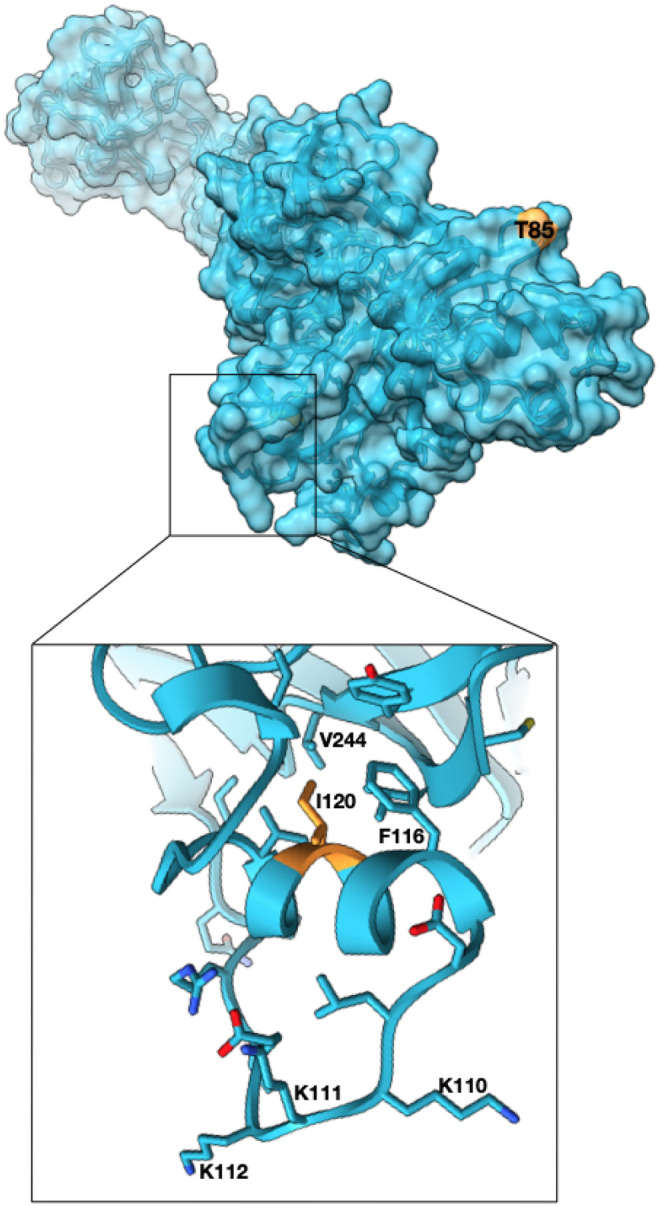
Figure 3.
High frequency mutations in Nsp2 may provide host specific advantages.
T85I mutation which is present in 13% of all the SARS-CoV-2 sequences is at the surface and may mediate host specific protein-protein interactions (Nsp2 surface in cyan, T85 in orange). Another mutate...
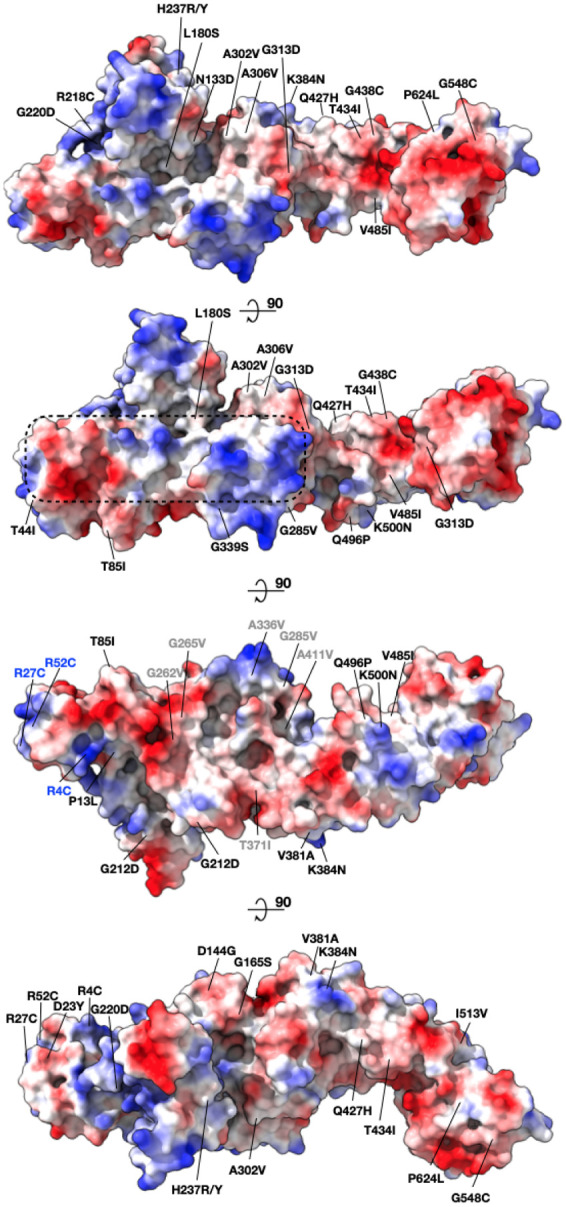
Figure 4.
Mapping surface mutations in SARS-CoV-2 Nsp2 shows both potentially constrained surfaces and rapidly changing regions.
All the positively selected mutations on Nsp2 mapped to the protein surface are colored by the surface charge. The region that is less susceptible to mutations is inscribed in a dashed rectangle. Resi...
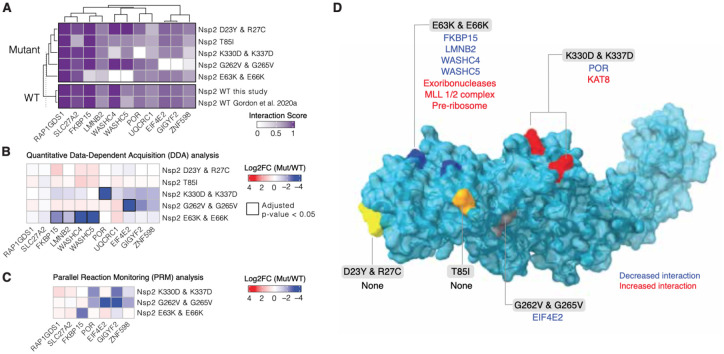
Figure 5.
Nsp2 possesses multiple interaction surfaces for host proteins.
(A) Interaction scores (average between MiST and Saint Scores) for human proteins (u201cpreysu201d) deemed high-confidence interactions in at least one affinity purification (u201cbaitu201d) mass spec...
Figure images are served from the NIH/NLM PubMed Central Open Access Subset or Europe PMC; copyright remains with the publishers and authors.
💬 Discussion
0 commentsNo comments yet. Be the first to start a discussion!
Leave a Comment