Abstract
Superresolution fluorescence microscopy and cryogenic electron tomography (CET) are powerful imaging methods for exploring the subcellular organization of biomolecules. Superresolution fluorescence microscopy based on covalent labeling highlights specific proteins and has sufficient sensitivity to observe single fluorescent molecules, but the reconstructions lack detailed cellular context. CET has molecular-scale resolution but lacks specific and nonperturbative intracellular labeling techniques. Here, we describe an imaging scheme that correlates cryogenic single-molecule fluorescence localizations with CET reconstructions. Our approach achieves single-molecule localizations with an average lateral precision of 9 nm, and a relative registration error between the set of localizations and CET reconstruction of ∼30 nm. We illustrate the workflow by annotating the positions of three proteins in the bacterium Caulobacter crescentus : McpA, PopZ, and SpmX. McpA, which forms a part of the chemoreceptor array, acts as a validation structure by being visible under both imaging modalities. In contrast, PopZ and SpmX cannot be directly identified in CET. While not directly discernable, PopZ fills a region at the cell poles that is devoid of electron-dense ribosomes. We annotate the position of PopZ with single-molecule localizations and confirm its position within the ribosome excluded region. We further use the locations of PopZ to provide context for localizations of SpmX, a low-copy integral membrane protein sequestered by PopZ as part of a signaling pathway that leads to an asymmetric cell division. Our correlative approach reveals that SpmX localizes along one side of the cell pole and its extent closely matches that of the PopZ region.
🔬 Techniques
🔭 Microscopes
🧬 Organisms
💻 Software
✨ Fluorophores
🧪 Sample Preparation
🔬 Cell Lines
🏭 Microscope Brands
🧪 Reagent Suppliers
🔴 Lasers
📷 Detectors
🔎 Objectives
🎨 Filters
💻 Software Details
💾 Data Repositories
🏛️ Research Organizations (ROR)
Affiliated research institutions:
📋 Methods
Generation of C. crescentus PAmKate Fusion Strains. McpA–PAmKate. To construct C-terminal PAmKate fusions in a single step under a native locus, we used the vector pYFPC-2 (or under the xylose locus, pXyl-YFPC-2) backbones. The YFP gene was cut out using EcoRI and NheI enzymes, and the resulting backbone was purified by separation on an agarose gel. The PAmKate gene was amplified from Addgene plasmid #32691 ( 39 ) and inserted into the above backbones using Gibson assembly, resulting in the pPAmKateC-2 and pXylPAmKateC-2 vectors. The McpA coding region was amplified with appropriate overhangs from genomic DNA from NA1000 cells and gel purified. The pXPAmKateC-2 vector was linearized by digesting with NdeI, and the McpA gene was inserted using Gibson assembly. The linker used for the McpA fusion was GTLSRPENSNVHRS. PAmKate–PopZ. To construct an N-terminal fusion construct, PAmKate and PopZ genes were PCR amplified with a –GGGSGGGS– linker and cloned into pXyl-YFPC-2 that was digested by NdeI/NheI using Gibson Assembly ( 40 , 41 ). The ligation was transformed into Escherichia coli DH5α cells and selected on LB-kan plates. Sequence-verified plasmid was then transformed into NA1000 cells via electroporation. SpmX–PAmKate. In order to produce the plasmid for the SpmX–PAmKate C-terminal fusion on the native promoter, the region encoding SpmX and the 500 base pairs upstream were amplified from genomic DNA from NA1000 cells and gel purified. This gene was then inserted at the EcoRI site on the linearized pPAmKateC-2 backbone. The linker used for the SpmX fusion was PAGALINMHGTLRSRAPENSNVTRHRSAT. Room Temperature Superresolution Imaging. C. crescentus cells were induced with 0.3% xylose for 3 h (McpA–PAmKate, PAmKate–PopZ) or cultured with endogenous expression (SpmX–PAmKate) and placed on agarose pads. These molecules either form relatively fixed structures or do not move dramatically during live cell imaging; highly mobile molecules are rejected as bad fits. Imaging was performed with a custom epifluorescence microscope. Fluorescence emission under 680 W/cm 2 of 561 nm excitation (Coherent Sapphire) was collected using an oil immersion, supercorrected objective (Olympus PLANON60xOSC, 60×/N.A. 1.4) mounted in a Nikon Diaphot 200 microscope and imaged onto an EMCCD camera (Andor iXon) at 20 Hz. Occasional pulses (150 nm; intensity, 18 nm;
Show full methods section
Generation of C. crescentus PAmKate Fusion Strains. McpA–PAmKate. To construct C-terminal PAmKate fusions in a single step under a native locus, we used the vector pYFPC-2 (or under the xylose locus, pXyl-YFPC-2) backbones. The YFP gene was cut out using EcoRI and NheI enzymes, and the resulting backbone was purified by separation on an agarose gel. The PAmKate gene was amplified from Addgene plasmid #32691 ( 39 ) and inserted into the above backbones using Gibson assembly, resulting in the pPAmKateC-2 and pXylPAmKateC-2 vectors. The McpA coding region was amplified with appropriate overhangs from genomic DNA from NA1000 cells and gel purified. The pXPAmKateC-2 vector was linearized by digesting with NdeI, and the McpA gene was inserted using Gibson assembly. The linker used for the McpA fusion was GTLSRPENSNVHRS. PAmKate–PopZ. To construct an N-terminal fusion construct, PAmKate and PopZ genes were PCR amplified with a –GGGSGGGS– linker and cloned into pXyl-YFPC-2 that was digested by NdeI/NheI using Gibson Assembly ( 40 , 41 ). The ligation was transformed into Escherichia coli DH5α cells and selected on LB-kan plates. Sequence-verified plasmid was then transformed into NA1000 cells via electroporation. SpmX–PAmKate. In order to produce the plasmid for the SpmX–PAmKate C-terminal fusion on the native promoter, the region encoding SpmX and the 500 base pairs upstream were amplified from genomic DNA from NA1000 cells and gel purified. This gene was then inserted at the EcoRI site on the linearized pPAmKateC-2 backbone. The linker used for the SpmX fusion was PAGALINMHGTLRSRAPENSNVTRHRSAT. Room Temperature Superresolution Imaging. C. crescentus cells were induced with 0.3% xylose for 3 h (McpA–PAmKate, PAmKate–PopZ) or cultured with endogenous expression (SpmX–PAmKate) and placed on agarose pads. These molecules either form relatively fixed structures or do not move dramatically during live cell imaging; highly mobile molecules are rejected as bad fits. Imaging was performed with a custom epifluorescence microscope. Fluorescence emission under 680 W/cm 2 of 561 nm excitation (Coherent Sapphire) was collected using an oil immersion, supercorrected objective (Olympus PLANON60xOSC, 60×/N.A. 1.4) mounted in a Nikon Diaphot 200 microscope and imaged onto an EMCCD camera (Andor iXon) at 20 Hz. Occasional pulses (150 nm; intensity, 18 nm;
📊 Figures
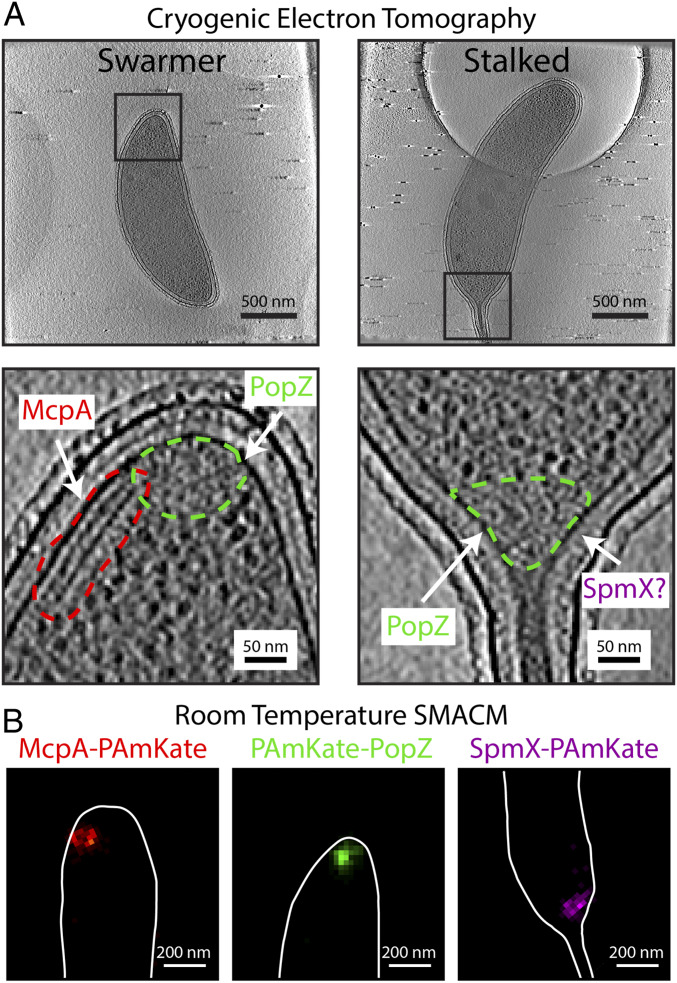
Fig. 1.
Three proteins, McpA, PopZ, and SpmX, in C. crescentus imaged with two different imaging modalities. ( A , Top ) Tomographic slices of CET data showing the two different cell types, motile swarmer and...
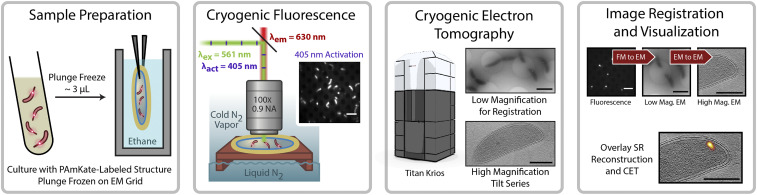
Fig. 2.
Workflow for CIASM. C. crescentus cultures with cells expressing PAmKate fusion proteins are plunge-frozen on electron microscopy grids. The grids are loaded onto a cryogenic microscope stage for sing...
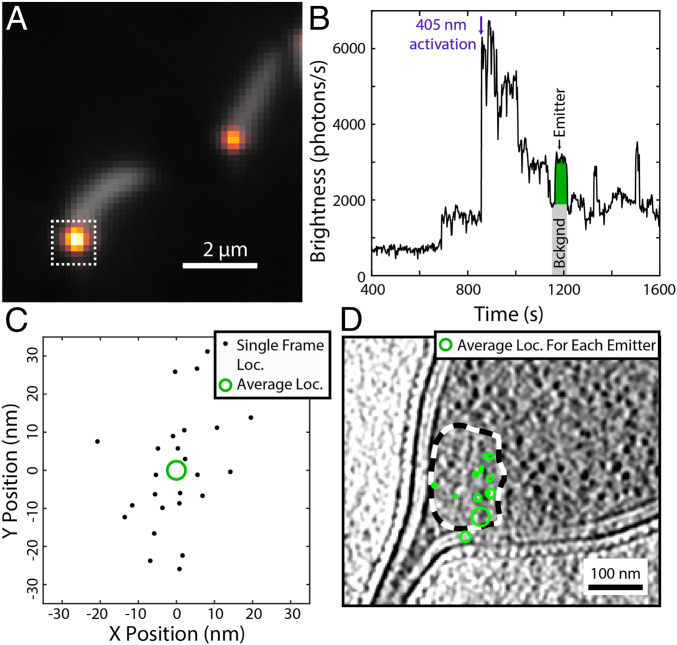
Fig. 3.
Representative cryogenic SMACM data from PAmKateu2013PopZ fusion constructs in C. crescentus . ( A ) Overlay of diffraction-limited fluorescence from the average of the 405-nm photoactivation frames (...
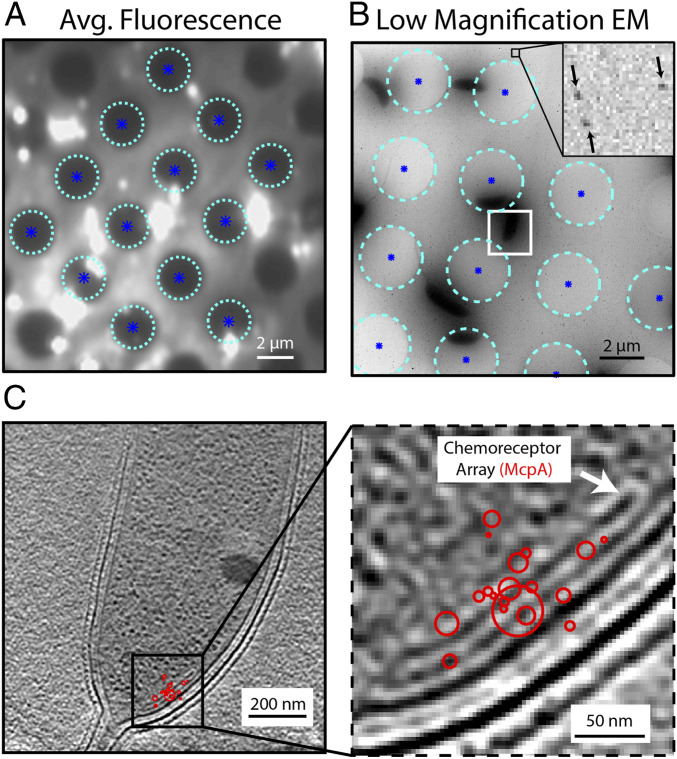
Fig. 4.
Registration of SMACM localizations and CET data. ( A ) Heavily saturated average fluorescence data showing the identified centers (dark blue asterisks) of the holes (cyan circles) in the holey carbon...
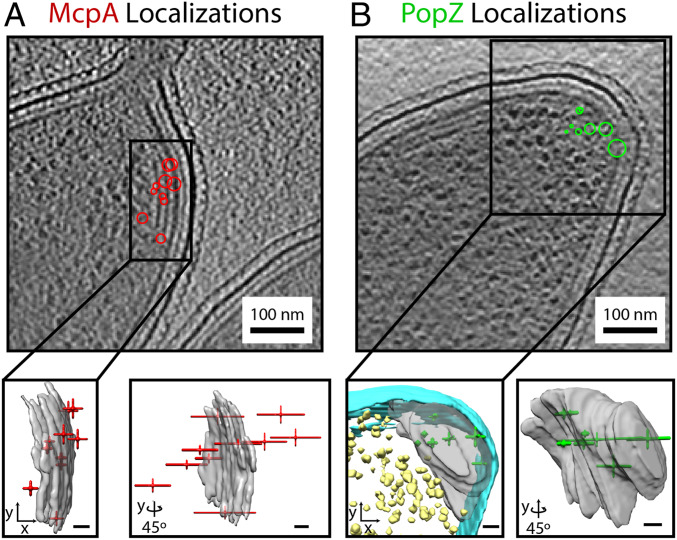
Fig. 5.
SMACM localizations in 3D cellular context. ( A , Top ) McpAu2013PAmKate localizations (red) overlaid onto a single tomographic slice. ( A , Bottom ) The same localizations represented as crosshairs w...
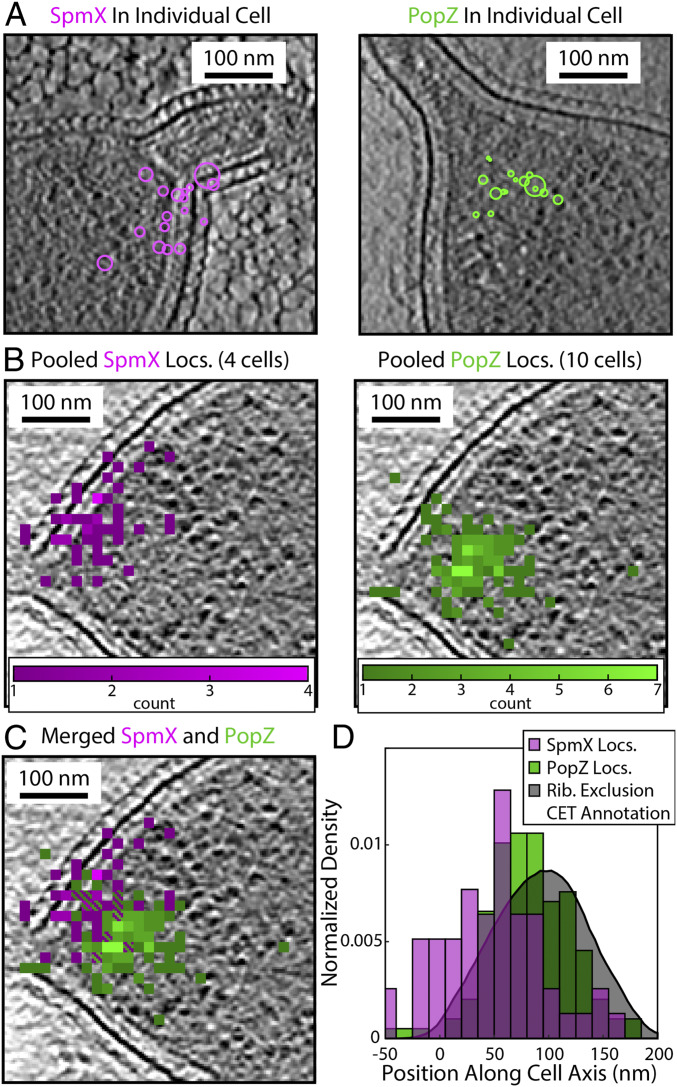
Fig. 6.
Subcellular organization of SpmX and PopZ revealed by CIASM. ( A ) SMACM localizations of SpmXu2013PAmKate (magenta) and PAmKateu2013PopZ (green) from individual cells registered with a tomographic sl...
Figure images are served from the NIH/NLM PubMed Central Open Access Subset or Europe PMC; copyright remains with the publishers and authors.
💬 Discussion
0 commentsNo comments yet. Be the first to start a discussion!
Leave a Comment