Abstract
Nipah virus (NiV) is a paramyxovirus that infects host cells through the coordinated efforts of two envelope glycoproteins. The G glycoprotein attaches to cell receptors, triggering the fusion (F) glycoprotein to execute membrane fusion. Here we report the first crystal structure of the pre-fusion form of the NiV-F glycoprotein ectodomain. Interestingly this structure also revealed a hexamer-of-trimers encircling a central axis. Electron tomography of Nipah virus-like particles supported the hexameric pre-fusion model, and biochemical analyses supported the hexamer-of-trimers F assembly in solution. Importantly, structure-assisted site-directed mutagenesis of the interfaces between F trimers highlighted the functional relevance of the hexameric assembly. Shown here, in both cell-cell fusion and virus-cell fusion systems, our results suggested that this hexamer-of-trimers assembly was important during fusion pore formation. We propose that this assembly would stabilize the pre-fusion F conformation prior to cell attachment and facilitate the coordinated transition to a post-fusion conformation of all six F trimers upon triggering of a single trimer. Together, our data reveal a novel and functional pre-fusion architecture of a paramyxoviral fusion glycoprotein.
🔬 Techniques
🧬 Organisms
✨ Fluorophores
🧪 Sample Preparation
🔬 Cell Lines
🏭 Microscope Brands
🧪 Reagent Suppliers
📷 Detectors
💻 Software Details
💾 Data Repositories
🏛️ Research Organizations (ROR)
Affiliated research institutions:
📋 Methods
Construct design and glycoprotein expression
The construction, expression and purification of the GCNt stabilized pre-fusion soluble version of the NiV-F glycoprotein (NiV-sFGCNt) had been detailed previously [ 28 , 29 ]. Briefly, The predicted transmembrane (TM) anchor domain (residues 488–510) and the C-terminal cytoplasmic tail (CT) domain (residues 511–546) of the NiV- F were replaced by the GCNt motif (MKQIEDKIEEILSKIYHIENEIARIKKLIGE) [ 47 ] in heptad phase followed by a Factor Xa protease cleavage site (IEGR) and the S-peptide tag. A 293T stable cell line expressing the NiV-sFGCNt was generated. Preparation of the sF glycoprotein from 293T stable cell lines was carried out using serum-free culture conditions and employing a combination of S-protein agarose (EMD Biosciences) affinity column and size exclusion chromatography using a HiLoad 16/60 Superdex 200 preparative grade gel filtration column (GE Healthcare) steps to isolate pure NiV-sFGCNt trimer. Crystallization and structure determination Crystals of NiV-sFGCNt formed after two weeks in 2μl hanging drops by vapor diffusion against reservoir solution (in a 1:1 protein-to-reservoir-solution ratio) containing 0.1 M HEPES pH 7.3, 1% Jeffamine ED-2001 and 1.2 M Sodium Malonate. For cryo-protection, crystals were soaked step-wise in reservoir solution starting from 5% up to 25% glycerol and were flash-frozen in liquid nitrogen. Diffraction data were collected at beamline NE-CAT ID-24 of the Advanced Photon Source at Argonne National Laboratory and processed with HKL2000 program package[ 48 ]. The structure was determined by molecular replacement with PDB ID 2B9B (PIV5 pre-fusion F protein) as the searching model and MOLREP program in CCP4 Suite [ 49 ]. The structure was refined carefully with grouped B-factor refinement (two B-factors per residue), and non-crystallographic symmetry (NCS) restrains in CNS1.2 [ 50 ]. NCS restrains were applied to the six chains of NiV-F in one asymmetric unit. The electron density maps for model building were improved by B-factor sharpening with a value of -70 Å 2 . All model building was performed in Coot [ 51 ]. The final structure model was checked by the program PROCHECK [ 52 ]. Statistics of data collection and refinement are listed in Table A in S1 Text . Noteworthy, all conserved Cys residues aligned between the NiV and PIV5 F structures. Crosslinking assay and Sucrose gradient PAGE Purified NiV-sFGCNt trimer was concentrated to 50 mg/mL using the Corning Spin-X UF 500μL Centrifugal Concentrator (Corning Inc). Glutaraldehyde was added to the concentrated material to various final concentrations ranging from 0.005% to 0.1% yielding protein concentrations between 40–45 mg/mL. 5μg of cross-linked products were analyzed on Blue Native PAGE (Invitrogen) with Coomassie staining. To separate different oligomeric species of cross linked NiV-sFGCNt trimer, 100μg of the 50 mg/mL sF was cross-linked with 0.08% gluteraldehyde yielding a final protein concentration of 42 mg/mL and the cross linked material was then subjected to 10–25% sucrose gradient ultracentrifugation and fractionated. To obtain the gradient, 6 ml of 10% sucrose was underlaid with 6 ml of 25% sucrose in a polyallomer 14- by 95-mm tube. A linear sucrose gradient was generated using the Biocomp Gradient Master (Biocomp, Frederickton, NB, Canada) at an angle of 81.5° for 2 min 19 seconds at a speed of 14k rpm. The cross linked material was then overlaid on top of the gradient. The gradient was centrifuged at 40,000 rpm for 20 h at 4°C using an SW40 rotor (Beckman Coulter, Inc.). Fractions of ~200 μl each were collected from the bottom to the top of the gradient using a Beckman fraction recovery system and automated fraction collector. To analyze the fractions, 10 μl of each collected fraction was resolved on 3–12% BN-PAGE (Invitrogen) followed by western blotting. F oligomers were probed by monoclonal mouse anti-F specific antibody. Fractions with higher oligomers were pooled, desalted, concentrated and analyzed on Blue Native PAGE using Coomassie staining.
Show full methods section
Construct design and glycoprotein expression
The construction, expression and purification of the GCNt stabilized pre-fusion soluble version of the NiV-F glycoprotein (NiV-sFGCNt) had been detailed previously [ 28 , 29 ]. Briefly, The predicted transmembrane (TM) anchor domain (residues 488–510) and the C-terminal cytoplasmic tail (CT) domain (residues 511–546) of the NiV- F were replaced by the GCNt motif (MKQIEDKIEEILSKIYHIENEIARIKKLIGE) [ 47 ] in heptad phase followed by a Factor Xa protease cleavage site (IEGR) and the S-peptide tag. A 293T stable cell line expressing the NiV-sFGCNt was generated. Preparation of the sF glycoprotein from 293T stable cell lines was carried out using serum-free culture conditions and employing a combination of S-protein agarose (EMD Biosciences) affinity column and size exclusion chromatography using a HiLoad 16/60 Superdex 200 preparative grade gel filtration column (GE Healthcare) steps to isolate pure NiV-sFGCNt trimer. Crystallization and structure determination Crystals of NiV-sFGCNt formed after two weeks in 2μl hanging drops by vapor diffusion against reservoir solution (in a 1:1 protein-to-reservoir-solution ratio) containing 0.1 M HEPES pH 7.3, 1% Jeffamine ED-2001 and 1.2 M Sodium Malonate. For cryo-protection, crystals were soaked step-wise in reservoir solution starting from 5% up to 25% glycerol and were flash-frozen in liquid nitrogen. Diffraction data were collected at beamline NE-CAT ID-24 of the Advanced Photon Source at Argonne National Laboratory and processed with HKL2000 program package[ 48 ]. The structure was determined by molecular replacement with PDB ID 2B9B (PIV5 pre-fusion F protein) as the searching model and MOLREP program in CCP4 Suite [ 49 ]. The structure was refined carefully with grouped B-factor refinement (two B-factors per residue), and non-crystallographic symmetry (NCS) restrains in CNS1.2 [ 50 ]. NCS restrains were applied to the six chains of NiV-F in one asymmetric unit. The electron density maps for model building were improved by B-factor sharpening with a value of -70 Å 2 . All model building was performed in Coot [ 51 ]. The final structure model was checked by the program PROCHECK [ 52 ]. Statistics of data collection and refinement are listed in Table A in S1 Text . Noteworthy, all conserved Cys residues aligned between the NiV and PIV5 F structures. Crosslinking assay and Sucrose gradient PAGE Purified NiV-sFGCNt trimer was concentrated to 50 mg/mL using the Corning Spin-X UF 500μL Centrifugal Concentrator (Corning Inc). Glutaraldehyde was added to the concentrated material to various final concentrations ranging from 0.005% to 0.1% yielding protein concentrations between 40–45 mg/mL. 5μg of cross-linked products were analyzed on Blue Native PAGE (Invitrogen) with Coomassie staining. To separate different oligomeric species of cross linked NiV-sFGCNt trimer, 100μg of the 50 mg/mL sF was cross-linked with 0.08% gluteraldehyde yielding a final protein concentration of 42 mg/mL and the cross linked material was then subjected to 10–25% sucrose gradient ultracentrifugation and fractionated. To obtain the gradient, 6 ml of 10% sucrose was underlaid with 6 ml of 25% sucrose in a polyallomer 14- by 95-mm tube. A linear sucrose gradient was generated using the Biocomp Gradient Master (Biocomp, Frederickton, NB, Canada) at an angle of 81.5° for 2 min 19 seconds at a speed of 14k rpm. The cross linked material was then overlaid on top of the gradient. The gradient was centrifuged at 40,000 rpm for 20 h at 4°C using an SW40 rotor (Beckman Coulter, Inc.). Fractions of ~200 μl each were collected from the bottom to the top of the gradient using a Beckman fraction recovery system and automated fraction collector. To analyze the fractions, 10 μl of each collected fraction was resolved on 3–12% BN-PAGE (Invitrogen) followed by western blotting. F oligomers were probed by monoclonal mouse anti-F specific antibody. Fractions with higher oligomers were pooled, desalted, concentrated and analyzed on Blue Native PAGE using Coomassie staining.
Negative stain electron microscopy
Samples were prepared using conventional negative staining protocols [ 53 ]. Briefly, 3 μL of sample was pipetted onto a glow-discharged carbon-coated grid and stained with 1% (w/v) uranyl formate. Imaging was performed at room temperature with a Morgagni 268(D) transmission electron microscope (FEI Company) at 100kV at a magnification of 30,416x.
Electron Tomography of VLPs NiV-F
VLPs were produced by expressing NiV-F on 293T cells and then collecting, clearing, and purifying the cell supernatants through 20% sucrose, as previously established [ 54 ]. It has also been established that NiV-F can autonomously assemble and produce budding of NiV-F VLPs [ 55 ]. 3 μl VLP sample was applied on carbon covered copper grids. After one minute the fluid was absorbed with filter paper and 3 μL urinyl acetate (UA) (2.5%) was applied for 40 seconds. Excess UA was absorbed and the grid was left to dry for 2 minutes before being transferred to a Gatan-626 specimen holder. A Tecnai F20 transmission electron microscope (200kV) (FEI Company, OR) equipped with a field mission gun (FEG), computer-controlled compustage, a TIETZ F415MP 16 megapixel CCD camera was used to obtain a total of 141 tomographic images at tilts from -70 to +70 degrees. Tilt series were collected at 29,000x magnification with an applied defocus of -3 μm with FEI’s Batchtomography package. Tilt series alignment and tomographic reconstruction were performed by IMOD [ 56 ].
Cell-cell fusion assays Fusion between NiV
F and G glycoprotein-expressing effector cells and permissive target cells was measured by a β-Galactosidase (β-Gal) assay that was previously described [ 57 ]. Briefly, plasmids encoding WT NiV F or each mutant of F and NiV G at a 1:1 ratio or control/mock transfection were transfected into HeLa-USU effector cells. The transfected cells were then infected with vaccinia virus-encoding T7 RNA polymerase the following day. HEK293T cells served as receptor-positive target cells were also infected with the E. coli Lac Z-encoding reporter vaccinia virus. Cells were infected at an MOI of 10 and incubated at 31°C overnight. Cell-cell fusion reactions were conducted by incubating the target and effector cell mixtures at a ratio of 1:1 in 96-well plates at 37°C. Cytosine arabinoside (40μg/ml) was added to the fusion reaction mixture to reduce nonspecific β-Gal production. Nonidet P-40 was added to 0.5% final concentration at 2.5 hrs, and aliquots of the lysates were assayed for β-Gal at room temperature with the substrate chlorophenol red–D-galactopyranoside (Roche). Assays were performed in triplicate, and fusion results were calculated and expressed as rates of β-Gal activity (change in optical density at 570 nm per minute x 1,000) in VersaMAX microplate reader (Molecular Devices, Sunyvale, CA). Equal amount of leftover envelope glycoprotein expressing effector cells from each fusion reaction was used for evaluation of total F and G expression by immunoprecipitation and cell surface F expression by flow cytometry. For immunoprecipitation, cells were lysed and clarified by centrifugation. The lysates were then subjected to rabbit polyclonal anti-F or -G specific antisera and protein G Sepharose precipitation followed by SDS PAGE and western blot analysis. The blots were probed with F or G specific murine mAbs. For flow cytometry, the envelope expressing cells were washed once with PBS and then incubated with pre-fusion specific F mAb followed by incubation with fluorescein isothiocyanate (FITC)-conjugated polyclonal anti mouse Ab (Cell Signaling Technology, Inc., Danvers, MA). All incubations were in PBS with 3% goat serum and on ice for 1 h. Samples were washed three times with cold PBS between incubations and before being fixed in 1.6% paraformaldehyde and then analyzed on a Beckman Coulter Epics XL flow cytometer. The individual cell fusion reactions mediated by each mutant were converted to percentages of WT fusion activity and normalized with cell surface expression of WT F and each F mutants.
Pseudotyped virus entry assay
VSV-rLuc pseudotype viruses, harboring NiV-F and–G on their surface, were produced as previously described [ 31 ]. All NiV-F (C-terminal AU1-tag) and–G (C-terminal HA-tag) constructs, utilized for the production of the pseudotyped viruses, were cloned in the pcDNA3.1 vector. Viral copy numbers were quantified by real-time PCR [ 31 ] and 10-fold serial dilutions of each viral prep were tested on Vero cells for viral entry using a renilla luciferase detection system (Pierce) [ 58 ]. Relative light units (RLUs) were plotted against the viral genome copy number per milliliter and analyzed by linear regression using GraphPad Prism as previously described [ 58 ]. Illustrations All molecular representations were produced with PyMOL (Delano Scientific LLC). Figures were prepared using Adobe Illustrator, Adobe Photoshop.
Supporting Information S1 Text (Fig A) Comparison of the NiV-F trimer structure with these of the cleavage-activated (CA)-PIV5-F, and non-activated PIV5-F. (Fig B) Representative raw NiV-F EM and VLP-tomography images. (Table A) Crystallographic data collection and model refinement statistics. (DOC) Click here for additional data file.
📊 Figures
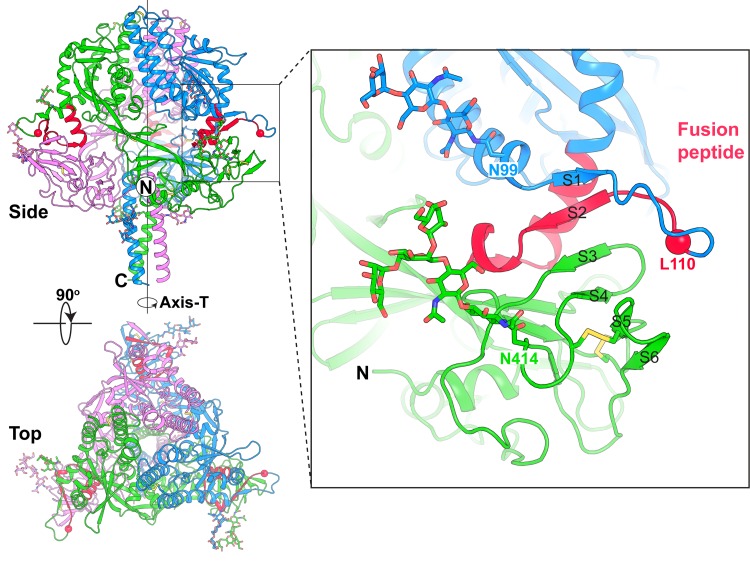
Fig 1
Structure the NiV-F trimer.
The NiV-F trimer has a tree-like overall shape with the three copies of the F glycoprotein (colored in blue, green and violet) twined around a central axis (Axis-T). The fusion Peptide (FP) is colored...
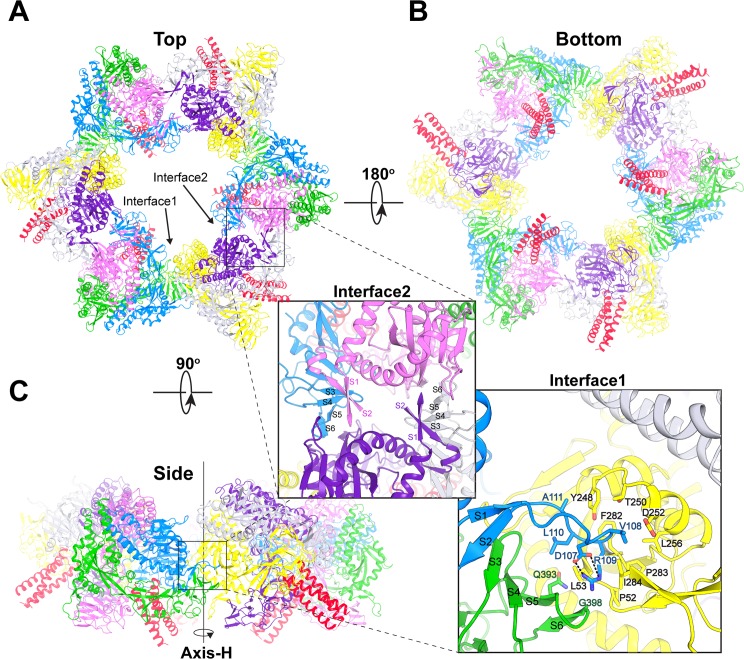
Fig 2
Hexameric Assembly of NiV-F glycoprotein trimers.
The six NiV-F copies are colored in blue, green, pink, yellow, grey and purple, respectively. The C-terminal helical bundles of the NiV-F trimers are colored in red. Six NiV-F trimers assemble into a ...
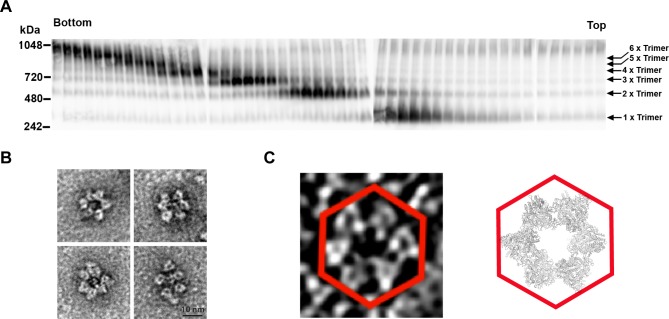
Fig 3
Formation of F hexamers-of-trimers in solution.
( A ) 100u03bcg of 50 mg/mL sF cross-linked with 0.08% glutaraldehyde was subjected to 10u201325% sucrose gradient ultracentrifugation and fractionated. 10u03bcL of each fraction was analyzed on Blue ...
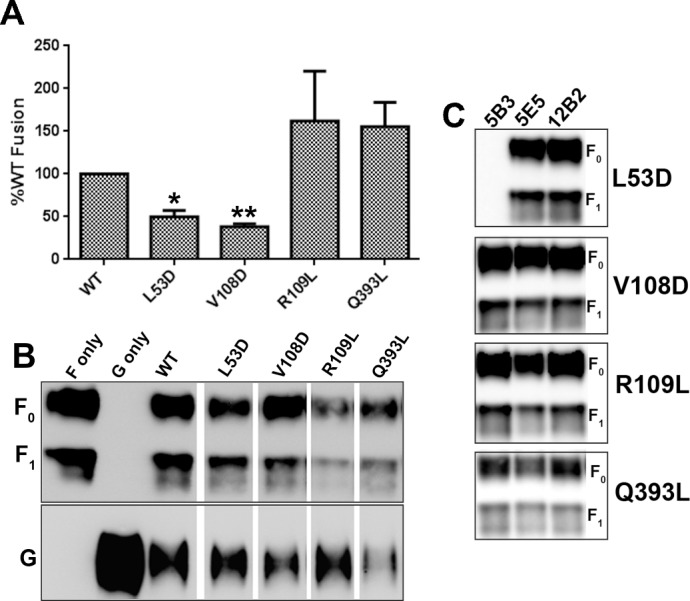
Fig 4
Cell-cell fusion and mAb binding activities of NiV-F mutants.
Four mutants of NiV-F within the trimer-trimer interface were tested for their ability to promote cell-cell fusion when co-expressed with NiV-G in a u03b2-Gal reporter cell-cell fusion assay using HEK...
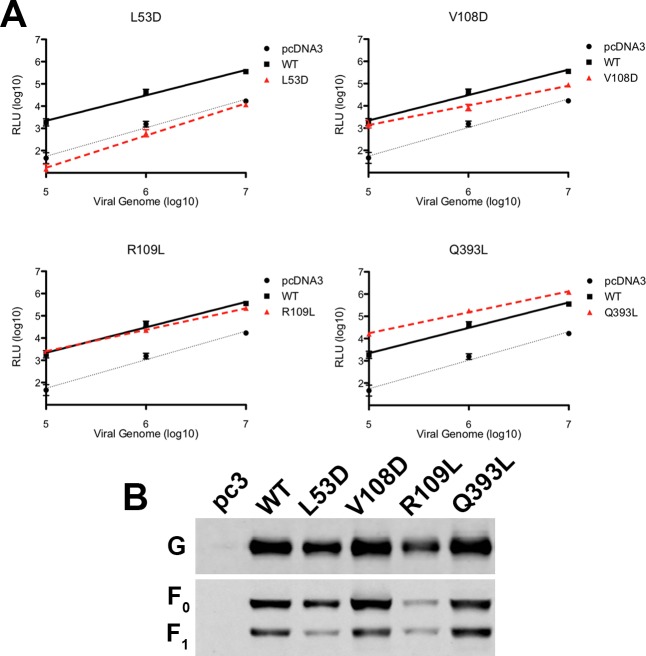
Fig 5
Viral entry is affected by mutations in the hexameric interface.
( A ) Relative entry levels of NiV/VSV-rluc virions containing wt NiV-G and wt NiV-F (solid black line) or mutant L53D, V108D, R109L or Q393L NiV-F (dotted red line). Vector alone (pcDNA3)/VSV is show...
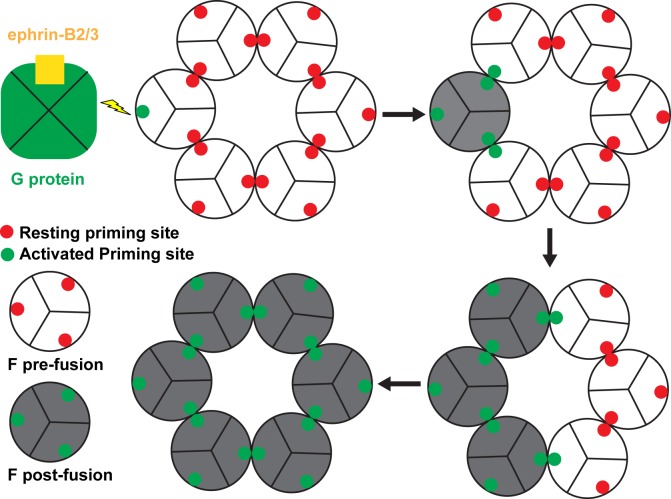
Fig 6
Schematic representation of the proposed NiV-F activation model.
Upon viral attachment, the ephrin receptor-mediated re-arrangements of NiV-G exert a triggering disturbance at an exposed u201cpriming siteu201d (presumably via direct G-F priming-site interactions) t...
Figure images are served from the NIH/NLM PubMed Central Open Access Subset or Europe PMC; copyright remains with the publishers and authors.
💬 Discussion
0 commentsNo comments yet. Be the first to start a discussion!
Leave a Comment