Abstract
Leukocyte residence in lymphoid organs is controlled by a balance between retention and egress-promoting chemoattractants sensed by pertussis toxin (PTX)-sensitive Gαi protein-coupled receptors (GPCRs). Here, we use two-photon intravital microscopy to show that immature B cell retention within bone marrow (BM) was strictly dependent on amoeboid motility mediated by CXCR4 and CXCL12 and by α4β1 integrin-mediated adhesion to VCAM-1. However, B lineage cell egress from BM is independent of PTX-sensitive GPCR signaling. B lineage cells expressing PTX rapidly exited BM even though their motility within BM parenchyma was significantly reduced. Our experiments reveal that when immature B cells are near BM sinusoids their motility is reduced, their morphology is predominantly rounded, and cells reverse transmigrate across sinusoidal endothelium in a largely nonamoeboid manner. Immature B cell egress from BM was dependent on a twofold CXCR4 down-regulation that was antagonized by antigen-induced BCR signaling. This passive mode of cell egress from BM also contributes significantly to the export of other hematopoietic cells, including granulocytes, monocytes, and NK cells, and is reminiscent of erythrocyte egress.
🔬 Techniques
💻 Software
✨ Fluorophores
🧪 Sample Preparation
🔬 Cell Lines
🏭 Microscope Brands
🧪 Reagent Suppliers
🔴 Lasers
🔎 Objectives
💻 Software Details
🏛️ Research Organizations (ROR)
Affiliated research institutions:
📋 Methods
Mice. Adult C57BL/6 (CD45.2), Boy/J (CD45.1), Itgb1 Fl/Fl , Lyz2 Cre/+ , Cd19 Cre/+ , and Rosa26 FloxSTOP-ZsGreen/+ ( Madisen et al., 2010 ) mice were from obtained from The Jackson Laboratory. MD4 and MD4.Bcl2 transgenic mice were from an internal colony (J.G. Cyster). B1-8 transgenic mice were provided by A. Haberman (Yale University, New Haven, CT). Cxcr4 Fl/− and Rosa26 FloxSTOP-PTX/+ ( Regard et al., 2007 ) mice were crossed with Mb1 Cre/+ mice ( Pelanda et al., 2002 ) to generate Cxcr4 Fl/− Mb1 Cre/+ and Rosa26 FloxSTOP-PTX/+ Mb1 cre/+ mice (all provided by J.G. Cyster). Rosa26 FloxSTOP-PTX/+ mice were crossed to Lyz2 Cre/+ and Il7r Cre/+ to generate Rosa26 FloxSTOP-PTX/+ Il7r Cre/+ , Rosa26 FloxSTOP-PTX/+ Lyz2 Cre/+ , and control littermates. Il7r Cre/+ mice were provided by H.-R. Rodewald (German Cancer Research Center, Heidelberg, Germany). For intravital imaging, Cxcr4 Fl/− , Itgb1 Fl/Fl , and Rosa26 FloxSTOP-PTX/+ Mb1 Cre/+ were crossed with Rag1 GFP/+ mice ( Kuwata et al., 1999 ). Mice were maintained under specific pathogen–free conditions and used according to the protocols approved by the Yale University Institutional Animal Care and Use Committee. Two-photon intravital imaging. Mice were anesthetized with ketamine/xylazine and immobilized on a custom-built stage. Laser-scanning microscopy images were collected using a BX61WI fluorescence microscope (Olympus) and a 20× 0.95NA water immersion objective (Olympus) and dedicated single-beam TriM Scope II (LaVision Biotec) controlled by IMSpector software. The microscope was outfitted with a Chameleon Vision II Ti:Sapphire laser (Coherent) with pulse precompensation. For 4D analysis of cell migration, stacks of 13–17 optical sections with 3-µm z spacing were acquired every 20 or 30 s for 30 min with the laser tuned to a wavelength of 845–875 nm. Pharmacological antagonists AMD3100 (Tocris Bioscience), 4F-benzoyl-TN14003 (a gift from H. Tamamura, Tokyo Medical and Dental University, Tokyo, Japan), and anti–VCAM-1 (clone M/K2; Bioexpress Inc.), anti-α4 (clone PS/2; LygoCyte Pharma Inc.), and anti-CXCL12 (clone 79014; R&D Systems) blocking antibodies were injected i.v. 1–5 min before imaging. Videos in which significant tissue drifting was detected were excluded from analyses. A few videos showed small tissue drifting, which was computationally corrected with Imaris software tool “Correct Drift” (Bitplane). The axis ratio of parenchymal GFP + cells was calculated by measuring the distance between the two furthest GFP + points on the x and y planes of individual cells after collapse of the z plane using Imaris. Parenchymal GFP + cells that were distinguishable from neighboring cells were selected for analysis to avoid miscalculation of the axis ratio of a single GFP + cell. Tissue preparation, cell enumeration, and antibodies. BM cells were flushed from femurs and tibias in DMEM (Cellgro) containing 2% FBS (Invitrogen), 5% of antibiotics (Cellgro), and Hepes (Cellgro). PB was collected from the portal vein, and erythrocytes were lysed with NH 4 Cl, KHCO 3 , and EDTA. Spleen was dissociated in 5 ml DMEM containing 2% FBS, 5% of antibiotics, and Hepes using a cell strainer (Thermo Fisher Scientific). Cells were counted with a Coulter Counter (Beckman Coulter). B cells were identified by staining with anti-B220 (RA3-6B2) or CD19 (1D3), anti-IgM (11/41), anti-IgD (11-26c.2a), and anti-CD93 (AA4.1) antibodies. Monocytes and granulocytes were stained with Ly6C (HK1.4), CD11b (M1/70.15), and CD115 (AFS98) antibodies, and NK cells were stained with CD3e (145-2C11) and NK1.1 (PK136) antibodies. Dead cells were excluded by staining with DAPI. Cells were analyzed by FACS (LSRII; BD). Measurement of FITC-conjugated dextran dye perfusion into the parenchyma. Dye perfusion was measured by selecting two regions of interest in the BM parenchyma and FITC-conjugated labeled sinusoids using Imaris. A surface was applied to the green channel to generate voxels in regions of interest within the BM parenchyma and sinusoids over the course of the video. Perfusion of FITC-dextran into the parenchyma was assessed by measuring the number of voxels that appeared in the regions of interest over the course of a 29-min video. Calculation of interstitial flow rate of dye perfusion into the BM parenchyma. Analyses of interstitial fluid flow were performed as described previously ( Iliff et al., 2012 ; Egawa et al., 2013 ). In brief, flow rate within BM parenchyma was measured by injecting FITC-dextran (500 kD) or BSA–Texas red i.v. into anesthetized mice. Mice were then immediately imaged by two-photon IVM. The volumetric flow rate in the BM parenchyma was quantified by first applying a surface to the appropriate channel. Next, a three-dimensional box of a fixed volume was applied to three regions of interest. The instantaneous flow rates (on average six time points) of dye before the three-dimensional box was filled were used to calculate the mean instantaneous flow rate. The instantaneous flow rate (µm 3 /s) was calculated by taking the difference between volumes from consecutive time points and dividing this difference by time (60 s). In vivo labeling of BM sinusoidal B cell subsets. BM sinusoidal cells were labeled by injecting i.v. 0.3 µg phycoerythrin-conjugated rat anti–mouse CD19 (1D3) in 200 µl PBS. 2 min after, mice were sacrificed in a CO 2 chamber. BrdU and PTX treatment. Mice were treated with 1 mg/ml BrdU (BD) i.v. and administered 1 mg/ml BrdU (Sigma-Aldrich) in drinking water 24 h before analysis. 1 µg PTX (List Bio Labs) was injected i.v. 24 h before analysis. BrdU-labeled cells were identified staining with anti-BrdU FITC according to the manufacturer’s protocol. B cells were identified by staining with anti-B220 (RA3-6B2) or CD19 (ebio1D3), anti-IgM (11/41), anti-IgD (11-26.c.2a), and anti-CD93 (AA4.1). Monocytes, NK cells, and granulocytes were identified by staining for anti-Ly6c (HK1.4), anti-CD11b (M1/70), anti-CD3ε (145-2C11), anti-NK1.1 (PK136), and anti-CD115 (AFS98). After staining, cells were analyzed by FACS (LSRII). BM chimeras. Approximately 1.5 × 10 6 total BM cells from Ly5.1 + donors were mixed with 1.5 × 10 6 total BM cells from adult Boy/J (Ly5.2 + ) mice and were transferred into adult Boy/J mice that had been exposed to two rounds of 6.35 Gy separated by 3 h. Chimeras were analyzed at least 6 wk after reconstitution. Transwell migration assays. Chemotaxis assays were performed using 10 6 BM or spleen cells incubated for 30 min with 1× DMEM containing 0.5% fatty acid–free BSA (EMD Biosciences), 5% of antibiotics, l -glutamine (Cellgro), and Hepes. Cells were then allowed to migrate through 5-µm-pore–sized transwells (Corning) toward soluble CXCL12 (R&D Systems), 2-AG (Cayman), or CXCL13 (PeproTech) for 3 h at 37°C. Cells were collected, stained, and resuspended in 40 ml of staining buffer and analyzed by flow cytometry for 40 s. Retroviral BM transduction. The R334X mutation in CXCR4 cytoplasmic tail was cloned into mammalian retroviral vector (pMSCV) upstream of an IRES-truncated GFP cassette as a reporter. Sanger DNA sequencing reaction verified truncated CXCR4 sequences. Phoenix 293T cells were transfected with MSCV retroviral constructs with Lipofectamine 2000 (Invitrogen) according to the manufacturer’s protocol. For mutant Cxcr4 (R33x) transduction of hematopoietic stem cells, BM cells were harvested 5 d after i.p. injection of 5-fluoracil (Sigma-Aldrich) and cultured with IL-3, IL-6, and 100 ng/ml mSCF (PeproTech). BM cells were then spin-infected twice with a retroviral constructs and injected i.v. into lethally irradiated Boy/J recipients. Mice were analyzed at least 5 wk after reconstitution. In vitro antagonist treatments. 10 6 BM or spleen cells were treated with saline (0.9% NaCl) or AMD3100 for 1 h at 37°C. Cells were then removed from incubation and used in transwell migration assays. BCR stimulations in vivo and in vitro. BM cells isolated from femurs and tibias were prepared at 10 7 cells/ml in DMEM containing 10% FBS, 10 mM Hepes, and a cocktail of penicillin and streptomycin (50 U/liter and 50 µg/liter, respectively). Approximately 2 × 10 6 cells were left unstimulated or stimulated with 20 µg/ml F(ab′)2 fragment goat anti–mouse IgM (Jackson ImmunoResearch Laboratories, Inc.), with 20 µg/ml HEL (Sigma-Aldrich), or with 1 mg/ml NP-BSA (Biosearch Technologies, Inc.), at 37°C and 5% CO 2 for the indicated time points in the Fig. 6 legend. MD4 and MD4.Bcl2 transgenic mice were stimulated with 10 mg HEL for 6 h. Mice were injected with 0.3 µg phycoerythrin-conjugated rat anti–mouse CD19 (1D3) in 200 µl PBS before sacrifice. Cells isolated from femur and tibia BM, PB (portal vein), and spleen were counted in a Coulter Counter and stained to detect B cell subsets, as previously described in Tissue preparation, cell enumeration, and antibodies. Statistics. Student’s two-tailed t test or χ 2 test was performed using GraphPad Software Prism 6 or Microsoft Excel. A value
Show full methods section
Mice. Adult C57BL/6 (CD45.2), Boy/J (CD45.1), Itgb1 Fl/Fl , Lyz2 Cre/+ , Cd19 Cre/+ , and Rosa26 FloxSTOP-ZsGreen/+ ( Madisen et al., 2010 ) mice were from obtained from The Jackson Laboratory. MD4 and MD4.Bcl2 transgenic mice were from an internal colony (J.G. Cyster). B1-8 transgenic mice were provided by A. Haberman (Yale University, New Haven, CT). Cxcr4 Fl/− and Rosa26 FloxSTOP-PTX/+ ( Regard et al., 2007 ) mice were crossed with Mb1 Cre/+ mice ( Pelanda et al., 2002 ) to generate Cxcr4 Fl/− Mb1 Cre/+ and Rosa26 FloxSTOP-PTX/+ Mb1 cre/+ mice (all provided by J.G. Cyster). Rosa26 FloxSTOP-PTX/+ mice were crossed to Lyz2 Cre/+ and Il7r Cre/+ to generate Rosa26 FloxSTOP-PTX/+ Il7r Cre/+ , Rosa26 FloxSTOP-PTX/+ Lyz2 Cre/+ , and control littermates. Il7r Cre/+ mice were provided by H.-R. Rodewald (German Cancer Research Center, Heidelberg, Germany). For intravital imaging, Cxcr4 Fl/− , Itgb1 Fl/Fl , and Rosa26 FloxSTOP-PTX/+ Mb1 Cre/+ were crossed with Rag1 GFP/+ mice ( Kuwata et al., 1999 ). Mice were maintained under specific pathogen–free conditions and used according to the protocols approved by the Yale University Institutional Animal Care and Use Committee. Two-photon intravital imaging. Mice were anesthetized with ketamine/xylazine and immobilized on a custom-built stage. Laser-scanning microscopy images were collected using a BX61WI fluorescence microscope (Olympus) and a 20× 0.95NA water immersion objective (Olympus) and dedicated single-beam TriM Scope II (LaVision Biotec) controlled by IMSpector software. The microscope was outfitted with a Chameleon Vision II Ti:Sapphire laser (Coherent) with pulse precompensation. For 4D analysis of cell migration, stacks of 13–17 optical sections with 3-µm z spacing were acquired every 20 or 30 s for 30 min with the laser tuned to a wavelength of 845–875 nm. Pharmacological antagonists AMD3100 (Tocris Bioscience), 4F-benzoyl-TN14003 (a gift from H. Tamamura, Tokyo Medical and Dental University, Tokyo, Japan), and anti–VCAM-1 (clone M/K2; Bioexpress Inc.), anti-α4 (clone PS/2; LygoCyte Pharma Inc.), and anti-CXCL12 (clone 79014; R&D Systems) blocking antibodies were injected i.v. 1–5 min before imaging. Videos in which significant tissue drifting was detected were excluded from analyses. A few videos showed small tissue drifting, which was computationally corrected with Imaris software tool “Correct Drift” (Bitplane). The axis ratio of parenchymal GFP + cells was calculated by measuring the distance between the two furthest GFP + points on the x and y planes of individual cells after collapse of the z plane using Imaris. Parenchymal GFP + cells that were distinguishable from neighboring cells were selected for analysis to avoid miscalculation of the axis ratio of a single GFP + cell. Tissue preparation, cell enumeration, and antibodies. BM cells were flushed from femurs and tibias in DMEM (Cellgro) containing 2% FBS (Invitrogen), 5% of antibiotics (Cellgro), and Hepes (Cellgro). PB was collected from the portal vein, and erythrocytes were lysed with NH 4 Cl, KHCO 3 , and EDTA. Spleen was dissociated in 5 ml DMEM containing 2% FBS, 5% of antibiotics, and Hepes using a cell strainer (Thermo Fisher Scientific). Cells were counted with a Coulter Counter (Beckman Coulter). B cells were identified by staining with anti-B220 (RA3-6B2) or CD19 (1D3), anti-IgM (11/41), anti-IgD (11-26c.2a), and anti-CD93 (AA4.1) antibodies. Monocytes and granulocytes were stained with Ly6C (HK1.4), CD11b (M1/70.15), and CD115 (AFS98) antibodies, and NK cells were stained with CD3e (145-2C11) and NK1.1 (PK136) antibodies. Dead cells were excluded by staining with DAPI. Cells were analyzed by FACS (LSRII; BD). Measurement of FITC-conjugated dextran dye perfusion into the parenchyma. Dye perfusion was measured by selecting two regions of interest in the BM parenchyma and FITC-conjugated labeled sinusoids using Imaris. A surface was applied to the green channel to generate voxels in regions of interest within the BM parenchyma and sinusoids over the course of the video. Perfusion of FITC-dextran into the parenchyma was assessed by measuring the number of voxels that appeared in the regions of interest over the course of a 29-min video. Calculation of interstitial flow rate of dye perfusion into the BM parenchyma. Analyses of interstitial fluid flow were performed as described previously ( Iliff et al., 2012 ; Egawa et al., 2013 ). In brief, flow rate within BM parenchyma was measured by injecting FITC-dextran (500 kD) or BSA–Texas red i.v. into anesthetized mice. Mice were then immediately imaged by two-photon IVM. The volumetric flow rate in the BM parenchyma was quantified by first applying a surface to the appropriate channel. Next, a three-dimensional box of a fixed volume was applied to three regions of interest. The instantaneous flow rates (on average six time points) of dye before the three-dimensional box was filled were used to calculate the mean instantaneous flow rate. The instantaneous flow rate (µm 3 /s) was calculated by taking the difference between volumes from consecutive time points and dividing this difference by time (60 s). In vivo labeling of BM sinusoidal B cell subsets. BM sinusoidal cells were labeled by injecting i.v. 0.3 µg phycoerythrin-conjugated rat anti–mouse CD19 (1D3) in 200 µl PBS. 2 min after, mice were sacrificed in a CO 2 chamber. BrdU and PTX treatment. Mice were treated with 1 mg/ml BrdU (BD) i.v. and administered 1 mg/ml BrdU (Sigma-Aldrich) in drinking water 24 h before analysis. 1 µg PTX (List Bio Labs) was injected i.v. 24 h before analysis. BrdU-labeled cells were identified staining with anti-BrdU FITC according to the manufacturer’s protocol. B cells were identified by staining with anti-B220 (RA3-6B2) or CD19 (ebio1D3), anti-IgM (11/41), anti-IgD (11-26.c.2a), and anti-CD93 (AA4.1). Monocytes, NK cells, and granulocytes were identified by staining for anti-Ly6c (HK1.4), anti-CD11b (M1/70), anti-CD3ε (145-2C11), anti-NK1.1 (PK136), and anti-CD115 (AFS98). After staining, cells were analyzed by FACS (LSRII). BM chimeras. Approximately 1.5 × 10 6 total BM cells from Ly5.1 + donors were mixed with 1.5 × 10 6 total BM cells from adult Boy/J (Ly5.2 + ) mice and were transferred into adult Boy/J mice that had been exposed to two rounds of 6.35 Gy separated by 3 h. Chimeras were analyzed at least 6 wk after reconstitution. Transwell migration assays. Chemotaxis assays were performed using 10 6 BM or spleen cells incubated for 30 min with 1× DMEM containing 0.5% fatty acid–free BSA (EMD Biosciences), 5% of antibiotics, l -glutamine (Cellgro), and Hepes. Cells were then allowed to migrate through 5-µm-pore–sized transwells (Corning) toward soluble CXCL12 (R&D Systems), 2-AG (Cayman), or CXCL13 (PeproTech) for 3 h at 37°C. Cells were collected, stained, and resuspended in 40 ml of staining buffer and analyzed by flow cytometry for 40 s. Retroviral BM transduction. The R334X mutation in CXCR4 cytoplasmic tail was cloned into mammalian retroviral vector (pMSCV) upstream of an IRES-truncated GFP cassette as a reporter. Sanger DNA sequencing reaction verified truncated CXCR4 sequences. Phoenix 293T cells were transfected with MSCV retroviral constructs with Lipofectamine 2000 (Invitrogen) according to the manufacturer’s protocol. For mutant Cxcr4 (R33x) transduction of hematopoietic stem cells, BM cells were harvested 5 d after i.p. injection of 5-fluoracil (Sigma-Aldrich) and cultured with IL-3, IL-6, and 100 ng/ml mSCF (PeproTech). BM cells were then spin-infected twice with a retroviral constructs and injected i.v. into lethally irradiated Boy/J recipients. Mice were analyzed at least 5 wk after reconstitution. In vitro antagonist treatments. 10 6 BM or spleen cells were treated with saline (0.9% NaCl) or AMD3100 for 1 h at 37°C. Cells were then removed from incubation and used in transwell migration assays. BCR stimulations in vivo and in vitro. BM cells isolated from femurs and tibias were prepared at 10 7 cells/ml in DMEM containing 10% FBS, 10 mM Hepes, and a cocktail of penicillin and streptomycin (50 U/liter and 50 µg/liter, respectively). Approximately 2 × 10 6 cells were left unstimulated or stimulated with 20 µg/ml F(ab′)2 fragment goat anti–mouse IgM (Jackson ImmunoResearch Laboratories, Inc.), with 20 µg/ml HEL (Sigma-Aldrich), or with 1 mg/ml NP-BSA (Biosearch Technologies, Inc.), at 37°C and 5% CO 2 for the indicated time points in the Fig. 6 legend. MD4 and MD4.Bcl2 transgenic mice were stimulated with 10 mg HEL for 6 h. Mice were injected with 0.3 µg phycoerythrin-conjugated rat anti–mouse CD19 (1D3) in 200 µl PBS before sacrifice. Cells isolated from femur and tibia BM, PB (portal vein), and spleen were counted in a Coulter Counter and stained to detect B cell subsets, as previously described in Tissue preparation, cell enumeration, and antibodies. Statistics. Student’s two-tailed t test or χ 2 test was performed using GraphPad Software Prism 6 or Microsoft Excel. A value
📊 Figures
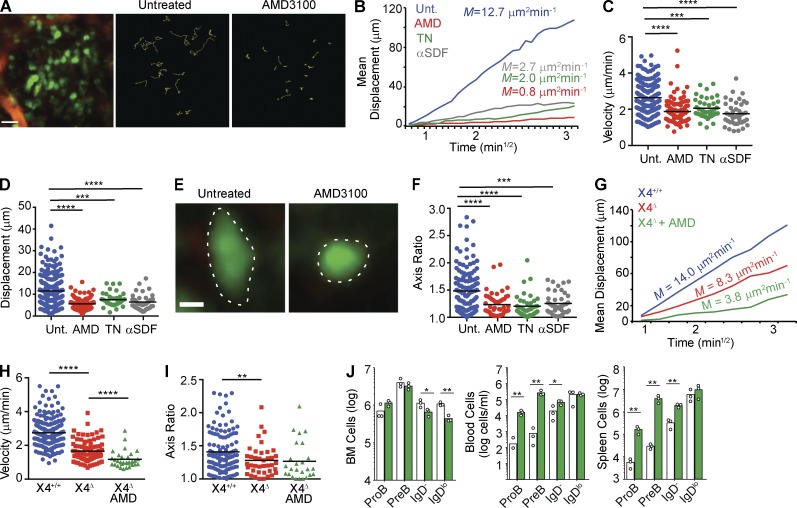
Figure 1.
CXCR4 antagonism inhibits B lineage cell migration in BM. (Au2013F) Rag1 GFP/+ mice were injected i.v. with AMD3100, TN14003, or anti-CXCL12 antibody. Blood vessels were labeled with 2,000-kD dextran-...
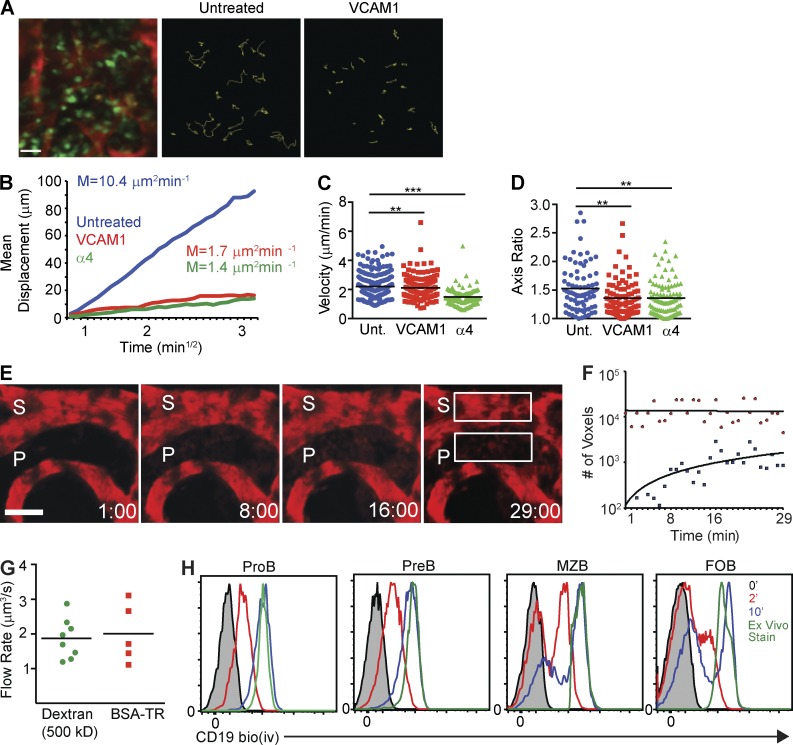
Figure 2.
Developing B cell motility in BM parenchyma is strictly dependent on u03b14u03b21 integrinu2013mediated adhesion to VCAM-1. (Au2013D) Rag1 GFP/+ were injected (i.v.) with integrin u03b14 or VCAM-1 blo...
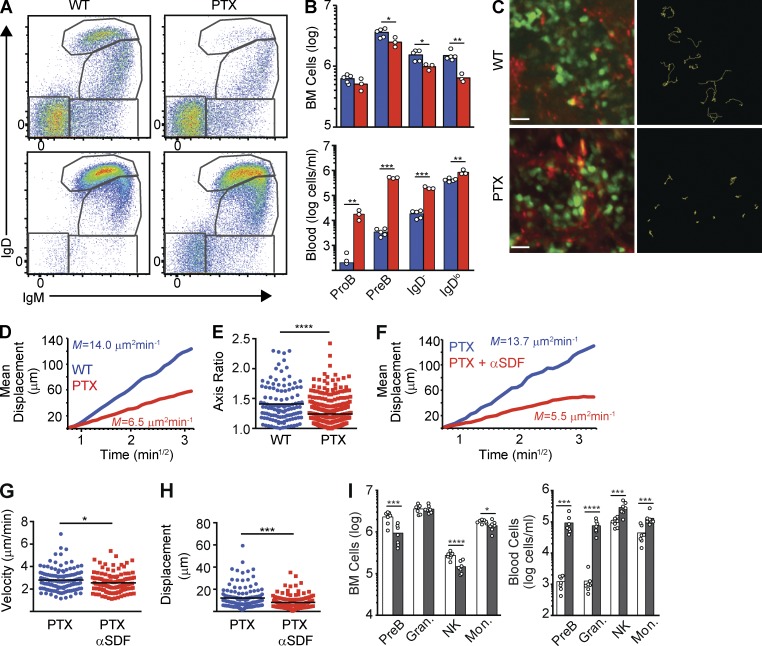
Figure 3.
B cells egress BM independently of GPCR-mediated migration. (A) IgM and IgD expression in live gated (DAPI u2212 ) B220 + cells in BM (top) and PB (bottom) of Mb1 Cre/+ (WT, left) and Mb1 Cre/+ Rosa26...
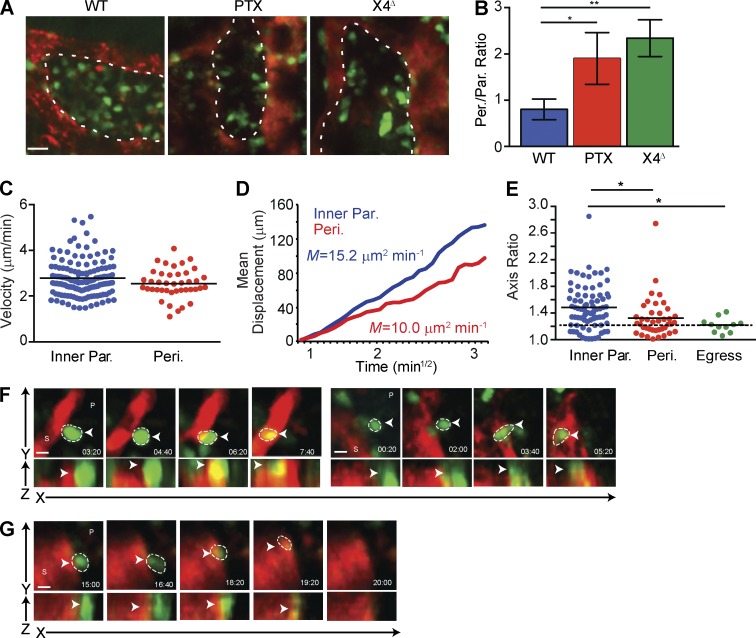
Figure 4.
Morphology and motility of developing B cells during BM egress. (A) Distribution of B lineage ( Rag1 GFP/+ ) cells in BM of Mb1 Cre/+ Rosa26 +/+ mice (WT, left), Mb1 Cre/+ Rosa26 PTX/+ mice (PTX, midd...
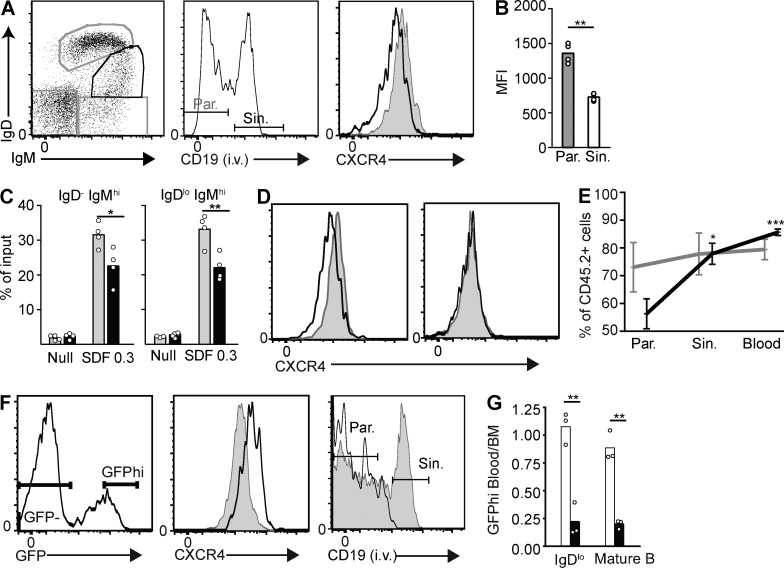
Figure 5.
CXCR4 expression in egress-competent immature B lymphocytes. (A) CXCR4 expression in B220 + immature IgM + IgD lo B cells positioned in BM parenchyma (Par.) and sinusoids (Sin.). (left) IgM and IgD ex...
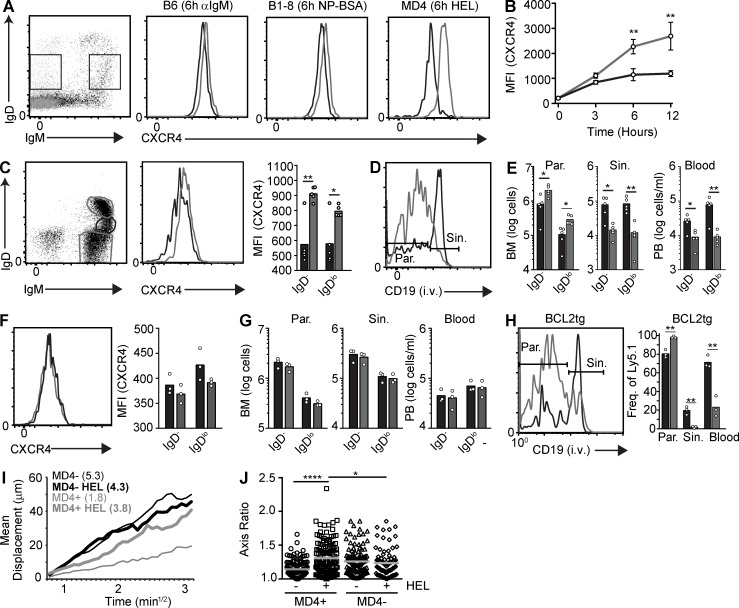
Figure 6.
BCR signaling increases CXCR4 expression, promotes B lymphocyte motility, and prevents BM egress. (A) IgM and IgD expression in unstimulated and BCR-stimulated B220 + cells (left and right gates, resp...
Figure images are served from the NIH/NLM PubMed Central Open Access Subset or Europe PMC; copyright remains with the publishers and authors.
💬 Discussion
0 commentsNo comments yet. Be the first to start a discussion!
Leave a Comment