Abstract
In budding yeast, asymmetric cell division yields a larger mother and a smaller daughter cell, which transcribe different genes due to the daughter-specific transcription factors Ace2 and Ash1. Cell size control at the Start checkpoint has long been considered to be a main regulator of the length of the G1 phase of the cell cycle, resulting in longer G1 in the smaller daughter cells. Our recent data confirmed this concept using quantitative time-lapse microscopy. However, it has been proposed that daughter-specific, Ace2-dependent repression of expression of the G1 cyclin CLN3 had a dominant role in delaying daughters in G1. We wanted to reconcile these two divergent perspectives on the origin of long daughter G1 times. We quantified size control using single-cell time-lapse imaging of fluorescently labeled budding yeast, in the presence or absence of the daughter-specific transcriptional regulators Ace2 and Ash1. Ace2 and Ash1 are not required for efficient size control, but they shift the domain of efficient size control to larger cell size, thus increasing cell size requirement for Start in daughters. Microarray and chromatin immunoprecipitation experiments show that Ace2 and Ash1 are direct transcriptional regulators of the G1 cyclin gene CLN3. Quantification of cell size control in cells expressing titrated levels of Cln3 from ectopic promoters, and from cells with mutated Ace2 and Ash1 sites in the CLN3 promoter, showed that regulation of CLN3 expression by Ace2 and Ash1 can account for the differential regulation of Start in response to cell size in mothers and daughters. We show how daughter-specific transcriptional programs can interact with intrinsic cell size control to differentially regulate Start in mother and daughter cells. This work demonstrates mechanistically how asymmetric localization of cell fate determinants results in cell-type-specific regulation of the cell cycle.
🔬 Techniques
🧬 Organisms
💻 Software
✨ Fluorophores
🧪 Sample Preparation
🏭 Microscope Brands
📷 Detectors
💻 Software Details
🏛️ Research Organizations (ROR)
Affiliated research institutions:
📋 Methods
Strain and Plasmid Construction
Standard methods were used throughout. All strains are W303-congenic. All integrated constructs were characterized by qPCR. Mutations of the Ace2/Swi5 and Ash1 binding sites on the CLN3 promoter were verified by sequencing.
Time-Lapse Microscopy
Preparation of cells for microscopy and time-lapse microscopy were performed as previously described [5] , [6] . Growth of microcolonies was observed with fluorescence time-lapse microscopy at 30°C using a Leica DMIRE2 inverted microscope with a Ludl motorized XY stage. Images were acquired every 3 min for cells grown in glucose and every 6 min for cells grown in glycerol/ethanol with a Hamamatsu Orca-ER camera. Custom Visual Basic software integrated with ImagePro Plus was used to automate image acquisition and microscope control.
Image Analysis
Automated image segmentation and fluorescence quantification of yeast grown under time-lapse conditions and semi-automated assignment of microcolony pedigrees were performed as previously described [6] . The nuclear residence of Whi5-GFP was scored by visual inspection of composite phase contrast-fluorescent movies. Cell size was measured as the total cell fluorescence from DsRed protein, expressed from the constitutively active ACT1pr , as previously described [5] . Cell size at every time point was extrapolated from a linear fit of the ln(M) as a function of time for cells grown in glucose and from a smoothing spline fit for cells grown in glycerol/ethanol. Individual cell growth in glycerol/ethanol appears to be intermediate between a linear and an exponential model (unpublished data); this deviation from exponentiality has very little effect on this analysis.
Show full methods section
Strain and Plasmid Construction
Standard methods were used throughout. All strains are W303-congenic. All integrated constructs were characterized by qPCR. Mutations of the Ace2/Swi5 and Ash1 binding sites on the CLN3 promoter were verified by sequencing.
Time-Lapse Microscopy
Preparation of cells for microscopy and time-lapse microscopy were performed as previously described [5] , [6] . Growth of microcolonies was observed with fluorescence time-lapse microscopy at 30°C using a Leica DMIRE2 inverted microscope with a Ludl motorized XY stage. Images were acquired every 3 min for cells grown in glucose and every 6 min for cells grown in glycerol/ethanol with a Hamamatsu Orca-ER camera. Custom Visual Basic software integrated with ImagePro Plus was used to automate image acquisition and microscope control.
Image Analysis
Automated image segmentation and fluorescence quantification of yeast grown under time-lapse conditions and semi-automated assignment of microcolony pedigrees were performed as previously described [6] . The nuclear residence of Whi5-GFP was scored by visual inspection of composite phase contrast-fluorescent movies. Cell size was measured as the total cell fluorescence from DsRed protein, expressed from the constitutively active ACT1pr , as previously described [5] . Cell size at every time point was extrapolated from a linear fit of the ln(M) as a function of time for cells grown in glucose and from a smoothing spline fit for cells grown in glycerol/ethanol. Individual cell growth in glycerol/ethanol appears to be intermediate between a linear and an exponential model (unpublished data); this deviation from exponentiality has very little effect on this analysis.
Data Analysis
Time-lapse fluorescence microscopy, microarray data, and sequencing data were analyzed with custom software written in MATLAB software (see Text S1 for details on the analysis of the microarray data) [5] . For cluster analysis, the log 2 of the arrays data or of the subtracted arrays data were hierarchically clustered by the agglomerative algorithm [41] . Data were visually presented using JavaTreeView. For sequencing data, the area associated to every wild-type or mutated nucleotide was evaluated manually by using the MATLAB software.
Cell Cycle Synchronization
YEP medium was used for all cell cycle synchronization experiments, supplemented with the appropriate carbon source as indicated below.
Cell cycle synchronization by the cdc20
GALL-CDC20 block release was achieved by growing cells to early log phase in YEP+galactose (3%), then filtering and growing them in YEP+glucose (2%) for 3 h to arrest cells in metaphase. Cells were released from the block by filtering back into YEP+galactose (3%). GALL is a truncated version of the GAL1 promoter that shows inducible but significantly lower expression than the full-length GAL1 promoter [37] . Microarrays Microarrays were performed as previously described [71] but using microarrays carrying PCR fragments from open reading frames of S. cerevisiae . Each array had each PCR fragment independently spotted four to eight times, leading to a high redundancy of data and small errors in expression ratios. RNA extraction, cDNA synthesis and labeling, and hybridization and scanning were carried out by the Stony Brook spotted microarray facility, as described previously [71] . ChIPs Standard methods were used for ChIP experiments. Early log phase cells were fixed for 15 min in 1% formaldehyde at room temperature. Immunoprecipitations were performed with IgG Sepharose beads. Immunoprecipitated DNA was amplified by PCR.
Supporting Information Dataset S1 Microarrays data of wild-type, ace2 , swi5 , and ace2 swi5 synchronized cell populations. (1.48 MB TXT) Click here for additional data file. Dataset S2 Microarrays data of wild-type, ace2 ash1 , ACE2* ASH1* , ace2 , ACE2* , ash1 , ASH1* synchronized cell populations. (2.42 MB TXT) Click here for additional data file. Figure S1 Hierarchical clustering analysis of genes regulated by Ace2 and Swi5. (9.90 MB TIF) Click here for additional data file. Figure S2 Ash1 is a modulator of Swi5-dependent expression. Average expression for Ace2/Swi5 and Swi5 targets (45 genes) in response to Ash1 (data were obtained by subtracting the ASH1* dataset from ash1 dataset). This graph shows that Ash1 weakly represses the expression of many Ace2/Swi5 and Swi5 targets in daughter cells. (0.87 MB TIF) Click here for additional data file. Figure S3 Activation of SBF and MBF is delayed by Ace2 and Ash1. Average expression of 20 SBF/MBF targets in (A) ace2 and ACE2* , (B) ash1 and ASH1* , (C) ace2 ash1 and ACE2* ASH1* cells. Distribution of cell size at birth after release from the cdc20 arrest for (D) ace2 ash1 and (E) ACE2* ASH1* cells. (1.48 MB TIF) Click here for additional data file. Figure S4 Deletion of ACE2 and ASH1 result in similar T 1 only in mothers and daughter of similar size. Histogram of the difference in T 1 for mother-daughter pairs in wild-type (A, B), ace2 (C, D), ash1 (E, F), and ace2 ash1 (G, H) cells. T 1 is longer in daughters for almost all mother-daughter pairs, indicating that symmetrical regulation of Start is restricted to mothers and daughters of similar size upon deletion of ACE2 and ASH1 . (1.98 MB TIF) Click here for additional data file. Figure S5 Symmetrical distribution of Ace2 and Ash1 result in similar T 1 only in mothers and daughter of similar size. Histogram of the difference in T 1 for mother-daughter pairs in wild-type (A, B), ACE2* (C, D), ASH1* (E, F), and ACE2* ASH1* (G, H) cells. T 1 is longer in daughters for almost all mother-daughter pairs, indicating that symmetrical regulation of Start is restricted to mothers and daughters of similar size. (2.07 MB TIF) Click here for additional data file. Figure S6 Deletion or symmetrical regulation of CLN3 result in similar T 1 only in mothers and daughter of similar size. Histogram of the difference in T 1 for mother-daughter pairs in wild-type (A, B), cln3 (C, D), 6xCDC28pr-CLN3 (E), 4xCDC28pr-CLN3 (F), and ADH1pr-CLN3 (G) cells. T 1 is longer in daughters for almost all mother-daughter pairs, indicating that symmetrical regulation of Start is restricted to mothers and daughters of similar size. (1.98 MB TIF) Click here for additional data file. Figure S7 Start control is similar in mothers and “pseudo-mothers.” Plot of αT 1 versus ln(M birth ) for the average “mother-like” (red dots and error bars, see Figure 3 ) compared to mothers and “pseudo-mothers” (black dots). (1.45 MB TIF) Click here for additional data file. Figure S8 Start control is similar in daughters and “pseudo-daughters.” Plot of αT 1 versus ln(M birth ) for the average “daughter-like” (blue dots and error bars, see Figure 3 ) compared to daughters and “pseudo-daughters” (black dots). (1.53 MB TIF) Click here for additional data file. Figure S9 Correlation between αT 1 and ln(M birth ) for cells grown in glucose in mutants lacking the Ace2/Swi5 and/or Ash1 sites on the CLN3 promoter. (A) wild-type, (B) Ace2/Swi5 sites mutated, (C) Ash1 sites mutated, (D) Ace2/Swi5 and Ash1 sites mutated. Red dots, mothers; blue dots, daughters. (1.21 MB TIF) Click here for additional data file. Figure S10 Ace2 nuclear residence is independent of cell size. Correlation between αT A2 , that is, the time of Ace2 nuclear residence scaled with growth rate α, and ln(M birth ) for wild-type daughter cells grown in glucose. Red line: least square fit, slope ≈−0.2. (0.46 MB TIF) Click here for additional data file. Figure S11 Phylogenetic analysis of Ace2/Swi5 putative binding sites on the CLN3 promoter. Ace2/Swi5 consensus-binding site identified by PhyloGibbs as over-represented motif in the promoter of the Ace2 and Swi5 targets. Conserved Ace2/Swi5 putative binding sites identified by PhyloGibbs. (0.72 MB TIF) Click here for additional data file. Table S1 Strains list. (0.10 MB PDF) Click here for additional data file. Table S2 Plasmids list. (0.06 MB PDF) Click here for additional data file. Table S3 Analysis of Ace2 and Ash1 shared targets. (0.06 MB PDF) Click here for additional data file. Table S4 Average daughter delay in new-born cells of the same size. (0.07 MB PDF) Click here for additional data file. Table S5 Size-independent noise is similar in daughters and pseudo-daughters. (0.06 MB PDF) Click here for additional data file. Table S6 Mutation of Ace2/Swi5 and Ash1 putative sites results in reduced binding of these factors to the CLN3 promoter. (0.07 MB PDF) Click here for additional data file. Text S1 Supplementary materials and methods and supplementary results. (0.13 MB PDF) Click here for additional data file.
📊 Figures
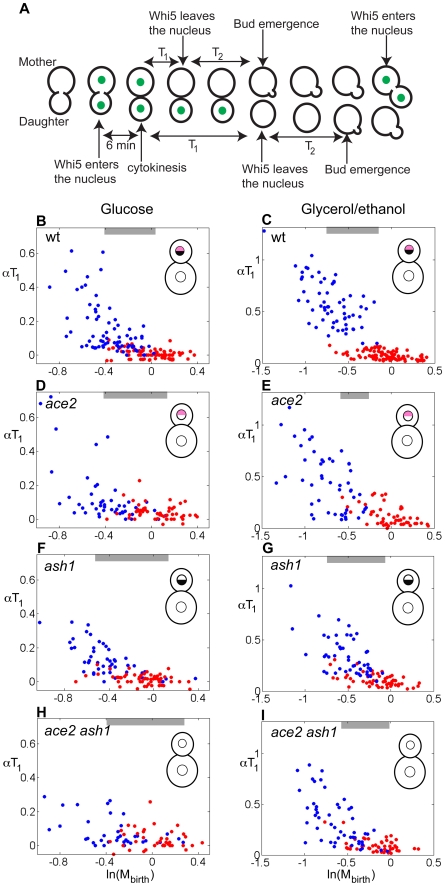
Figure 1
Differential regulation of Start is dependent on Ace2 and Ash1.
(A) Illustration of the separation of G1 into two intervals, T 1 and T 2 , by using Whi5-GFP. The total duration of G1 is T 1 +T 2 . (Bu2013H) Correlation between u03b1T 1 and ln(M birth ) for cells g...
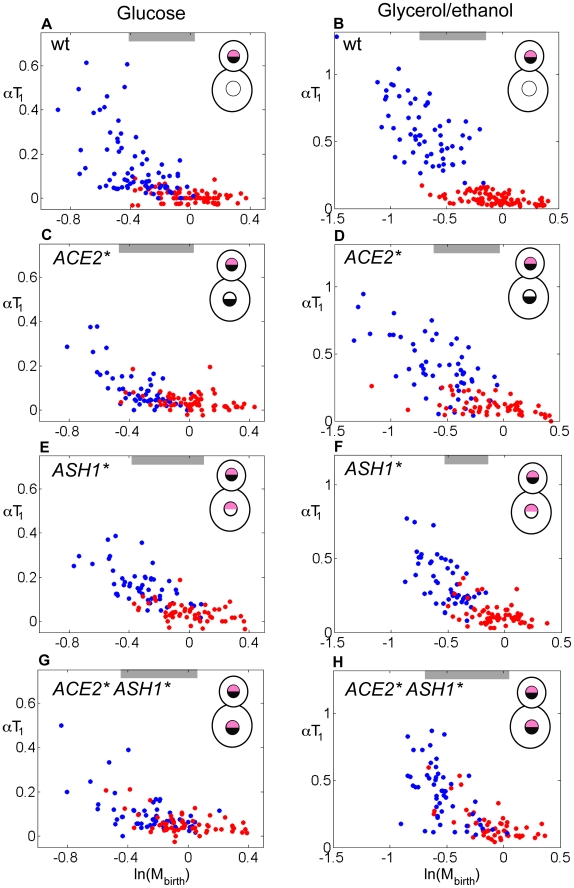
Figure 2
Symmetric localization of Ace2 and Ash1 result in symmetric control of Start in mothers and daughters.
(Au2013H) Correlation between u03b1T 1 and ln(M birth ) for cells grown in glucose or glycerol/ethanol. (Au2013B) wild-type, (Cu2013D) ACE2* , (Eu2013F) ASH1* , (Gu2013H) ACE2* ASH1* . Red dots, mothe...
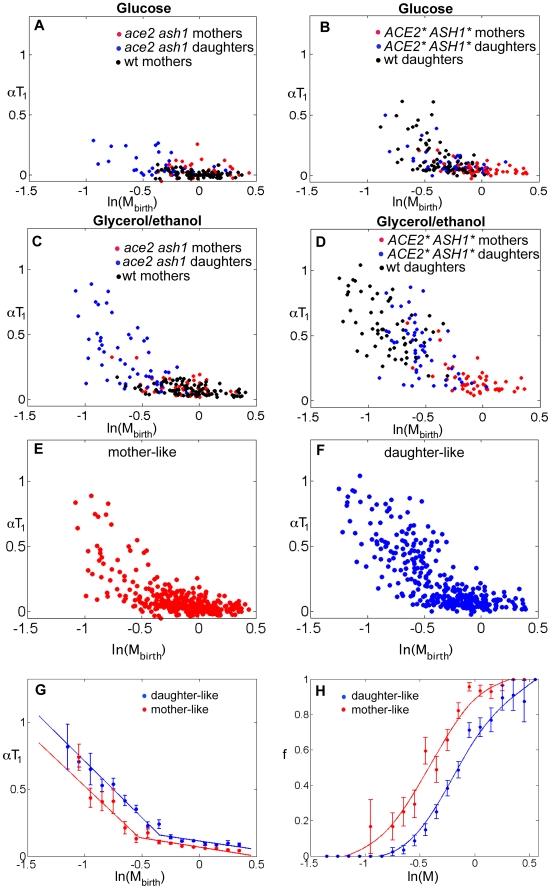
Figure 3
Daughter-specific localization of Ace2 and Ash1 results in asymmetric cell size control.
Correlation between u03b1T 1 and ln(M birth ) for mothers and u201cpseudo-mothersu201d (in (A) cells grown in glucose, in (C) cells grown in glycerol/ethanol) and daughters and u201cpseudo-daughtersu2...
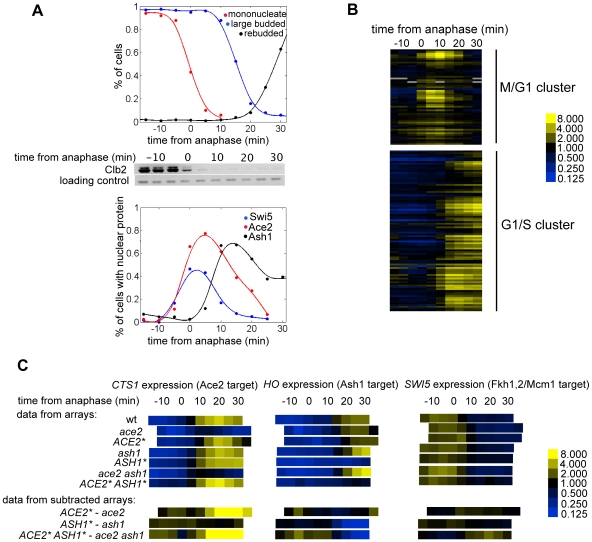
Figure 4
Genome-wide analysis of Ace2 and Ash1 targets.
(A) Analysis of cell cycle synchronization and nuclear localization of Ace2, Swi5, and Ash1 in a cdc20 block-release experiment. Top panel shows the percentage of mononucleate cells, large budded cell...
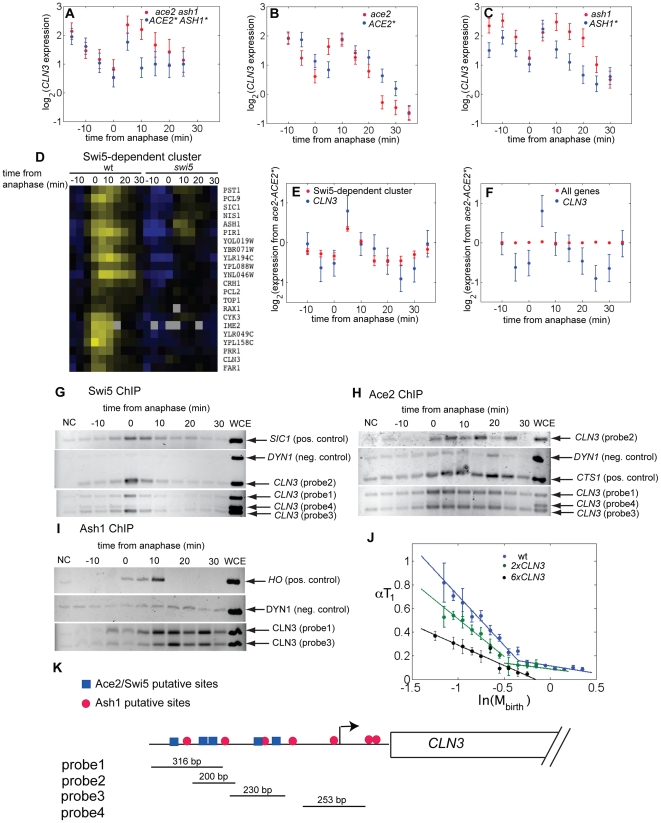
Figure 5
Ace2, Swi5, and Ash1 regulate the expression of the G1 cyclin CLN3 .
CLN3 expression: (A) ACE2* ASH1* versus ace2 ash1 , (B) ACE2* versus ace2 , (C) ASH1* versus ash1 . The error bars were estimated from the variability in expression of the large number of genes that a...
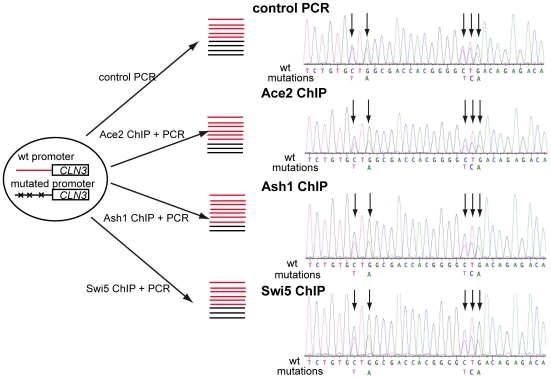
Figure 6
Binding of Ace2, Swi5, and Ash1 to the CLN3 promoter is reduced by mutation of the Ace2/Swi5 and Ash1 consensus-binding sites.
Experimental strategy to estimate the preferential binding of Ace2, Swi5, and Ash1 to their consensus-binding sites. Following ChIP, various regions of the CLN3 promoter were amplified by PCR and anal...
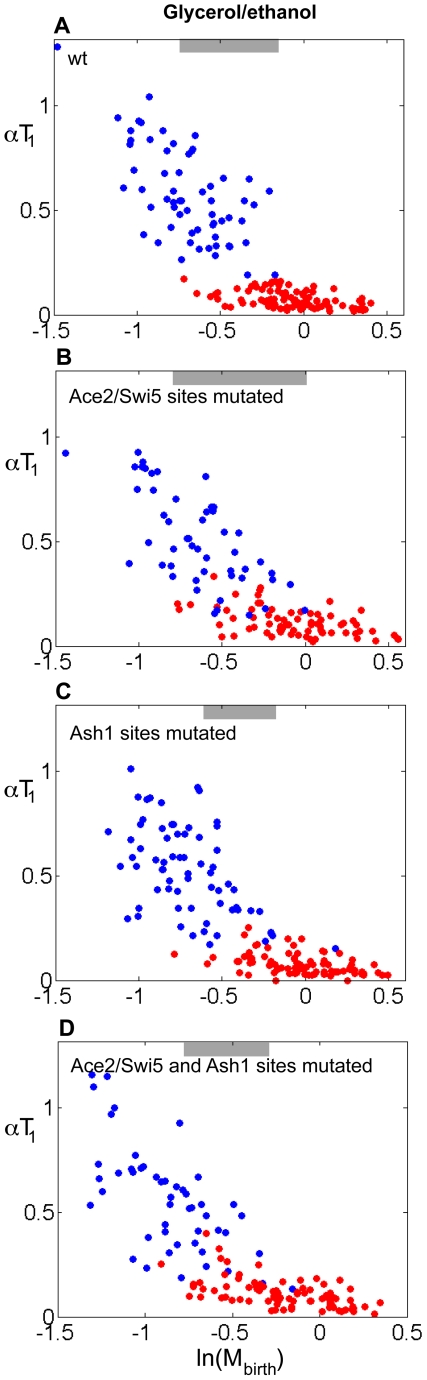
Figure 7
Mutation of the Ace2/Swi5 and Ash1 binding sites on the CLN3 promoter reduces the asymmetrical regulation of Start.
Correlation between u03b1T 1 and ln(M birth ) for cells grown in glycerol/ethanol in mutants lacking the Ace2/Swi5 and/or Ash1 sites on the CLN3 promoter. (A) wild-type, (B) Ace2/Swi5 sites mutated, (...
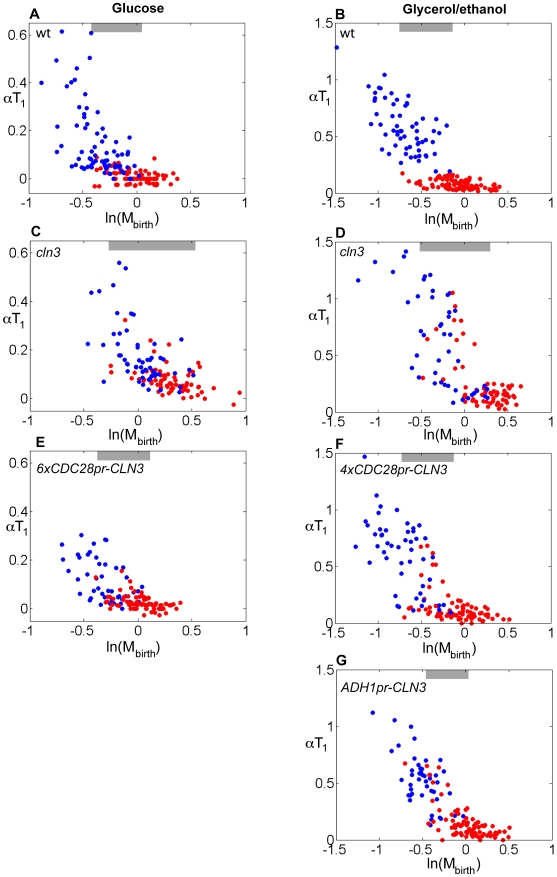
Figure 8
Symmetric regulation of CLN3 expression result in symmetric control of Start in mothers and daughters.
Correlation between u03b1T 1 and ln(M birth ) for cells grown in glucose or glycerol/ethanol. (Au2013B) wild-type, (Cu2013D) cln3 , (E) cln3 6xCDC28pr-CLN3 , (F) cln3 4xCDC28pr-CLN3 , (G) cln3 ADH1pr-...
Figure images are served from the NIH/NLM PubMed Central Open Access Subset or Europe PMC; copyright remains with the publishers and authors.
💬 Discussion
0 commentsNo comments yet. Be the first to start a discussion!
Leave a Comment