Abstract
Multiphoton micro-spectroscopy, employing diffraction optics and electron-multiplying CCD (EMCCD) cameras, is a suitable method for determining protein complex stoichiometry, quaternary structure, and spatial distribution in living cells using Förster resonance energy transfer (FRET) imaging. The method provides highly resolved spectra of molecules or molecular complexes at each image pixel, and it does so on a timescale shorter than that of molecular diffusion, which scrambles the spectral information. Acquisition of an entire spectrally resolved image, however, is slower than that of broad-bandwidth microscopes because it takes longer times to collect the same number of photons at each emission wavelength as in a broad bandwidth. Here, we demonstrate an optical micro-spectroscopic scheme that employs a laser beam shaped into a line to excite in parallel multiple sample voxels. The method presents dramatically increased sensitivity and/or acquisition speed and, at the same time, has excellent spatial and spectral resolution, similar to point-scan configurations. When applied to FRET imaging using an oligomeric FRET construct expressed in living cells and consisting of a FRET acceptor linked to three donors, the technique based on line-shaped excitation provides higher accuracy compared to the point-scan approach, and it reduces artifacts caused by photobleaching and other undesired photophysical effects.
🔬 Techniques
🧬 Organisms
✨ Fluorophores
📷 Detectors
🏛️ Research Organizations (ROR)
Affiliated research institutions:
📊 Figures
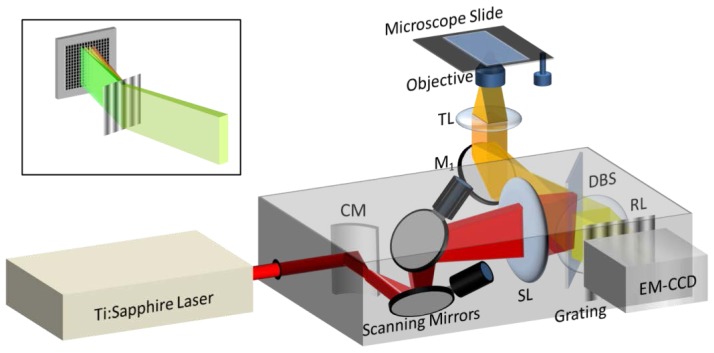
Figure 1.
(Color online) Two photon excitation microscope with high spatial and spectral resolution using the line-scan excitation method. Significance of acronyms: CM, cylindrical mirror; SL, scanning lens; M ...
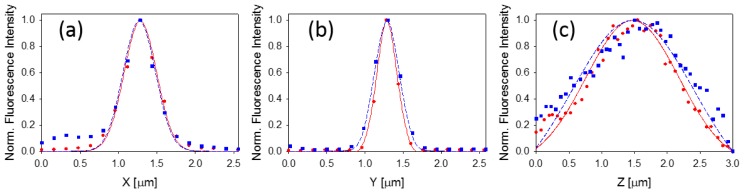
Figure 2.
Point spread function (PSF) cross-sections along ( a ) x ; ( b ) y ; and ( c ) z axes as measured by the line-scan excitation (red circles) and the point-scan excitation (blue squares). The solid (red...
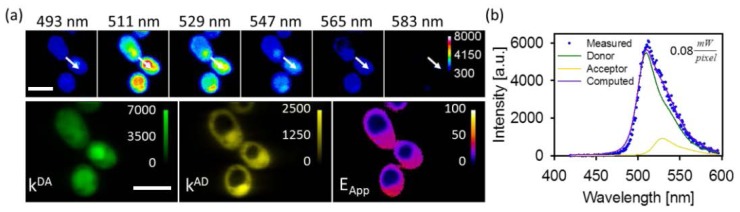
Figure 3.
Typical results obtained from yeast cells expressing a FRET construct (DDDA) as measured with the line-scan optical micro-spectroscopy systems. Images in the top row of panel ( a ) illustrate the fluo...
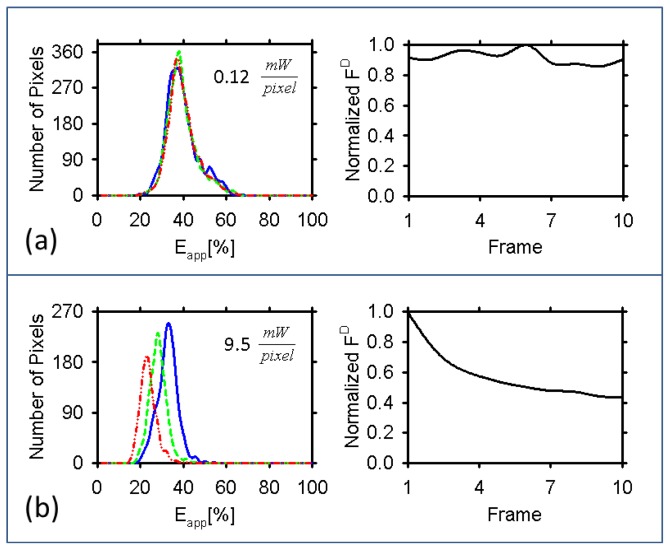
Figure 4.
E app histograms of a cell calculated from the FRET efficiency map as measured using the line-scan system ( a ) and the point scan system ( b ) after repeated scans of the sample along with the normal...
Figure images are served from the NIH/NLM PubMed Central Open Access Subset or Europe PMC; copyright remains with the publishers and authors.
💬 Discussion
0 commentsNo comments yet. Be the first to start a discussion!
Leave a Comment