Abstract
AbstractFluorescence labelling of an intracellular biomolecule in native living cells is a powerful strategy to achieve in-depth understanding of the biomolecule’s roles and functions. Besides being nontoxic and specific, desirable labelling probes should be highly cell permeable without nonspecific interactions with other cellular components to warrant high signal-to-noise ratio. While it is critical, rational design for such probes is tricky. Here we report the first predictive model for cell permeable background-free probe development through optimized lipophilicity, water solubility and charged van der Waals surface area. The model was developed by utilizing high-throughput screening in combination with cheminformatics. We demonstrate its reliability by developing CO-1 and AzG-1, a cyclooctyne- and azide-containing BODIPY probe, respectively, which specifically label intracellular target organelles and engineered proteins with minimum background. The results provide an efficient strategy for development of background-free probes, referred to as ‘tame’ probes, and novel tools for live cell intracellular imaging.
🔬 Techniques
🔭 Microscopes
🧬 Organisms
💻 Software
✨ Fluorophores
🧪 Sample Preparation
🔬 Cell Lines
🏭 Microscope Brands
🧪 Reagent Suppliers
🔎 Objectives
💻 Software Details
🏛️ Research Organizations (ROR)
Affiliated research institutions:
📋 Methods
Probes' synthesis and characterization
Details of synthesis and characterization of the probes used in this study can be found in the Supplementary Methods . General synthetic schemes and structures of the BODIPY libraries used in training set can be seen in Supplementary Figs 22 and 23 and Supplementary Tables 10 and 11 . For NMR spectra of CO-1, AzG-1 and CO-1H see Supplementary Figs 24–26 . Cellular retention and efflux characteristics test U-2 OS, a human osteosarcoma cell line, and CHO, a Chinese hamster ovary cell line, (from ATCC) were cultured in Dulbecco's modified eagle's medium (DMEM) (Invitrogen, CA, USA) supplemented with fetal bovine serum (FBS) (10%) and penicillin–streptomycin (1%). Materials used in the cell culture were purchased from Invitrogen. U-2 OS and CHO cells were seeded onto 96-well plate in growth media at 37 °C in the presence of 5% CO 2 and were then allowed to attach and grow to 70–80% confluence. Library probes were dissolved in dimethylsulfoxide (DMSO) to make the 1 mM solution, and stored in −20 °C. Before HTS experiment, the growth media was aspirated and replaced by 200 μl fresh growth media containing probes in final concentration of 1 μM and nuclei dye Hoechst 33342. Plates were incubated for 30 min at 37 °C then were imaged using ImageXpress Micro cellular imaging system (Molecular Device) with × 10 objective lens. Immediately after image acquisition, the cells were washed with fresh growth media, and transferred back to a 37 °C cell incubator for further incubation. After 10 min, cells were again imaged (AW image). The first imaging step allowed influx measurement of BW image , while the second imaging step allowed out-flux measurement of AW image. Images of two regions per well were acquired with DAPI, FITC, TRITC or Texas Red filter sets according to probes' excitation and emission wavelength. Experiment was performed in duplicate. Cellular retention and efflux characteristics test for other synthesized probes were also done by using the same protocol. RR calculation RR was computed to quantitatively estimate probes retained inside the cells AW. RR was calculated by: FI (AW) is the average fluorescence intensity AW and FI (BW) is the average fluorescence intensity BW. RR is a value ranging from 0 to 100, where higher the value, higher the nonspecific binding of the probes. Background correction was applied to each image to compensate the uneven background intensity, thus improving image segmentation and reducing calculation bias. Probes in which BW images having FI (BW) ≤200 were classified as N-group. Probes (FI (BW) >200) with rapid efflux were observed to have a RR of 5% were classified into H-group. Molecular descriptor for library training set Chemical Computing Group (CCG) MOE 2011 software package was used for generating 3D structure and molecular descriptors for each probe. Hydrogens and lone-pair electrons were adjusted as required. Partial charge was set and protonation state was corrected for each structure. The active 3D conformation of the libraries was then acquired through energy minimization by Hamiltonian AM1 method. A total of 327 molecular descriptors were generated including topological, molecular connectivity, electrotopological geometric and quantum chemical descriptors. Significance test-based feature selection STFS analysis was done using SPSS v.13.0.1 software package (SPSS Inc., Chicago, IL). η 2 -test was calculated by: where η 2 is eta squared, χ 2 is chi square value and N is sample size. PCA was performed using the same software. In PCA, each of the descriptors and probes were processed and their factors of correlation were extracted. Cell maintenance and preparation for cell labelling The reagents Hoechst 33342 (1:5000, H1399), MitoTracker Deep Red FM (referred to as MitoTracker Red), BODIPY TR ceramide and LysoTracker Red were purchased from Life Technologies (Carlsbad, CA, USA). A stock solution of CO-1, CO-1H, TPP-Az, Morph-Az, Hoechst 33342, MitoTracker Red, and LysoTracker Red were first prepared in DMSO. The fluorescence excitation and emission spectra were measured using a SpectraMax M2 plate reader (Molecular devices Corp, USA). U-2 OS cells were cultured at 37 °C with 5% CO 2 in DMEM supplemented with 10% (v/v) FBS, penicillin (100 units per ml) and streptomycin (100 mg ml −1 ). Cells were passaged two to three times a week, seeded at a density of 75,000 cells per cm into 35-mm glass bottom dishes, and grown in DMEM media overnight before labelling. Sphingo-Az stock solution preparation BODIPY TR ceramide were prepared according to manufacturer protocol. Sphingo-Az was prepared as a form of complex with BSA similar to the preparation of BODIPY TR ceramide. Solid Sphingo-Az was dissolved in chloroform:ethanol (19:1 v/v) to give 50 μl of 1 mM stock solution. The stock solution was dried and redissolved in 200 μl 100% ethanol. This solution was then added to 10 ml of HBBS/BSA solution (HBSS+10 mM HEPES pH 7.4+0.34 mg ml −1 of defatted BSA) on a vortex mixer to give 5 μM Sphingo-Az/5 μM BSA stock solution. This solution can then be stored at −20 °C. Mitochondria imaging in live cells U-2 OS cells were treated with 5 μM TPP-Az, in culture media for 2 h at 37 °C. After incubation, cells were washed and added with 2 μM CO-1 probe. Labelling was allowed to proceed for 1 h at 37 °C in the incubator chamber. Following incubation, cells were treated with nuclei dye Hoechst 33342 (1 μg μl −1 ) and MitoTracker Red (1 μM). After counterstaining, cells were washed three times with growth media and imaged using Nikon A1R+ confocal laser microscope system. Lysosome imaging in live cells U-2 OS cells were treated with 5 μM Morph-Az, in culture media for 1 h at 37 °C. After incubation, cells were washed and added with 2 μM CO-1 probe then proceed for 1 h incubation at 37 °C. Following incubation, cells were treated with nuclei dye Hoechst 33342 (1 μg μl −1 ) and LysoTracker Red (1 μM). After counterstaining, cells were washed three times with growth media and imaged using Nikon A1R+ confocal laser microscope system. Golgi apparatus imaging in live cells U-2 OS cells were treated with 5 μM Sphingo-Az/BSA and 5 μM BODIPY TR ceramide/BSA in HBSS/HEPES for 30 min at 4 °C. Afterwards, cells were washed with cold growth media and further incubated for 30 min at 37 °C. After incubation, cells were washed and incubated with 2 μM CO-1 in culture media for 1 h at 37 °C. Following incubation, cells were treated with nuclei dye Hoechst 33342 (1 μg μl −1 ). After counterstaining, cells were washed three times with growth media and imaged using Nikon A1R+ confocal laser microscope system.
Show full methods section
Probes' synthesis and characterization
Details of synthesis and characterization of the probes used in this study can be found in the Supplementary Methods . General synthetic schemes and structures of the BODIPY libraries used in training set can be seen in Supplementary Figs 22 and 23 and Supplementary Tables 10 and 11 . For NMR spectra of CO-1, AzG-1 and CO-1H see Supplementary Figs 24–26 . Cellular retention and efflux characteristics test U-2 OS, a human osteosarcoma cell line, and CHO, a Chinese hamster ovary cell line, (from ATCC) were cultured in Dulbecco's modified eagle's medium (DMEM) (Invitrogen, CA, USA) supplemented with fetal bovine serum (FBS) (10%) and penicillin–streptomycin (1%). Materials used in the cell culture were purchased from Invitrogen. U-2 OS and CHO cells were seeded onto 96-well plate in growth media at 37 °C in the presence of 5% CO 2 and were then allowed to attach and grow to 70–80% confluence. Library probes were dissolved in dimethylsulfoxide (DMSO) to make the 1 mM solution, and stored in −20 °C. Before HTS experiment, the growth media was aspirated and replaced by 200 μl fresh growth media containing probes in final concentration of 1 μM and nuclei dye Hoechst 33342. Plates were incubated for 30 min at 37 °C then were imaged using ImageXpress Micro cellular imaging system (Molecular Device) with × 10 objective lens. Immediately after image acquisition, the cells were washed with fresh growth media, and transferred back to a 37 °C cell incubator for further incubation. After 10 min, cells were again imaged (AW image). The first imaging step allowed influx measurement of BW image , while the second imaging step allowed out-flux measurement of AW image. Images of two regions per well were acquired with DAPI, FITC, TRITC or Texas Red filter sets according to probes' excitation and emission wavelength. Experiment was performed in duplicate. Cellular retention and efflux characteristics test for other synthesized probes were also done by using the same protocol. RR calculation RR was computed to quantitatively estimate probes retained inside the cells AW. RR was calculated by: FI (AW) is the average fluorescence intensity AW and FI (BW) is the average fluorescence intensity BW. RR is a value ranging from 0 to 100, where higher the value, higher the nonspecific binding of the probes. Background correction was applied to each image to compensate the uneven background intensity, thus improving image segmentation and reducing calculation bias. Probes in which BW images having FI (BW) ≤200 were classified as N-group. Probes (FI (BW) >200) with rapid efflux were observed to have a RR of 5% were classified into H-group. Molecular descriptor for library training set Chemical Computing Group (CCG) MOE 2011 software package was used for generating 3D structure and molecular descriptors for each probe. Hydrogens and lone-pair electrons were adjusted as required. Partial charge was set and protonation state was corrected for each structure. The active 3D conformation of the libraries was then acquired through energy minimization by Hamiltonian AM1 method. A total of 327 molecular descriptors were generated including topological, molecular connectivity, electrotopological geometric and quantum chemical descriptors. Significance test-based feature selection STFS analysis was done using SPSS v.13.0.1 software package (SPSS Inc., Chicago, IL). η 2 -test was calculated by: where η 2 is eta squared, χ 2 is chi square value and N is sample size. PCA was performed using the same software. In PCA, each of the descriptors and probes were processed and their factors of correlation were extracted. Cell maintenance and preparation for cell labelling The reagents Hoechst 33342 (1:5000, H1399), MitoTracker Deep Red FM (referred to as MitoTracker Red), BODIPY TR ceramide and LysoTracker Red were purchased from Life Technologies (Carlsbad, CA, USA). A stock solution of CO-1, CO-1H, TPP-Az, Morph-Az, Hoechst 33342, MitoTracker Red, and LysoTracker Red were first prepared in DMSO. The fluorescence excitation and emission spectra were measured using a SpectraMax M2 plate reader (Molecular devices Corp, USA). U-2 OS cells were cultured at 37 °C with 5% CO 2 in DMEM supplemented with 10% (v/v) FBS, penicillin (100 units per ml) and streptomycin (100 mg ml −1 ). Cells were passaged two to three times a week, seeded at a density of 75,000 cells per cm into 35-mm glass bottom dishes, and grown in DMEM media overnight before labelling. Sphingo-Az stock solution preparation BODIPY TR ceramide were prepared according to manufacturer protocol. Sphingo-Az was prepared as a form of complex with BSA similar to the preparation of BODIPY TR ceramide. Solid Sphingo-Az was dissolved in chloroform:ethanol (19:1 v/v) to give 50 μl of 1 mM stock solution. The stock solution was dried and redissolved in 200 μl 100% ethanol. This solution was then added to 10 ml of HBBS/BSA solution (HBSS+10 mM HEPES pH 7.4+0.34 mg ml −1 of defatted BSA) on a vortex mixer to give 5 μM Sphingo-Az/5 μM BSA stock solution. This solution can then be stored at −20 °C. Mitochondria imaging in live cells U-2 OS cells were treated with 5 μM TPP-Az, in culture media for 2 h at 37 °C. After incubation, cells were washed and added with 2 μM CO-1 probe. Labelling was allowed to proceed for 1 h at 37 °C in the incubator chamber. Following incubation, cells were treated with nuclei dye Hoechst 33342 (1 μg μl −1 ) and MitoTracker Red (1 μM). After counterstaining, cells were washed three times with growth media and imaged using Nikon A1R+ confocal laser microscope system. Lysosome imaging in live cells U-2 OS cells were treated with 5 μM Morph-Az, in culture media for 1 h at 37 °C. After incubation, cells were washed and added with 2 μM CO-1 probe then proceed for 1 h incubation at 37 °C. Following incubation, cells were treated with nuclei dye Hoechst 33342 (1 μg μl −1 ) and LysoTracker Red (1 μM). After counterstaining, cells were washed three times with growth media and imaged using Nikon A1R+ confocal laser microscope system. Golgi apparatus imaging in live cells U-2 OS cells were treated with 5 μM Sphingo-Az/BSA and 5 μM BODIPY TR ceramide/BSA in HBSS/HEPES for 30 min at 4 °C. Afterwards, cells were washed with cold growth media and further incubated for 30 min at 37 °C. After incubation, cells were washed and incubated with 2 μM CO-1 in culture media for 1 h at 37 °C. Following incubation, cells were treated with nuclei dye Hoechst 33342 (1 μg μl −1 ). After counterstaining, cells were washed three times with growth media and imaged using Nikon A1R+ confocal laser microscope system.
A1R+ confocal microscopes
Confocal imaging experiments were performed on an inverted Nikon A1R+ confocal laser microscope system using 562/672/405 nm lasers with Plan Apo TIRF 100X DiC oil H H2 objectives (Nikon Instruments, Inc., Japan). Image processing and overlay analysis were performed using NIS Elements 3.10 software (Nikon Instruments, Inc.).
Molecular cloning for histone H2B labelling
Plasmids were cloned in DH10β Escherichia coli strain and confirmed by DNA sequencing. PfuTurbo (Stratagene, La Jolla, CA) was used for QuikChange reactions and Phusion (Finnzymes, Finland) for gene amplification. Primers were synthesized by ValueGene (San Diego, CA), and restriction enzymes were purchased from New England Biolabs (Ipswich, MA). Wild-type mKate2 was cloned into pmTagRFP-T-H2B-6 plasmid using the Age I and Not I sites. The amber stop codon UAG was introduced at site 16 of mKate2 to make the plasmid pmH2B-6-mKate2-16tag. Newly synthesized histone H2B imaging in live cells U-2 OS cells were transfected with 1 μg DNA of each plasmid using Lipofectamine2000 in 35 mm glass bottom dishes according to the manufacturer protocol. Azi (purchased from Bachem) was added 1 h before transfection at a final concentration of 0.5 mM. Plasmid pIre-Azi3 (expressing the orthogonal amber suppressor transfer RNA (tRNA) and the E2AziRS specific for Azi) was co-transfected with plasmid pmH2B-6-mKate2-16tag in a 1:1 molar ratio. After 24 h, cells were washed three times with culture medium (DMEM with 10% FBS) (15 min each time). Growth media containing 10 μM CO-1 was then added to the dishes, and cells were incubated at 37 °C for 90 min followed by 4 times washing with growth media (30 min each time). Laser scanning confocal microscopy (Zeiss LSM 700) was used for imaging. The same conditions and settings were used for imaging control and experimental cells.
Plasmid construction for site-specific
CoK incorporation Cyclooctyne-containing UAA, N-ɛ-(cyclooct-2-yn-1-yloxy)carbonyl)L-lysine (CoK) was selected for copper-free labelling of proteins to avoid the use of cytotoxic metals. To this end, cyclooctynyl lysine, CoK was synthesized according to the previous report 29 . For genetic incorporation of CoK, an engineered orthogonal tRNA Pyl /CoKRS pair was constructed as reported before 29 . To express proteins installed with CoK at a designated position in mammalian cells, plasmids expressing the tRNA Pyl /CoKRS pair and target protein(s) were constructed in the following way. CoKRS carrying C-terminal haemaglutinin (HA) tag is expressed under the control of EF-1α promoter (derived from pEFIRES vector, Clonetech) and tRNA under the control of human U6 promoter and the CMV enhancer. CoKRS and tRNA expression cassettes were cloned using Kpn I /Not I, and BamH I /Asc I sites of pCDNA3 vector (Invitrogen) respectively, generating plasmid pCoKRS-tRNA. For live cell labelling experiments, α-tubulin was used as a model protein. An amber stop codon was inserted into position 26 of α-tubulin and the resulting tubulin-26TAG under the control of EF-1α promoter was cloned between Kpn I and Not I of pCDNA3, generating plasmid pTub-26TAG. Plasmids pTubwt and pEGFP-Tubwt carrying α-tubulin wild type and EGFP-fused α-tubulin, respectively, were also constructed in a similar way for control experiments. To validate genetic incorporation of CoK using tRNA pyl /CoKRS pair, plasmids pEGFP-Tub-26TAG (carrying EGFP-fused α-tubulin with C-terminal FLAG tag and stop codon TAG at 26) and pEGFP-39TAG (carrying EGFP with stop codon TAG at 39) were constructed for Western blotting and fluorescence microcopy analysis. Protein labelling on live cells using CoK CHO-K1 or HeLa cells were grown in DMEM-low glucose 1 g l −1 (Gibco) supplemented with 10% FBS (Gibco) in eight-well plate (ibid). At 70∼80% confluency, cells were transfected using 4 μl iN-fect in vitro transfection reagent with 100 ng pCoKRS-tRNA and 900 ng pTub-26TAG or with 900 ng pTubwt. After 6 h of incubation, media was replaced with fresh media (DMEM-low glucose medium with 10% FBS, 1% Pen-Strep, 2 Mm L -glutamate) containing 0.25 Mm CoK. After an additional 36 h, media was exchanged with normal growth media without CoK and cells were incubated for 2 h and washed (four times) to remove remaining CoK. Next, growth media containing 1 μM AzG-1 was added to the plates, and cells were incubated for 2 h with four times of washing (30 min each time) using growth media. High-resolution images of live cells were obtained using a Zeiss LSM510 META laser scanning confocal microscope.
Western blotting
To demonstrate site-specific incorporation of CoK into α-tubulin, HEK293T cells were co-transfected with plasmids pCokRS-tRNA and pEGFP-Tub-26TAG at 80–90% confluency and cultured in the presence or absence of 0.5 mM CoK for 36 h. The cells were harvested and subjected to Western blot analysis using anti-HA antibody (Abcam) and anti-FLAG antibody (Agilent) for the detection of HA-tagged CoKRS expression and FLAG-tagged EGFP-α-tubulin expression, respectively.
Cell viability assay
Cell viability was assessed using MTS assay kit (Promega). 1 × 10 5 U-2 OS cells were seeded on 10 mm culture dishes; cells were stained with or without CO-1 (0–10 M) for 1–16 h. After incubation, the MTS reagent was added and incubated for 4 h at 37 °C. Absorbance was determined at 490 nm using SpectraMax M2 plate reader. Photostability measurements 10 μM of CO-1 solution in PBS buffer (pH 7.4) containing 1% DMSO were placed in a 96-well plates. Fluorescence measurement were recorded every 30 s interval for a total period of 12 h (Ex/Em=490/520) under a xenon flashlamp. For harsh condition experiment, photostability test was done under high intensity UV lamp (Blak Ray, 100 W, 365 nm). Plates were irradiated for 10 min up to 2.5 h at 10 cm distance.
Data availability
The data that support the findings of this study are available from the corresponding authors on request.
Supplementary Material Supplementary Information Supplementary Figures 1-26, Supplementary Tables 1-11, Supplementary Methods and Supplementary References
📊 Figures
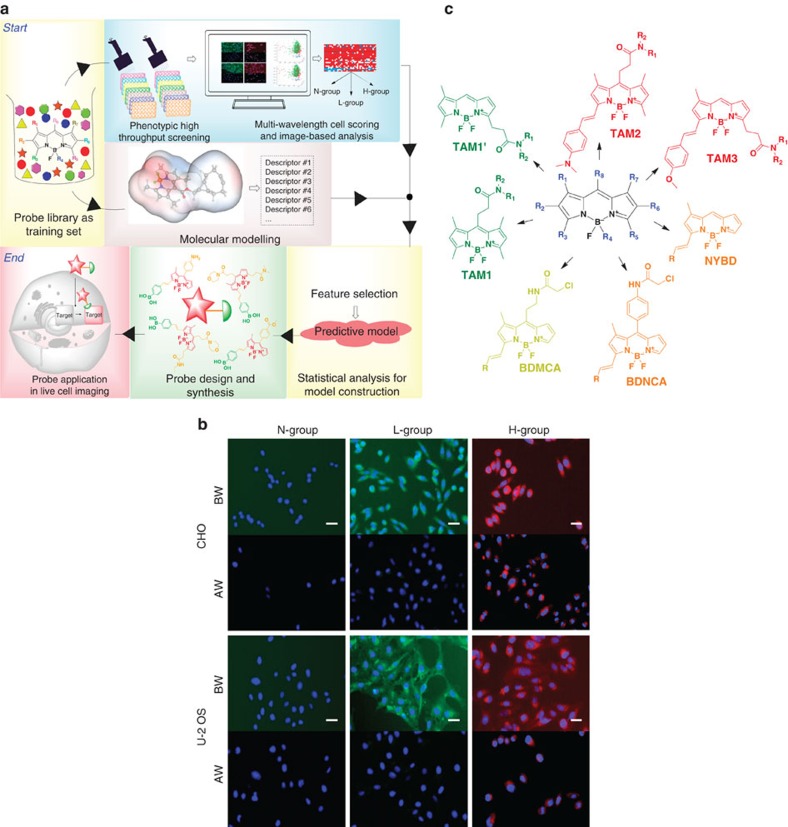
Figure 1
Experimental set and probes' cellular responses.
( a ) Flowchart of the overall experimental strategy. ( b ) Representative cellular responses in CHO and U-2 OS. Cells were stained with probes at 1u2009u03bcM final concentration. The overlayed image...
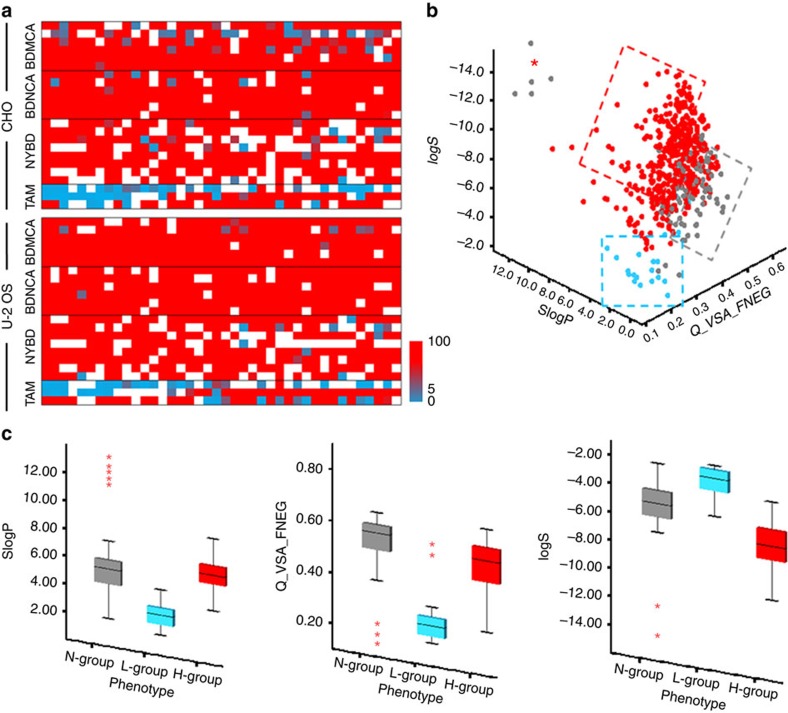
Figure 2
Predictive model.
( a ) Heat maps of RR for each library in U-2 OS and CHO cell lines. White colour represents probes in N-group. The red and torquise colour represents high and low RR, respectively. ( b ) Three dimens...
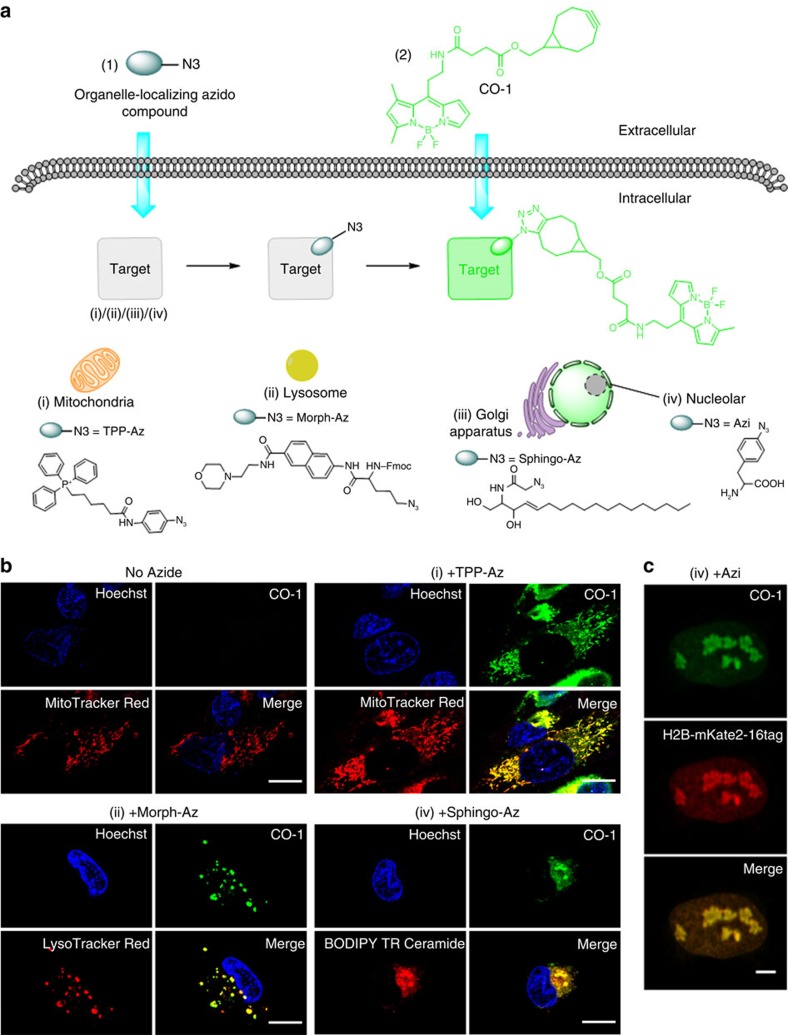
Figure 3
Live cell imaging with CO-1.
( a ) Chemical structures and schematic illustration of the covalent labelling of azide-tagged organelles using CO-1 in live cells. ( b ) Fluorescence imaging of mitochondria, lysosome and golgi appar...
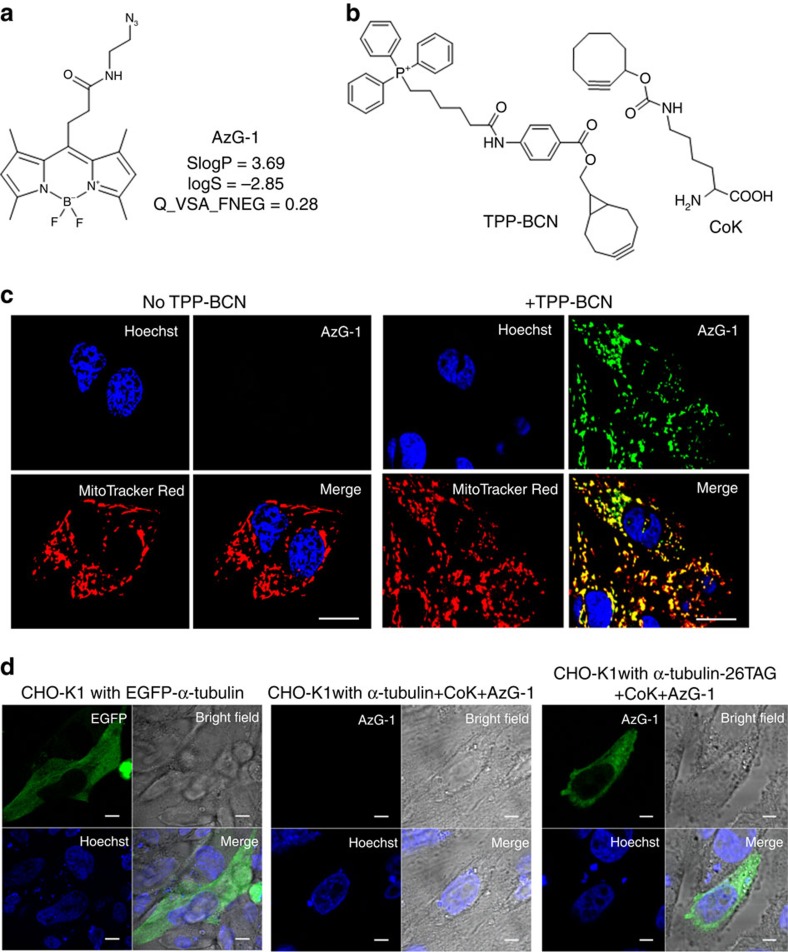
Figure 4
Live cell imaging with AzG-1
( a ) Chemical structures of azide-bearing probe AzG-1 and its descriptor values. ( b ) Structure of triphenylphosphonium analogues TPP-BCN and cyclooctyne-containing unnatural amino acid, CoK. ( c ) ...
Figure images are served from the NIH/NLM PubMed Central Open Access Subset or Europe PMC; copyright remains with the publishers and authors.
💬 Discussion
0 commentsNo comments yet. Be the first to start a discussion!
Leave a Comment