Abstract
Intracortical neural probes enable researchers to measure electrical and chemical signals in the brain. However, penetration injury from probe insertion into living brain tissue leads to an inflammatory tissue response. In turn, microglia are activated, which leads to encapsulation of the probe and release of pro-inflammatory cytokines. This inflammatory tissue response alters the electrical and chemical microenvironment surrounding the implanted probe, which may in turn interfere with signal acquisition. Dexamethasone (Dex), a potent anti-inflammatory steroid, can be used to prevent and diminish tissue disruptions caused by probe implantation. Herein, we report retrodialysis administration of dexamethasone while using in vivo two-photon microscopy to observe real-time microglial reaction to the implanted probe. Microdialysis probes under artificial cerebrospinal fluid (aCSF) perfusion with or without Dex were implanted into the cortex of transgenic mice that express GFP in microglia under the CX3CR1 promoter and imaged for 6 h. Acute morphological changes in microglia were evident around the microdialysis probe. The radius of microglia activation was 177.1 μm with aCSF control compared to 93.0 μm with Dex perfusion. T-stage morphology and microglia directionality indices were also used to quantify the microglial response to implanted probes as a function of distance. Dexamethasone had a profound effect on the microglia morphology and reduced the acute activation of these cells.
🔬 Techniques
💻 Software
✨ Fluorophores
🧪 Sample Preparation
🔬 Cell Lines
🏭 Microscope Brands
🧪 Reagent Suppliers
🔴 Lasers
💻 Software Details
🏛️ Research Organizations (ROR)
Affiliated research institutions:
📋 Methods
Microdialysis Probe and Perfusion Preparation
Vertical concentric microdialysis probes (300 μm o.d., 4mm in length) were constructed with a hollow fiber dialysis membrane (Spectra-Por RC Hollow Fiber; MWCO: 13,000 Da, 300 μm o.d., 160 μm i.d., Spectrum Laboratories, Inc.; Rancho Dominguez, CA) and fused silica outlet lines (150 μm o.d., 75 μm i.d., Polymicro Technologies; Phoenix, AZ) as described elsewhere [ 83 ]. Artificial cerebrospinal fluid (aCSF: 142 mM NaCl, 1.2 mM CaCl 2 , 2.7 mM KCl, 1.0 mM MgCl 2 , 2.0 mM NaH 2 PO 4 , pH 7.4) was the perfusion fluid in control experiments. Dexamethasone sodium phosphate (Dex, APP Pharmaceuticals LLC Schaumburg, Il) was diluted in aCSF to 10 μM.
Surgery
Microdialysis probes were bilaterally implanted in cortex area V1/V2 of ten transgenic mice that express green fluorescent protein (GFP) in brain microglia under the direction of the CX3CR1 promoter (CX3CR1-GFP). CX3CR1-GFP mice were obtained from Jackson Laboratories (Bar Harbor, ME) and weighed 25–30 g. These animals were prepared for cortical implants using previously established methods [ 30 , 33 ]. Briefly, the animals were anesthetized with a mixture of 90 mg kg−1 ketamine and 9mg kg−1 xylazine administered intraperitoneally (IP) with regular updates of 17.5 mg kg−1 every hour or as needed. The depth of anesthesia was monitored by tracking heart rate. After the animal was placed in a stereotaxic frame, the skin and connective tissue on the surface of the skull was removed. A thin layer of Vetbond (3M) was placed over the skull and a 1–1.5 mm tall well was constructed around the edges of the skull using dental cement. A 4 mm by 6 mm craniotomy was made by thinning the skull over the somatosensory and visual cortex using a high-speed dental drill and then removed with forceps. The skull was periodically bathed in saline to ensure that the underlying cortex did not experience thermal damage from drilling. Care was taken to prevent vascular damage during drilling and the removal of the bone. All experimental protocols were approved by the University of Pittsburgh, Division of Laboratory Animal Resources and Institutional Animal Care and Use Committee in accordance with the standards for humane animal care as set by the Animal Welfare Act and the National Institutes of Health Guide for the Care and Use of Laboratory Animals. Probe Insertion The microdialysis probes were aligned with a stereotaxic manipulator over the visual cortex at a 30° angle. Prior to insertion, probes were continuously perfused with artificial cerebrospinal fluid (aCSF: 144 mM Na + , 1.2 mM Ca 2+ , 2.7 mM K + , 152 mM Cl − , 1.0 mM Mg 2+ , and 2.0 M PO 4 3− adjusted to pH 7.4 with NaOH) or 10 μM Dexamethasone in aCSF at 0.610 μL/min until the conclusion of the experiment. Flow was confirmed by visual inspection of droplets forming at the outlet line but samples were not collected for analysis. Probes were inserted using a z-axis automated microdrive (MO-81, Narishige, Japan) at 200 μm s−1 for 2700 μm, then retracted 300 μm. Probes were then fixed into position using a blue-light curing dental cement. Then, prior to imaging, 0.1 cc of 1 mg ml−1 sulforhodamine101 (SR101, S-359, Invitrogen, Carlsbad, CA) was injected IV as an optical vascular label (red), and then 0.05 mg ml−1 SR101 was administered IP periodically as needed as the blood vessels became faintly labeled.
Show full methods section
Microdialysis Probe and Perfusion Preparation
Vertical concentric microdialysis probes (300 μm o.d., 4mm in length) were constructed with a hollow fiber dialysis membrane (Spectra-Por RC Hollow Fiber; MWCO: 13,000 Da, 300 μm o.d., 160 μm i.d., Spectrum Laboratories, Inc.; Rancho Dominguez, CA) and fused silica outlet lines (150 μm o.d., 75 μm i.d., Polymicro Technologies; Phoenix, AZ) as described elsewhere [ 83 ]. Artificial cerebrospinal fluid (aCSF: 142 mM NaCl, 1.2 mM CaCl 2 , 2.7 mM KCl, 1.0 mM MgCl 2 , 2.0 mM NaH 2 PO 4 , pH 7.4) was the perfusion fluid in control experiments. Dexamethasone sodium phosphate (Dex, APP Pharmaceuticals LLC Schaumburg, Il) was diluted in aCSF to 10 μM.
Surgery
Microdialysis probes were bilaterally implanted in cortex area V1/V2 of ten transgenic mice that express green fluorescent protein (GFP) in brain microglia under the direction of the CX3CR1 promoter (CX3CR1-GFP). CX3CR1-GFP mice were obtained from Jackson Laboratories (Bar Harbor, ME) and weighed 25–30 g. These animals were prepared for cortical implants using previously established methods [ 30 , 33 ]. Briefly, the animals were anesthetized with a mixture of 90 mg kg−1 ketamine and 9mg kg−1 xylazine administered intraperitoneally (IP) with regular updates of 17.5 mg kg−1 every hour or as needed. The depth of anesthesia was monitored by tracking heart rate. After the animal was placed in a stereotaxic frame, the skin and connective tissue on the surface of the skull was removed. A thin layer of Vetbond (3M) was placed over the skull and a 1–1.5 mm tall well was constructed around the edges of the skull using dental cement. A 4 mm by 6 mm craniotomy was made by thinning the skull over the somatosensory and visual cortex using a high-speed dental drill and then removed with forceps. The skull was periodically bathed in saline to ensure that the underlying cortex did not experience thermal damage from drilling. Care was taken to prevent vascular damage during drilling and the removal of the bone. All experimental protocols were approved by the University of Pittsburgh, Division of Laboratory Animal Resources and Institutional Animal Care and Use Committee in accordance with the standards for humane animal care as set by the Animal Welfare Act and the National Institutes of Health Guide for the Care and Use of Laboratory Animals. Probe Insertion The microdialysis probes were aligned with a stereotaxic manipulator over the visual cortex at a 30° angle. Prior to insertion, probes were continuously perfused with artificial cerebrospinal fluid (aCSF: 144 mM Na + , 1.2 mM Ca 2+ , 2.7 mM K + , 152 mM Cl − , 1.0 mM Mg 2+ , and 2.0 M PO 4 3− adjusted to pH 7.4 with NaOH) or 10 μM Dexamethasone in aCSF at 0.610 μL/min until the conclusion of the experiment. Flow was confirmed by visual inspection of droplets forming at the outlet line but samples were not collected for analysis. Probes were inserted using a z-axis automated microdrive (MO-81, Narishige, Japan) at 200 μm s−1 for 2700 μm, then retracted 300 μm. Probes were then fixed into position using a blue-light curing dental cement. Then, prior to imaging, 0.1 cc of 1 mg ml−1 sulforhodamine101 (SR101, S-359, Invitrogen, Carlsbad, CA) was injected IV as an optical vascular label (red), and then 0.05 mg ml−1 SR101 was administered IP periodically as needed as the blood vessels became faintly labeled.
Two-photon imaging
A two-photon laser scanning microscope was used for in vivo imaging. The microscope consisted of a scan head (Bruker/Prairie Technologies, Madison, WI) and a Ti:sapphire laser (Mai Tai DS; Spectra-Physics, Menlo Park, CA) providing 100 fs pulses at 80 MHz tuned at a wavelength of 920 nm for this study. A 16×, 0.8 numerical aperture water immersion objective lens was used for imaging (Nikon Instruments Inc., Melville, NY). Fluorescence was detected using non-descanned photomultiplier tubes (Hamamatsu Photonics KK, Hamamatsu, Shizuoka, Japan) in whole-field detection mode. Images of 1024 × 1024 pixel (815 μm × 815 μm) were acquired using Prairie View software. Z-stacks were taken every hour with 2 μm step-size.
Data Analysis
Because the microdialysis probes needed to be fixed onto the headcap prior to imaging, the earliest z-stack time point was 0.5 hr post implant. In a previous publication with solid silicon implants, the initial microglia response settled within the 1 st hour and then showed limited morphological change over the first 6 hrs [ 33 ]. In some previous animals, anesthesia related issues caused deterioration of the animal health and tissue around 7–8 hrs post implant [ 33 ]. Therefore, quantitative morphological analysis was conducted at the 6 hr time point [ 33 ]. Microglial cells were characterized as ramified or in the activated transitional stage (T-stage), characterized by retraction of most processes with extension of others toward the insult or injury location. The number of ramified cells divided by total cells were then binned by distances and averaged across trials to generate p , the probability that a microglia body will be in the ramified state in each bin. Because the p with respect to distance plot follows a Bernoulli distribution, a binomial logarithmic generalized linear regression was used to deduce the distance for a given p : [1] log ( p 1 - p ) = α + β x where p represents the ramification index, and x represents the distance from the probe as previously established [ 33 ]. Measurements and calculation of a T-stage morphology index and microglia directionality index was also performed to assess the activated state of microglia by two counters. T-stage morphology index was calculated by measuring the length ( n ) of the longest microglia process from the hemisphere facing the probe and the length ( f ) of the longest process facing away from the probe at 6 hr post implantation. Similarly, microglia directionality index was calculated by measuring the number of processes ( n ) extending from the cell body in the hemisphere facing the probe and the number of processes ( f ) extending from the cell body in the hemisphere facing away from the probe. Index values were calculated using the following formula as previously established [ 33 ]: [2] Index = ( f - n ) ( f + n ) + 1 In both cases, an index value of 1 represents a ramified microglia cell ( n = f ), while an index of 0 represents a fully active T-stage microglia cell extending all processes toward the implant, similar to the microglia ramification state rating method. Note that if a microglia reduces ‘ f ’ by 50% and increases ‘ n ’ by 50%, the resulting index will be 0.5. Binning was performed to compute error bars as a function of distance for the indices, and the size of each bin was 30 μm. The distribution of the index values as a function of cell body distance from the implant was then generated. This distribution was fitted to a dual sigmoidal function as done previously using a custom MATLAB script [ 33 ]. This function was used to capture the plateau feature between normal ramified microglia and T-stage active microglia, which corresponds to 1 and 0, respectively. The sigmoidal function was parameterized by amplitude ( a ), shoulder location ( d 1 and d 2 in μm), and shoulder width ( w 1 and w 2 in μm) and the fit was constrained to indexes between 0 and 1 ( Eqn. [3] ). To determine the distance where the microglia morphology differs from a non-active microglia, the data were binned over 30μm increments and mean and standard deviation of the index values were computed. Welsh t-tests were computed over each bin and significant differences were established for p
📊 Figures
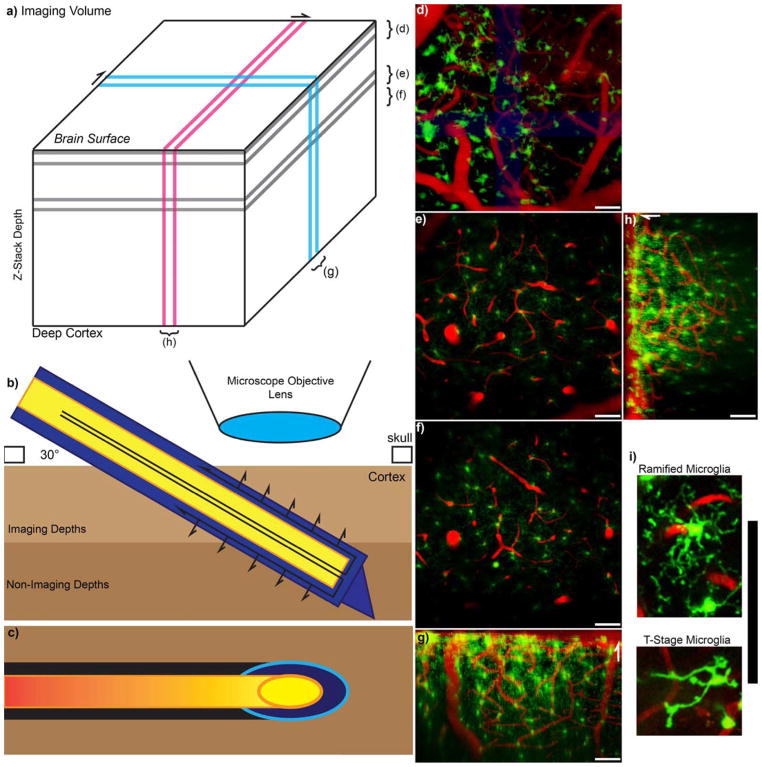
Figure 1
Experimental Setup
a) Model Z-stack imaging volume with Two Photon Microscopy. Brackets for du2013f indicate z-projections that are parallel to the skull or surface of the brain, while g and h indicate y-projection and ...
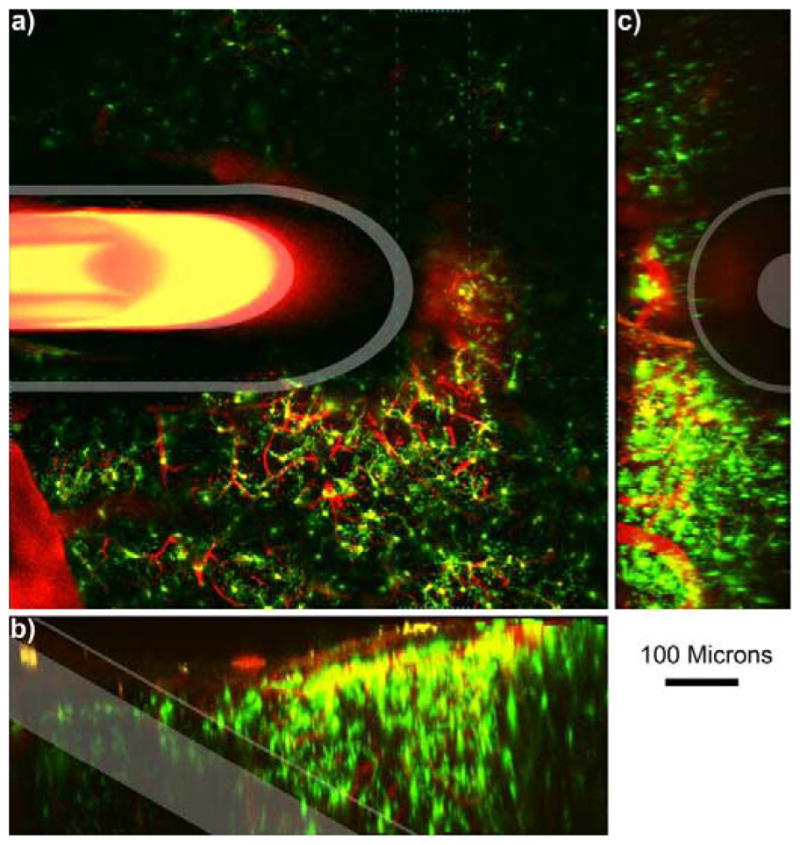
Figure 2
Microdialysis Probe in vivo into the cortex. a) 100 u03bcm thick Z-projection of a microdialysis probe implanted into the tissue. The image is parallel to the skull. Outer membrane and inner fused sil...
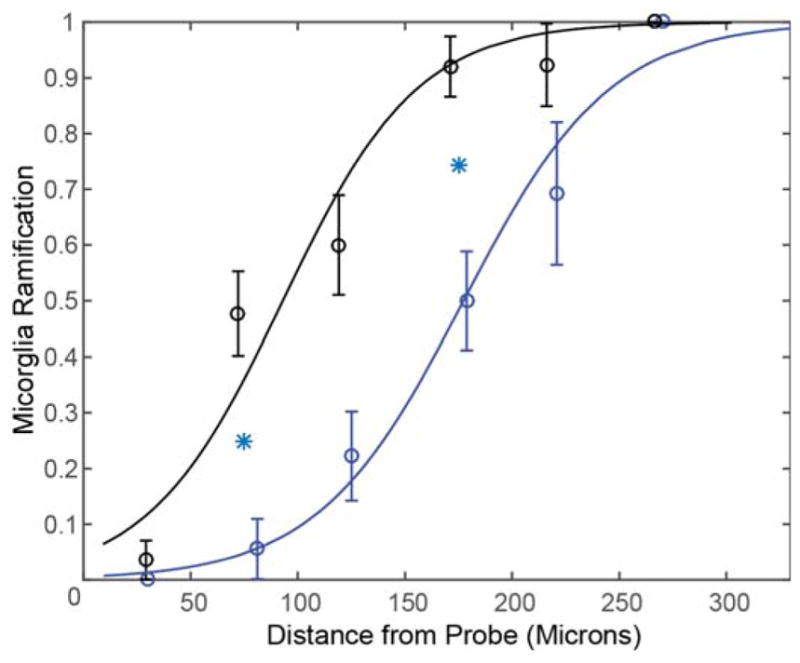
Figure 3
Dex reduces Microglial Activation. Curves characterize microglia ramification versus the distance from the probe. Index = 1 represents all microglial cells being ramified, while index = 0 represents a...
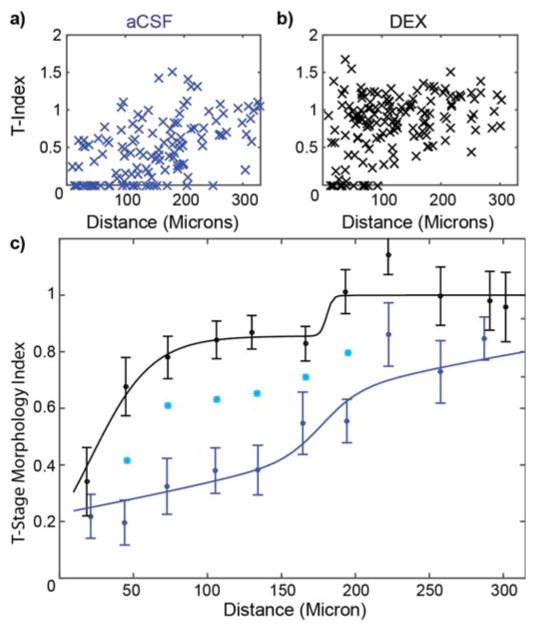
Figure 4
Dex Significantly Reduces Microglial T-Stage Morphology Activation. T-stage morphology index where 1 is the ramified state and 0 is the transitional stage of activated microglia. T-index of individual...
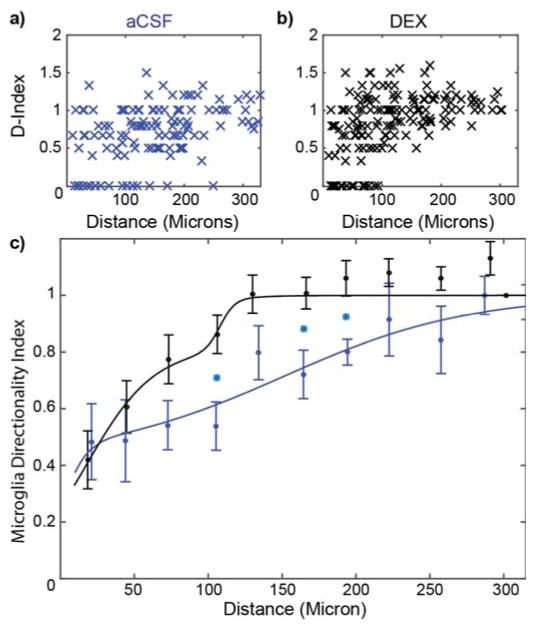
Figure 5
Dex Significantly Reduces Microglial Directionality Polarization. D-stage morphology index where 1 is the ramified state and 0 is the transitional stage of activated microglia. D-index of individual m...
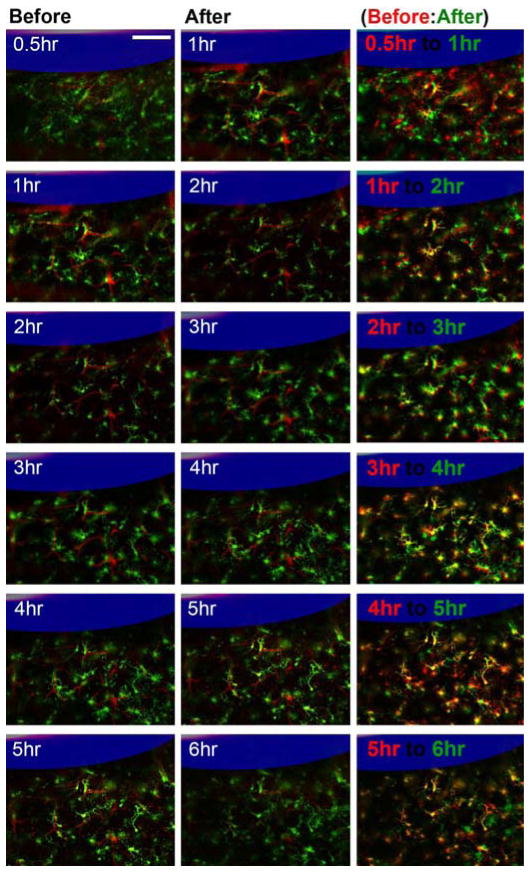
Figure 6
Dynamic microglia reaction around aCSF perfused microdialysis from 0.5 hr to 6 hr. Microdialysis probe is outlined in blue. White numbers label static time points, red are landmark blood vessels, and ...
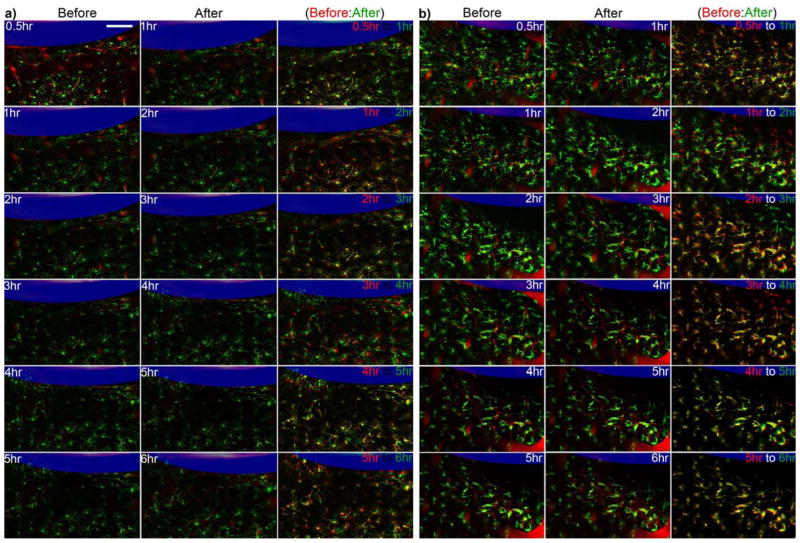
Figure 7
Dynamic microglia reaction around Dex perfused microdialysis from 0.5 hr to 6 hr. a) Typical microglial reaction pattern. b) Rare microglia reaction pattern. Microdialysis probe is outlined in blue. R...
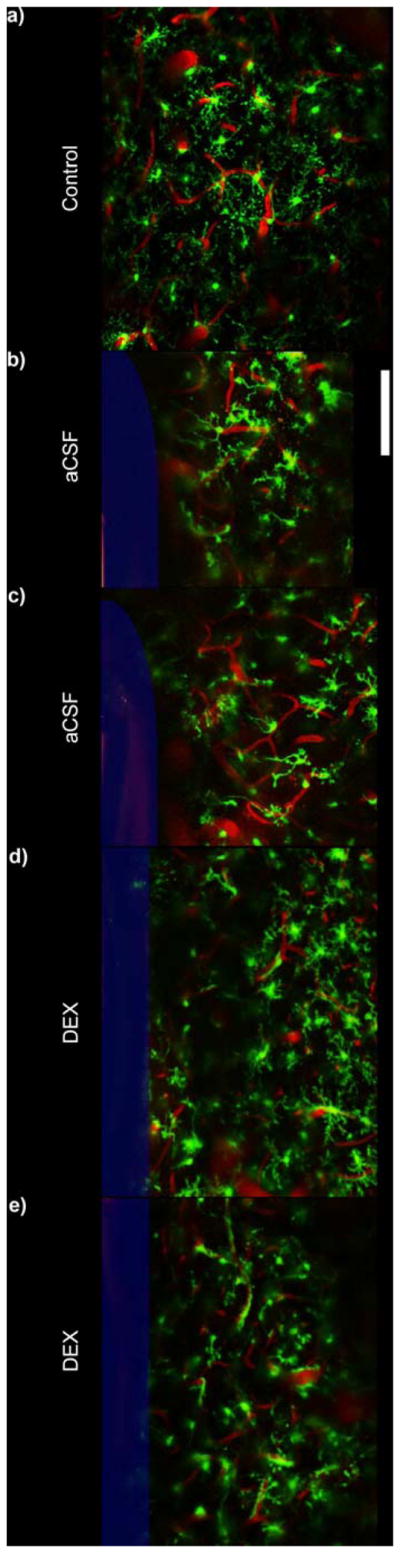
Figure 8
Qualitative Morphological Examination (25 u03bcm thick Z-projections). a) Microglia in non-implanted control tissue shows extended radial processes. bu2013c) Microglial cells around aCSF perfused micr...
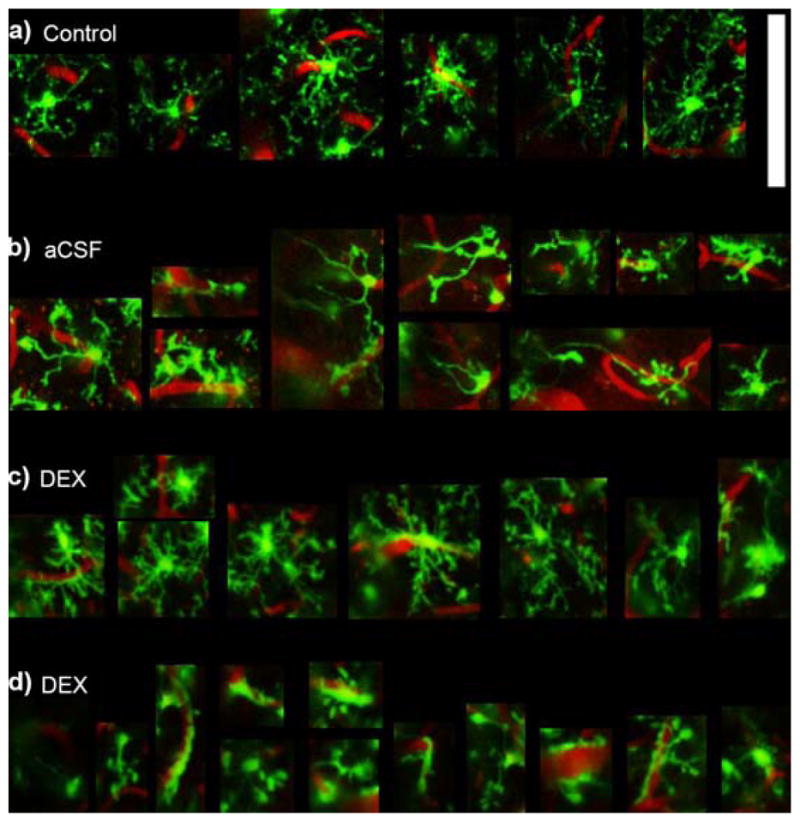
Figure 9
Qualitative Microglial Morphology. Zoomed in images of cells from Figure 8 . a) An example of ramified microglia showing thin radially expanded morphology. b) Activated microglia around aCSF perfused ...
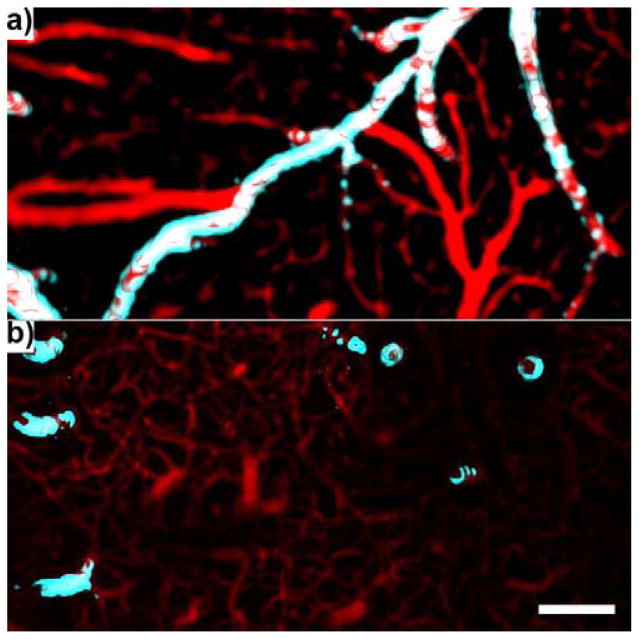
Figure 10
Arteries and Veins. a) Surface vasculature. b) intracortical vasculature below the surface of the brain up to a depth of ~500 u03bcm. Veins/capillaries = red. Large arteries (C57BL/6-Tg(CAG-EGFP)1Osb/...
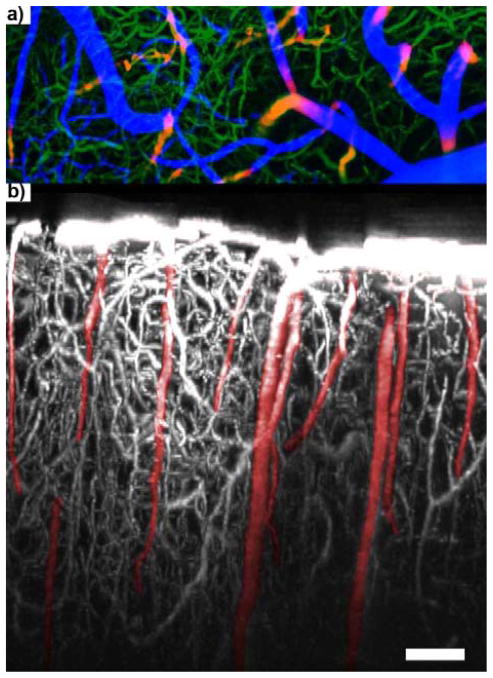
Figure 11
950 u03bcm In Vivo 3D BBB Map. a) u201cVisibleu201d surface vessels (blue), u201cInvisibleu201d intra-cortical small capillaries (green), u201cInvisibleu201d major arteries and veins (red/yellow). b) ...
Figure images are served from the NIH/NLM PubMed Central Open Access Subset or Europe PMC; copyright remains with the publishers and authors.
💬 Discussion
0 commentsNo comments yet. Be the first to start a discussion!
Leave a Comment