Abstract
In the past decade, much has been elucidated regarding the functional organization of the axonal connection of olfactory sensory neurons to olfactory bulb (OB) glomeruli. However, the manner in which projection neurons of the OB process odorant input and send this information to higher brain centers remains unclear. Here, we report long-range, large-scale tracing of the axonal projection patterns of OB neurons using two-photon microscopy. Tracer injection into a single glomerulus demonstrated widely distributed mitral/tufted cell axonal projections on the lateroventral surface of the mouse brain, including the anterior/posterior piriform cortex (PC) and olfactory tubercle (OT). We noted two distinct groups of labeled axons: PC-orienting axons and OT-orienting axons. Each group occupied distinct parts of the lateral olfactory tract. PC-orienting axons projected axon collaterals to a wide area of the PC but only a few collaterals to the OT. OT-orienting axons densely projected axon collaterals primarily to the anterolateral OT (alOT). Different colored dye injections into the superficial and deep portions of the OB external plexiform layer revealed that the PC-orienting axon populations originated in presumed mitral cells and the OT-orienting axons in presumed tufted cells. These data suggest that although mitral and tufted cells receive similar odor signals from a shared glomerulus, they process the odor information in different ways and send their output to different higher brain centers via the PC and alOT.
🔬 Techniques
🧬 Organisms
💻 Software
✨ Fluorophores
🧪 Sample Preparation
🏭 Microscope Brands
🧪 Reagent Suppliers
🔴 Lasers
📷 Detectors
💻 Software Details
🏛️ Research Organizations (ROR)
Affiliated research institutions:
📋 Methods
All experimental protocols were approved by the University of Texas Medical School at Houston and Yale University Institutional Animal Care and Use Committee in accordance with the National Institutes of Health guidelines. A total of 19 mice (11 OMP-Synapto-pHluorin knock-in mice, Jackson Lab, and 8 C57BL/6, Charles River) were anesthetized with nembutal (i.p. 50 mg/kg body weight). The animals were kept on a heating pad with circulating water set at 40°C. The bone covering the dorsal OB was carefully thinned, and a small opening was made (200–500 μm diameter) for glass pipette penetration. Dextran-conjugated Alexa 488 or Alexa 594 (Invitrogen) was diluted in Ca 2+ -free Ringer solution (140 mM NaCl, 5 mM KCl, 3 mM MgCl, 0.01 mM EDTA, 10 mM HEPES, and 10 mM glucose, pH 7.5) and used as 10% dye solution. Glomeruli were visualized by two-photon fluorescence imaging of OMP-SpH knock-in mice (Bozza et al., 2004 ). A dye-filled glass pipette (tip I.D., 2.5 μm) was placed into the target glomerulus under visualization with a two-photon microscope, or into the superficial or deep external plexiform layer (EPL) according to micromanipulator penetration depth (100–150 or 200–250 μm depth, respectively). Small square-wave pulses were delivered via the pipette for dye electroporation (3–5 μA, 25-ms pulse width, 2 Hz, 1200–3600 pulses). The electroporation effective area using this technique has been previously reported to be about 30 μm in diameter (Nagayama et al., 2007 ), and was effective to label a single glomerulus or superficial/deep EPL in the OB. Three to 5 days after the dye injection, animals were deeply anesthetized by nembutal injection (i.p. 150 mg/kg) and perfused transcardially with 0.9% NaCl followed by 4% paraformaldehyde in 0.1 M phosphate buffer. Brains were carefully withdrawn from the skull, and the ventrolateral aspect of the whole brain was imaged using a custom-built two-photon microscope system. The imaging system consisted of a mode-locked laser, operating at a 100-fs pulse width, 80-MHz pulse frequency, and 810-nm wavelength (Tsunami Millennia Xs or Mai Tai DeepSee, Spectra Physics), and an Olympus Fluoview scan box mounted on an upright BX50WI microscope. Images were captured with a 10× Olympus water immersion-type objective lens (NA = 0.3). Images were collected at different focus planes with a 10-μm interval. The images were stacked and tiled for enlarged views using Image-J and Photoshop software. Some brains were post-fixed overnight and sectioned with a vibratome to observe the dye injection site. The 50-μm sections were mounted on glass slides using mounting medium that included DAPI (Vectashield, VECTOR), and images were captured using an Olympus microscope with a CCD camera (Sensicam). In total, single-glomerulus dye injections were carried out in six brain hemispheres, and six superficial/deep EPL dye injection samples were used in this study for data analysis.
Show full methods section
All experimental protocols were approved by the University of Texas Medical School at Houston and Yale University Institutional Animal Care and Use Committee in accordance with the National Institutes of Health guidelines. A total of 19 mice (11 OMP-Synapto-pHluorin knock-in mice, Jackson Lab, and 8 C57BL/6, Charles River) were anesthetized with nembutal (i.p. 50 mg/kg body weight). The animals were kept on a heating pad with circulating water set at 40°C. The bone covering the dorsal OB was carefully thinned, and a small opening was made (200–500 μm diameter) for glass pipette penetration. Dextran-conjugated Alexa 488 or Alexa 594 (Invitrogen) was diluted in Ca 2+ -free Ringer solution (140 mM NaCl, 5 mM KCl, 3 mM MgCl, 0.01 mM EDTA, 10 mM HEPES, and 10 mM glucose, pH 7.5) and used as 10% dye solution. Glomeruli were visualized by two-photon fluorescence imaging of OMP-SpH knock-in mice (Bozza et al., 2004 ). A dye-filled glass pipette (tip I.D., 2.5 μm) was placed into the target glomerulus under visualization with a two-photon microscope, or into the superficial or deep external plexiform layer (EPL) according to micromanipulator penetration depth (100–150 or 200–250 μm depth, respectively). Small square-wave pulses were delivered via the pipette for dye electroporation (3–5 μA, 25-ms pulse width, 2 Hz, 1200–3600 pulses). The electroporation effective area using this technique has been previously reported to be about 30 μm in diameter (Nagayama et al., 2007 ), and was effective to label a single glomerulus or superficial/deep EPL in the OB. Three to 5 days after the dye injection, animals were deeply anesthetized by nembutal injection (i.p. 150 mg/kg) and perfused transcardially with 0.9% NaCl followed by 4% paraformaldehyde in 0.1 M phosphate buffer. Brains were carefully withdrawn from the skull, and the ventrolateral aspect of the whole brain was imaged using a custom-built two-photon microscope system. The imaging system consisted of a mode-locked laser, operating at a 100-fs pulse width, 80-MHz pulse frequency, and 810-nm wavelength (Tsunami Millennia Xs or Mai Tai DeepSee, Spectra Physics), and an Olympus Fluoview scan box mounted on an upright BX50WI microscope. Images were captured with a 10× Olympus water immersion-type objective lens (NA = 0.3). Images were collected at different focus planes with a 10-μm interval. The images were stacked and tiled for enlarged views using Image-J and Photoshop software. Some brains were post-fixed overnight and sectioned with a vibratome to observe the dye injection site. The 50-μm sections were mounted on glass slides using mounting medium that included DAPI (Vectashield, VECTOR), and images were captured using an Olympus microscope with a CCD camera (Sensicam). In total, single-glomerulus dye injections were carried out in six brain hemispheres, and six superficial/deep EPL dye injection samples were used in this study for data analysis.
Limitations of the tracing method
To interpret the data accurately, the physical drawbacks of this tracing method must first be discussed. This method has the following difficulties and limitations: (1) tracing of obscured brain surface areas, such as the rhinal sulcus and septal regions of the OC, lateral entorhinal cortex, and amygdaloid cortex; (2) detection of weakly labeled and small branches; (3) detection of the axons that extend into deeper brain areas such as the ventrorostral anterior PC (APC VR ) region beneath the LOT (Ekstrand et al., 2001 ); and (4) identification of individual axons in axon-congested areas such as the anterior LOT in the area of the AOC. Comparatively, although classical single-neuron approaches have a higher quality of individual axon tracing in regard to the limitations above, our method allows the tracing and comparison of multiple axons simultaneously within the same sample. This advantage is critical for the exploration of large neuroanatomical circuits and allowed us to compare the individual axon trajectories arising from a common glomerulus as well as from differentially labeled presumed mitral and tufted cell populations. Further use of this method could reveal OB–OC connections more clearly and completely in future investigations.
📊 Figures
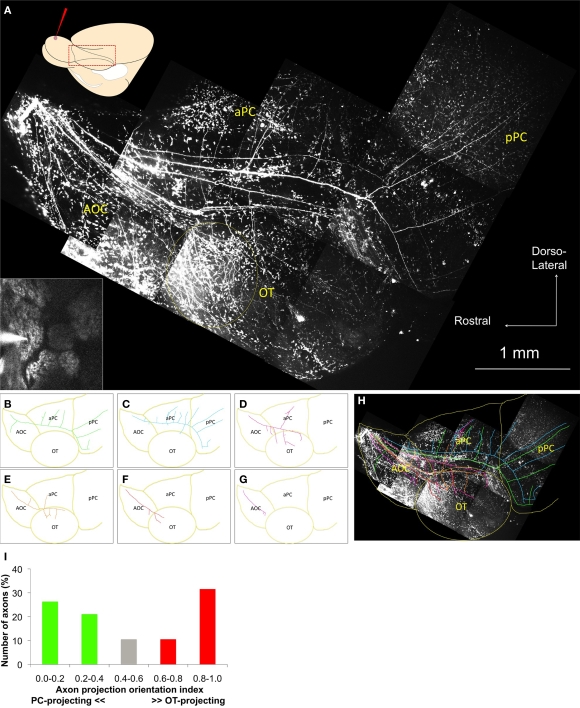
Figure 1
Axonal trajectories of neurons from a single glomerulus . (A) Two-photon images of the ventrolateral aspect of the whole brain. A schematic diagram of the dye injection and observation areas from the ...
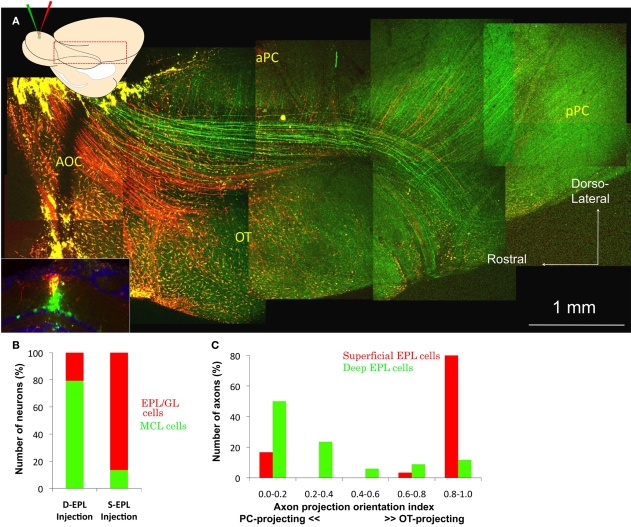
Figure 2
Superficial and deep EPL cell axon projection pattern . (A) Inset: Coronal image of the tracer injection site in the OB. Dextran-conjugated Alexa 488 (green) and Alexa 594 (red) were injected into the...
Figure images are served from the NIH/NLM PubMed Central Open Access Subset or Europe PMC; copyright remains with the publishers and authors.
💬 Discussion
0 commentsNo comments yet. Be the first to start a discussion!
Leave a Comment