Abstract
BACKGROUND: Dimerization is an important regulatory mechanism of single membrane-spanning receptors. For instance, activation of receptor protein-tyrosine kinases (RPTKs) involves dimerization. Structural, functional and biochemical studies suggested that the enzymatic counterparts of RPTKs, the receptor protein-tyrosine phosphatases (RPTPs), are inhibited by dimerization, but whether RPTPs actually dimerize in living cells remained to be determined. RESULTS: In order to assess RPTP dimerization, we have assayed Fluorescence Resonance Energy Transfer (FRET) between chimeric proteins of cyan- and yellow-emitting derivatives of green fluorescent protein, fused to RPTPalpha, using three different techniques: dual wavelength excitation, spectral imaging and fluorescence lifetime imaging. All three techniques suggested that FRET occurred between RPTPalpha -CFP and -YFP fusion proteins, and thus that RPTPalpha dimerized in living cells. RPTPalpha dimerization was constitutive, extensive and specific. RPTPalpha dimerization was consistent with cross-linking experiments, using a non-cell-permeable chemical cross-linker. Using a panel of deletion mutants, we found that the transmembrane domain was required and sufficient for dimerization. CONCLUSIONS: We demonstrate here that RPTPalpha dimerized constitutively in living cells, which may be mediated by the transmembrane domain, providing strong support for the model that dimerization is involved in regulation of RPTPs.
🔬 Techniques
✨ Fluorophores
🧪 Sample Preparation
🏭 Microscope Brands
📷 Detectors
💻 Software Details
🏛️ Research Organizations (ROR)
Affiliated research institutions:
📋 Methods
Cells, plasmids and transfections SK-N-MC neuroepithelioma cells were grown in Dulbecco's Modified Eagle's Medium, supplemented with 10% Fetal Calf Serum. Expression vectors for chimeric RPTPα fusion proteins were generated by insertion of CFP and YFP [ 30 ] (kind gift of Roger Y. Tsien) on PCR-amplified BglII-fragments into pSG-HA- RPTPα [ 55 ] in which BglII sites had been introduced at the appropriate sites, position 792, 516, 250 or 200 (numbering according to [ 56 ]) by site-directed mutagenesis. In RPTPα-200Δ ED, the extracellular domain was deleted by deletion of an EcoNI-PstI fragment encompassing residues 30-129. RPTPα-EGFR-200 contains the extracellular domain of RPTPα (residues 1 - 142), fused to the transmembrane domain and 34 residues of the cytoplasmic domain of the EGFR (residues 646 - 702), comparable to RPTPα 200-XFP. Expression vectors for EGFR-XFP were generated by insertion of CFP and YFP into the endogenous BglII-site in the human EGFR (at position Ile923). SK-N-MC neuroepithelioma cells were grown on glass coverslips and transiently transfected with equal amounts (5-10 μg total plasmid DNA per 5 cm dish) of CFP- and YFP-fusion constructs by calcium phosphate precipitation exactly as described [ 55 ] and assayed 48 h after transfection.
Fluorescence Resonance Energy Transfer
For the FRET experiments, the cells were incubated at 22 0 C in a HEPES buffered saline buffer (140 mM NaCl; 5 mM KCl; 2 mM CaCl 2 ; 2 mM MgCl2; 10 mM HEPES; 10 mM glucose; 0.1% BSA; pH 7.50). We used a Leitz orthoplan upright microscope (Leitz GMBH, Wetzlar, Germany) and a SPEX Fluorolog fluorimeter (SPEX Industries, NJ) with two excitation monochromators (slit width: 8 nm). Two filter sets (Ploemopak) were used, the "CFP" filter set (filter #1) with an RKP510 dichroic mirror and a 490 nm long-pass emission filter, and the "FRET" filter (filter #2), equipped with a dichroic mirror RKP510 (reflection short-pass filter) and a BP530-560 (band-pass) emission filter (Leitz GMBH, Wetzlar, Germany). The fluorescence intensity was quantified with a Photon Counting Tube (type 9862, EMI Limited, Middlesex, England). The fluorescence intensities (obtained after excitation at 440 nm or 490 nm) were corrected for differences in excitation light intensities, using the reference photomultiplier. Fluorescence intensities were recorded from single living cells and corrected for background, using adjacent non-transfected cells. Routinely, we determined the F (440) and F (490) ratio in 5 or more individual cells that expressed both the CFP- and YFP-fusion proteins, using both filter sets. The ratio of F (440) and F (490) was determined using the FRET filter and consists of three terms: direct excitation of YFP, residual CFP fluorescence, and FRET, as indicated in the following formula: In this formula, γ is a correction factor consisting of the relative transmission efficiencies of the microscope and the reflection efficiencies of the dichroic mirror at both excitation wavelengths. In our microscope γ was 1.0. The molar extinction coefficients, ε CFP (440), ε YFP (440), and ε YFP (490) are respectively, 32.5, 10.5 and 55.3 x 10 3 M -1 cm -1 [ 31 ]. QE (CFP/YFP) is the detection efficiency ratio for CFP to YFP detection, and we estimated the ratio QE (CFP/YFP) to be 0.2, based on the emission spectra of CFP and YFP, and on the filter set used. R (CFP/YFP) is the molar expression ratio in the cells of CFP and YFP-tagged fusion proteins. E is the FRET efficiency in a CFP and YFP labelled receptor dimer, which is dependent on the distance and orientation of the fluorophores. α is the degree of dimerization, ranging from 0 (no dimerization) to 1 (100% dimerization). The F(440)/F(490) ratio of cells expressing YFP fusion proteins only, was 0.16±0.04, consistent with the theoretical value (terms 2 and 3 of the formula are 0). In case there is no dimerization and/or FRET does not occur, term 3 in the formula above is 0 (α and/or E is 0), and F(440)/F(490) is directly proportional to the R (CFP/YFP) (see Fig. 2B ). F(440)/F(490) ranges from 0.25 to 0.37 if R (CFP/YFP) ranges from 0.5 to 1.5, and E * α = 0 (no FRET and/or dimerization) (Fig. 2B ). If F(440)/F(490) >0.37 and R (CFP/YFP) is close to 1.0, then term 3 in the formula above must be >0, indicating that FRET occurs between CFP and YFP in dimers of RPTPα fusion proteins. Therefore, we set the threshold level of F(440)/F(490) for FRET and dimerization at 0.37. FLIM and SPIM Both the SPIM and FLIM detector units were built on a Leica DMR upright epifluorescence microscope. Both detector systems are described in detail elsewhere [ 28 , 38 ]. Briefly, FLIM was implemented in the frequency domain using a homodyne detection scheme and a (wide field) RF-modulated image intensifier-CCD-coupled detector unit, and the SPIM detector unit consisted of an f/4 image spectrograph coupled to a back-illuminated chilled CCD camera. For SPIM, excitation was provided by a 100 W Hg Arc lamp of which the 435 nm line was selected by inserting an Omega (Brattleboro, VT, USA) 435DF10 bandpass filter in the excitation light path. The excitation light was reflected onto the sample by an Omega 430DCLP dichroic mirror. A Leica 63x PL Apo water objective (NA = 1.2) was employed, using no coverslip, and immersing with HEPES buffered saline buffer (see above) at 20°C. Residual excitation light was rejected using a Schott (Mainz, Germany) GG455 longpass filter. In the spectrograph (Chromex 250 is (Chromex Inc., Albuquerque, NM, USA)) a 150 grooves/mm grating was used with a central wavelength of 500 nm. Single cells were positioned by aligning them across the entrance slit of the spectrograph (set at 200 μm width corresponding with a line of 3 μm width in the object plane). Acquisition time was 1-2 s. Regions of the image spectrum corresponding to the plasma membrane of labeled cells were distance averaged (typically 5-10 rows of pixels) and the resulting fluorescence spectra were corrected for background fluorescence and camera bias by background subtraction using an extracellular region just next to the plasma membrane region from the same spectral image. For FLIM, the cells were excited with the 457 nm argon-ion laser line modulated at 60.116 MHz and the CFP fluorescence was selectively imaged using an Omega 470 DCLP dichroic mirror and an Omega 487RDF42 bandpass emission filter. 20 phase images (1-3 s each) were taken (10 with increasing and 10 with decreasing the phase allowing correction for photobleaching (which was less than 10% in all cases)). Reference phase settings and modulation were calibrated approximately every 30' by measuring a glass microcuvette filled with an erythrosine-B solution in water (single component fluorescence decay with a lifetime of 0.08 ns). The microscope setup, lifetime-image calculation and image processing are described in detail elsewhere [ 28 ].
Show full methods section
Cells, plasmids and transfections SK-N-MC neuroepithelioma cells were grown in Dulbecco's Modified Eagle's Medium, supplemented with 10% Fetal Calf Serum. Expression vectors for chimeric RPTPα fusion proteins were generated by insertion of CFP and YFP [ 30 ] (kind gift of Roger Y. Tsien) on PCR-amplified BglII-fragments into pSG-HA- RPTPα [ 55 ] in which BglII sites had been introduced at the appropriate sites, position 792, 516, 250 or 200 (numbering according to [ 56 ]) by site-directed mutagenesis. In RPTPα-200Δ ED, the extracellular domain was deleted by deletion of an EcoNI-PstI fragment encompassing residues 30-129. RPTPα-EGFR-200 contains the extracellular domain of RPTPα (residues 1 - 142), fused to the transmembrane domain and 34 residues of the cytoplasmic domain of the EGFR (residues 646 - 702), comparable to RPTPα 200-XFP. Expression vectors for EGFR-XFP were generated by insertion of CFP and YFP into the endogenous BglII-site in the human EGFR (at position Ile923). SK-N-MC neuroepithelioma cells were grown on glass coverslips and transiently transfected with equal amounts (5-10 μg total plasmid DNA per 5 cm dish) of CFP- and YFP-fusion constructs by calcium phosphate precipitation exactly as described [ 55 ] and assayed 48 h after transfection.
Fluorescence Resonance Energy Transfer
For the FRET experiments, the cells were incubated at 22 0 C in a HEPES buffered saline buffer (140 mM NaCl; 5 mM KCl; 2 mM CaCl 2 ; 2 mM MgCl2; 10 mM HEPES; 10 mM glucose; 0.1% BSA; pH 7.50). We used a Leitz orthoplan upright microscope (Leitz GMBH, Wetzlar, Germany) and a SPEX Fluorolog fluorimeter (SPEX Industries, NJ) with two excitation monochromators (slit width: 8 nm). Two filter sets (Ploemopak) were used, the "CFP" filter set (filter #1) with an RKP510 dichroic mirror and a 490 nm long-pass emission filter, and the "FRET" filter (filter #2), equipped with a dichroic mirror RKP510 (reflection short-pass filter) and a BP530-560 (band-pass) emission filter (Leitz GMBH, Wetzlar, Germany). The fluorescence intensity was quantified with a Photon Counting Tube (type 9862, EMI Limited, Middlesex, England). The fluorescence intensities (obtained after excitation at 440 nm or 490 nm) were corrected for differences in excitation light intensities, using the reference photomultiplier. Fluorescence intensities were recorded from single living cells and corrected for background, using adjacent non-transfected cells. Routinely, we determined the F (440) and F (490) ratio in 5 or more individual cells that expressed both the CFP- and YFP-fusion proteins, using both filter sets. The ratio of F (440) and F (490) was determined using the FRET filter and consists of three terms: direct excitation of YFP, residual CFP fluorescence, and FRET, as indicated in the following formula: In this formula, γ is a correction factor consisting of the relative transmission efficiencies of the microscope and the reflection efficiencies of the dichroic mirror at both excitation wavelengths. In our microscope γ was 1.0. The molar extinction coefficients, ε CFP (440), ε YFP (440), and ε YFP (490) are respectively, 32.5, 10.5 and 55.3 x 10 3 M -1 cm -1 [ 31 ]. QE (CFP/YFP) is the detection efficiency ratio for CFP to YFP detection, and we estimated the ratio QE (CFP/YFP) to be 0.2, based on the emission spectra of CFP and YFP, and on the filter set used. R (CFP/YFP) is the molar expression ratio in the cells of CFP and YFP-tagged fusion proteins. E is the FRET efficiency in a CFP and YFP labelled receptor dimer, which is dependent on the distance and orientation of the fluorophores. α is the degree of dimerization, ranging from 0 (no dimerization) to 1 (100% dimerization). The F(440)/F(490) ratio of cells expressing YFP fusion proteins only, was 0.16±0.04, consistent with the theoretical value (terms 2 and 3 of the formula are 0). In case there is no dimerization and/or FRET does not occur, term 3 in the formula above is 0 (α and/or E is 0), and F(440)/F(490) is directly proportional to the R (CFP/YFP) (see Fig. 2B ). F(440)/F(490) ranges from 0.25 to 0.37 if R (CFP/YFP) ranges from 0.5 to 1.5, and E * α = 0 (no FRET and/or dimerization) (Fig. 2B ). If F(440)/F(490) >0.37 and R (CFP/YFP) is close to 1.0, then term 3 in the formula above must be >0, indicating that FRET occurs between CFP and YFP in dimers of RPTPα fusion proteins. Therefore, we set the threshold level of F(440)/F(490) for FRET and dimerization at 0.37. FLIM and SPIM Both the SPIM and FLIM detector units were built on a Leica DMR upright epifluorescence microscope. Both detector systems are described in detail elsewhere [ 28 , 38 ]. Briefly, FLIM was implemented in the frequency domain using a homodyne detection scheme and a (wide field) RF-modulated image intensifier-CCD-coupled detector unit, and the SPIM detector unit consisted of an f/4 image spectrograph coupled to a back-illuminated chilled CCD camera. For SPIM, excitation was provided by a 100 W Hg Arc lamp of which the 435 nm line was selected by inserting an Omega (Brattleboro, VT, USA) 435DF10 bandpass filter in the excitation light path. The excitation light was reflected onto the sample by an Omega 430DCLP dichroic mirror. A Leica 63x PL Apo water objective (NA = 1.2) was employed, using no coverslip, and immersing with HEPES buffered saline buffer (see above) at 20°C. Residual excitation light was rejected using a Schott (Mainz, Germany) GG455 longpass filter. In the spectrograph (Chromex 250 is (Chromex Inc., Albuquerque, NM, USA)) a 150 grooves/mm grating was used with a central wavelength of 500 nm. Single cells were positioned by aligning them across the entrance slit of the spectrograph (set at 200 μm width corresponding with a line of 3 μm width in the object plane). Acquisition time was 1-2 s. Regions of the image spectrum corresponding to the plasma membrane of labeled cells were distance averaged (typically 5-10 rows of pixels) and the resulting fluorescence spectra were corrected for background fluorescence and camera bias by background subtraction using an extracellular region just next to the plasma membrane region from the same spectral image. For FLIM, the cells were excited with the 457 nm argon-ion laser line modulated at 60.116 MHz and the CFP fluorescence was selectively imaged using an Omega 470 DCLP dichroic mirror and an Omega 487RDF42 bandpass emission filter. 20 phase images (1-3 s each) were taken (10 with increasing and 10 with decreasing the phase allowing correction for photobleaching (which was less than 10% in all cases)). Reference phase settings and modulation were calibrated approximately every 30' by measuring a glass microcuvette filled with an erythrosine-B solution in water (single component fluorescence decay with a lifetime of 0.08 ns). The microscope setup, lifetime-image calculation and image processing are described in detail elsewhere [ 28 ].
Immunoblotting
Following transient transfection the cells were lysed in cell lysis buffer (50 mM HEPES pH 7.4, 150 mM NaCl, 1.5 mM MgCl 2 , 1 mM EGTA, 1% Triton X-100, 10% glycerol, 10 u/ml aprotinin, 1 μM pMSF, 200 μM sodium orthovanadate), and the amount of protein in the lysates was determined. Subsequently, cell lysates containing equal amounts of protein were loaded on SDS-PAGE gels (7.5 - 12.5%, depending on the size of the construct). The material on the gels was blotted onto PVDF membranes by semi-dry blotting. The blots were blocked with 5% non-fat milk in TBS-T (50 mM Tris pH 8.0, 150 mM NaCl, 0.05% Tween-20) for 1 h, incubated with antibody in milk for 1.5 h, washed extensively and incubated with the appropriate horseradish peroxidase-conjugated secondary antibody for 1 h. Following extensive washing in TBS-T, the blots were developed using enhanced chemiluminescence. We used anti-GFP MAb (Transduction Labs, Lexington, KY), anti-HA-tag MAb (12CA5), and affinity purified anti-RPTPα antibodies, raised against the complete cytoplasmic domain (#5478) [ 57 ] as primary antibodies. Chemical cross-linking Prior to cross-linking, transiently transfected SK-N-MC neuroepithelioma cells were washed twice with ice cold phosphate-buffered saline (PBS). Subsequently, the cells were incubated with 2 mg/ml bis [sulfosuccinimidyl]suberate, BS 3 (Pierce, Rockford, IL) in PBS for 1 h on ice. Following cross-linking, the cells were washed twice with ice cold PBS, and the cross-linker was quenched with 50 mM Tris for 15 min. The cells were lysed and aliquots of the lysates were run on a 5% SDS-PAGE gel, blotted and probed, using anti-HA-tag antibodies as described above.
📊 Figures
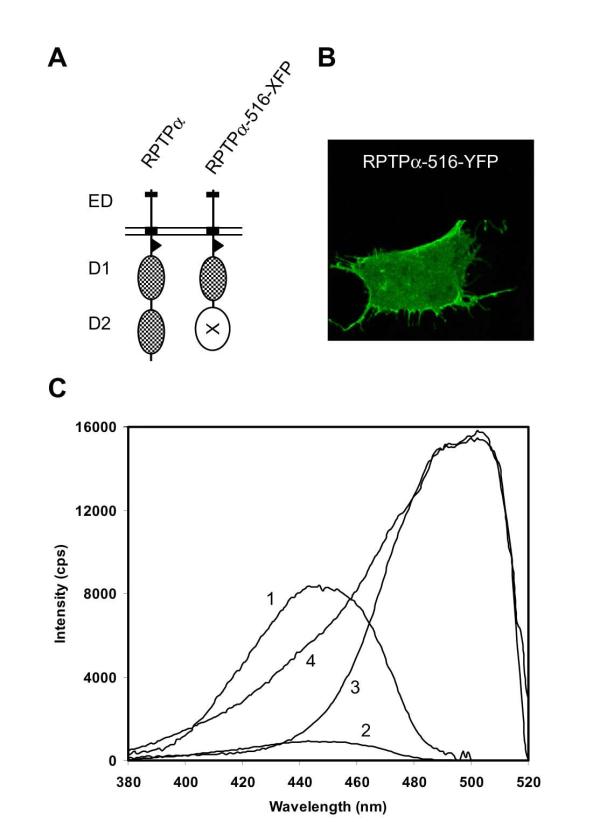
Figure 1
Expression and spectral properties of chimeric fluorescent RPTPu03b1 proteins. ( A ) Schematic representation of wild type RPTPu03b1 (RPTPu03b1 and RPTPu03b1-516-XFP, a construct in which either CFP o...
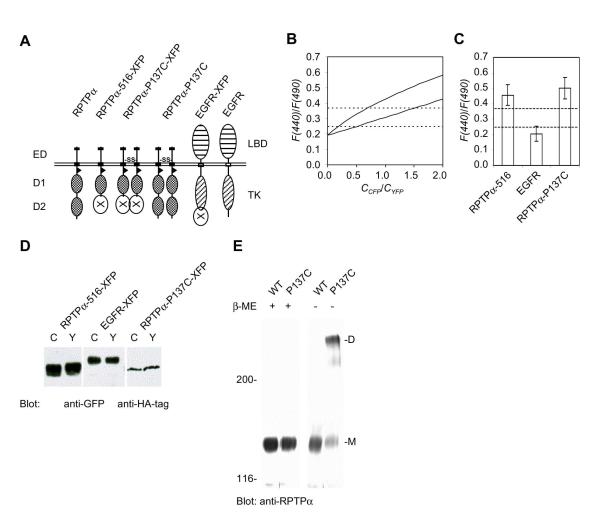
Figure 2
Specific and constitutive dimerization of RPTPu03b1, as assessed by FRET. ( A ) Schematic representation of the constructs that were used. RPTPu03b1-D2 was replaced by CFP or YFP in RPTPu03b1-516-XFP....
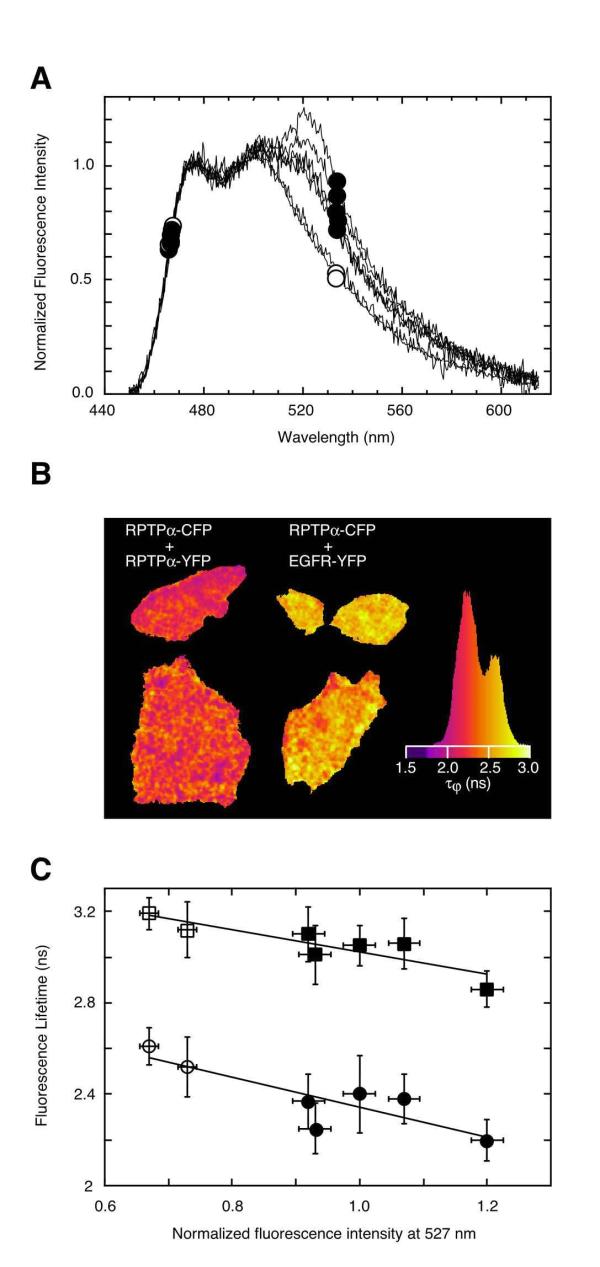
Figure 3
SPIM and FLIM confirm FRET in full length RPTPu03b1-CFP and -YFP expressing cells. (A) Normalized uncorrected fluorescence emission spectra of plasma membrane regions of single SK-N-MC cells expressin...
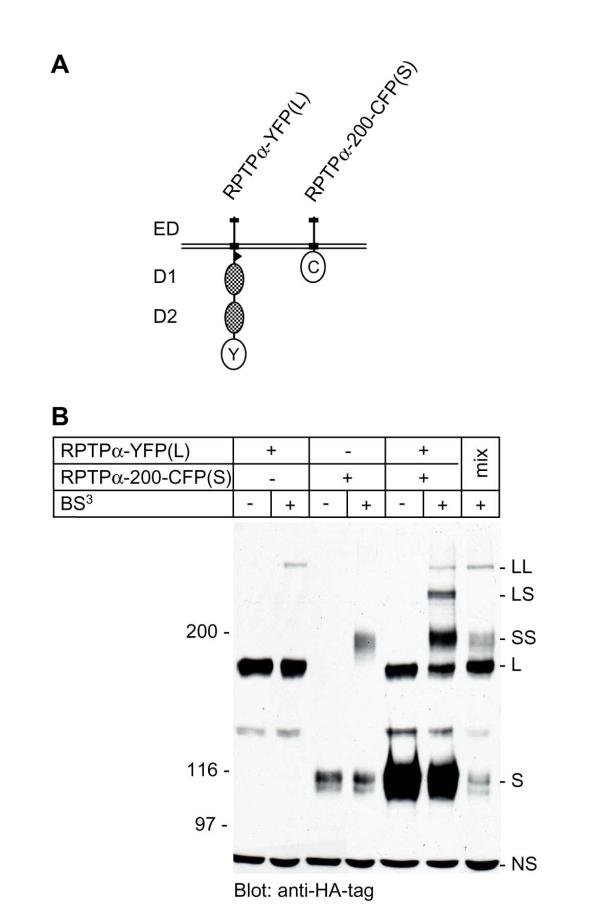
Figure 4
Homodimerization of RPTPu03b1 as assessed using a chemical cross-linker. ( A ) Distinct RPTPu03b1 constructs with different molecular weights were used to be able to discriminate between them. The lon...
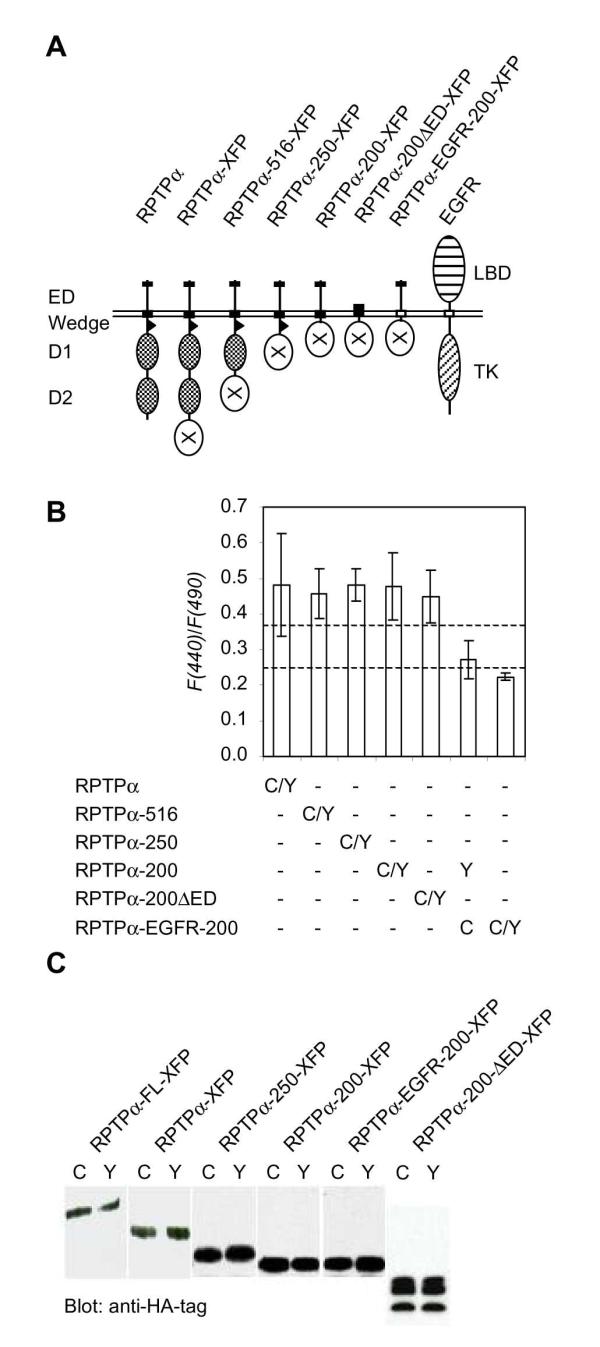
Figure 5
The transmembrane domain mediates RPTPu03b1 dimerization. ( A ) Schematic representation of RPTPu03b1 and deletion mutants. RPTPu03b1 fused to XFP (RPTPu03b1-XFP) and deletion mutants lacking D2 (RPTP...
Figure images are served from the NIH/NLM PubMed Central Open Access Subset or Europe PMC; copyright remains with the publishers and authors.
💬 Discussion
0 commentsNo comments yet. Be the first to start a discussion!
Leave a Comment