Abstract
Motor learning involves reorganization of the primary motor cortex (M1). However, it remains unclear how the involvement of M1 in movement control changes during long-term learning. To address this, we trained mice in a forelimb-based motor task over months and performed optogenetic inactivation and two-photon calcium imaging in M1 during the long-term training. We found that M1 inactivation impaired the forelimb movements in the early and middle stages, but not in the late stage, indicating that the movements that initially required M1 became independent of M1. As previously shown, M1 population activity became more consistent across trials from the early to middle stage while task performance rapidly improved. However, from the middle to late stage, M1 population activity became again variable despite consistent expert behaviors. This later decline in activity consistency suggests dissociation between M1 and movements. These findings suggest that long-term motor learning can disengage M1 from movement control.
🔬 Techniques
✨ Fluorophores
🧪 Sample Preparation
🏭 Microscope Brands
🔴 Lasers
💻 Software Details
💻 Code & Software
💾 Data Repositories
🏛️ Research Organizations (ROR)
Affiliated research institutions:
📋 Methods
Animals
All procedures were in accordance with protocols approved by the University of California, San Diego Institutional Animal Care and Use Committee and the guidelines of the National Institutes of Health. Mice (6 weeks or older, male and female, calcium imaging: cross between CaMK2a-tTA [JAX 003010] and tetO-GCaMP6s [JAX 024742]; optogenetic inactivation: cross between PV-Cre [JAX 00869] and Ai32 [JAX 024109]) were housed in a room with a reversed light cycle (12 hours–12 hours). Experiments were performed during the dark period. Behavioral apparatus The behavioral apparatus was housed in a soundproof box (40 cm by 40 cm by 40 cm), and the joystick task was performed in the dark. The components of the task ( 17 ) included a joystick (M11L061P, CH Products) and a water port (with photodiodes to sense licking). The joystick handle was custom machined and fitted with a 1.6-mm-thick brass rod that mice manipulated with their left forepaw. An electromagnet (EM050-3-222, APW) mechanically immobilized the joystick at the origin during intertrial intervals. The joystick had a dynamic range of 5 cm in each of two directions. The two-dimensional position of the joystick was continuously recorded at 1 kHz using a data acquisition card (USB6008, National Instruments) and custom MATLAB software. The task sequence execution, auditory cue presentation, and reward dispensation were coordinated (and recorded) by an open source real-time Linux/MATLAB software package BControl ( http://brodywiki.princeton.edu/bcontrol/ ). Behavioral training of the joystick task In the joystick task, the joystick was released from the electromagnet immobilization at the beginning of each trial. Two seconds after the trial onset, a 6-kHz auditory tone was played. If mice moved the joystick into the target within 10 s from the auditory tone onset, then they received a reward, even in trials where they initiated movements before the auditory tone. The return of the joystick to the origin ended the trial and initiated an intertrial interval (4 s), during which the joystick was immobilized at the origin by the electromagnet. Before mice started the training for the task, they were familiarized with an easier version of the task with a larger single target zone covering the whole angular range of the joystick. Thus, displacement of the joystick from the origin by approximately 6 mm in any direction was considered a target entry. The mice were trained in the easy task until they acquired reward in at least 70 trials of 100. This criterion was reached in 2 to 7 days. The main task was identical to the familiarization task except that the target zone was reduced to cover only 80% of the joystick’s dynamic range, excluding each edge area. Therefore, mice could not ride edges all the way to reach the target. Taking a further cautious step in our analysis, we excluded any trials during which movement was along an edge for more than half the target distance. The number of trials meeting the analysis inclusion criterion did not significantly change with training. All mice were presented with 100 trials per day for 60 days, except for mice that were trained only for the early or middle stage inactivation experiments.
Show full methods section
Animals
All procedures were in accordance with protocols approved by the University of California, San Diego Institutional Animal Care and Use Committee and the guidelines of the National Institutes of Health. Mice (6 weeks or older, male and female, calcium imaging: cross between CaMK2a-tTA [JAX 003010] and tetO-GCaMP6s [JAX 024742]; optogenetic inactivation: cross between PV-Cre [JAX 00869] and Ai32 [JAX 024109]) were housed in a room with a reversed light cycle (12 hours–12 hours). Experiments were performed during the dark period. Behavioral apparatus The behavioral apparatus was housed in a soundproof box (40 cm by 40 cm by 40 cm), and the joystick task was performed in the dark. The components of the task ( 17 ) included a joystick (M11L061P, CH Products) and a water port (with photodiodes to sense licking). The joystick handle was custom machined and fitted with a 1.6-mm-thick brass rod that mice manipulated with their left forepaw. An electromagnet (EM050-3-222, APW) mechanically immobilized the joystick at the origin during intertrial intervals. The joystick had a dynamic range of 5 cm in each of two directions. The two-dimensional position of the joystick was continuously recorded at 1 kHz using a data acquisition card (USB6008, National Instruments) and custom MATLAB software. The task sequence execution, auditory cue presentation, and reward dispensation were coordinated (and recorded) by an open source real-time Linux/MATLAB software package BControl ( http://brodywiki.princeton.edu/bcontrol/ ). Behavioral training of the joystick task In the joystick task, the joystick was released from the electromagnet immobilization at the beginning of each trial. Two seconds after the trial onset, a 6-kHz auditory tone was played. If mice moved the joystick into the target within 10 s from the auditory tone onset, then they received a reward, even in trials where they initiated movements before the auditory tone. The return of the joystick to the origin ended the trial and initiated an intertrial interval (4 s), during which the joystick was immobilized at the origin by the electromagnet. Before mice started the training for the task, they were familiarized with an easier version of the task with a larger single target zone covering the whole angular range of the joystick. Thus, displacement of the joystick from the origin by approximately 6 mm in any direction was considered a target entry. The mice were trained in the easy task until they acquired reward in at least 70 trials of 100. This criterion was reached in 2 to 7 days. The main task was identical to the familiarization task except that the target zone was reduced to cover only 80% of the joystick’s dynamic range, excluding each edge area. Therefore, mice could not ride edges all the way to reach the target. Taking a further cautious step in our analysis, we excluded any trials during which movement was along an edge for more than half the target distance. The number of trials meeting the analysis inclusion criterion did not significantly change with training. All mice were presented with 100 trials per day for 60 days, except for mice that were trained only for the early or middle stage inactivation experiments.
Movement analysis
Joystick position–related events and kinematic variables were defined and measured as described below. Movement onset: The first time at which the joystick velocity exceeded 20 mm/s continuously for 20 ms and the joystick moved at least 1.1 mm from the origin. Movement onset time: Time from the trial onset to movement onset. Target entry: The first time at which the joystick enters the target zone since the most recent departure from the origin. Target entry could occur more than once in a single trial. Target entry in the main text refers to the first target entry unless otherwise noted. Movement duration: Time from movement onset to the first target entry. Movement offset: The first time when the joystick velocity fell below 20 mm/s continuously for 20 ms since the final target entry. Trial-by-trial movement correlation: Correlation coefficient between the two joystick traces (the concatenated x and y position time series from −1 to 4 s from movement onset). The time window for the trajectory correlation analysis was chosen to cover the period from movement onset to movement offset for over 90% of all successful trials (90th percentile, 3.6 ms; 92.5th percentile, 4.0 ms). This time period may include return movements back to the start position after target entry. Path length: Velocity integrated from movement onset to the first target entry. Number of attempts: The number of peaks in the velocity trace from the movement onset to the first target entry.
Licking behavior
We recorded the licking behaviors of mice during the task using a custom infrared beam–based sensor placed in front of the lick port. By detecting the times at which the infrared beam was interrupted by a tongue protrusion, we created a time series of lick events. The lick event time series were aligned to the forelimb movement onset in each trial, spanning the same time period of M1 activity analysis (−1 to 4 s from movement onset). The similarity of lick patterns between trials was measured by computing the correlation coefficient between the movement onset aligned lick event time series. Inactivation experiment Mice ( PV-Cre::Ai32 ) used for inactivation experiments were implanted with head-bar and cranial windows over the forelimb region of M1 bilaterally (coordinates relative to bregma: ±1.5 mm lateral, +0.3 mm anterior). Following a minimum 3 days of recovery, daily water consumption was limited to a controlled volume (typically 1 ml/day). After 3 to 10 days of water restriction, the mice began behavioral training. For the early-stage inactivation experiment ( n = 13 mice), 3 days were randomly selected between days 4 and 8 for M1 inactivation and 3 other days between days 1 and 9 for head-bar control ( Fig. 2, A and B ). For the middle-stage inactivation ( n = 10 mice), 3 days were randomly selected between days 20 and 25 and 3 other days between days 19 and 26 for control. For expert-stage inactivation ( n = 13 mice), 3 days were randomly selected between days 61 and 69 and 3 others for control. Six mice were used for both early and late inactivation. Two mice were used for both early and middle inactivation. Five mice were used only for early-inactivation experiment. Eight mice were used only for middle-inactivation experiment. Seven mice participated only in the late-inactivation experiment. The mice were randomly assigned to early-, middle-, or late-inactivation groups. The cranial windows were cleaned with cotton swabs and ethanol and visually inspected for their clarity before each inactivation experiment began. In all mice, blood vessels and dura underneath the windows were visible with the naked eye. In M1 inactivation sessions, the distal ends of a bifurcated patch cord (Doric Lenses) were placed directly on the cranial windows, and blue LED light (465 nm, ~3.75 mW at each end, LEDC1-B_FC and LEDRV_1CH_1000, Doric Lenses) was delivered on a randomly selected 12% of trials. Head-bar day experiments were identical to the inactivation days except that the patch cord ends were placed ~1 mm above the head bar, away from the cranial windows. To control for any nonspecific light effects, we used light-on trials on the head-bar days as control trials in all our analyses. Longitudinal two-photon calcium imaging experiment Mice ( CaMK2-tTA::tetO-GCaMP6s ) used for imaging experiments were implanted with a head plate and a cranial window over the forelimb region of M1 on their right hemisphere, and then underwent the recovery and water restriction procedures described above. After 2 to 7 days of task familiarization as described in the section “Behavioral training of the joystick task,” we started imaging cortical activity with excitation at 925 nm from a Ti-Sa laser (Spectra-Physics) at ~28 frames/s using a two-photon microscope (B-SCOPE, Thorlabs). For each mouse, a single field of view in the forelimb region of M1 (covering 472 μm by 508 μm at a depth of approximately 250 μm beneath the dura in layer 2/3) was longitudinally imaged over the course of 60-day training. Although a single field of view was imaged throughout the experiment, data from each day were processed independently without limiting our analyses to neurons present in all days. Only the imaging days with satisfying image clarity and no other technical issues were analyzed (54 ± 3 days, mean ± SD across five mice). Single-cell activity Using a custom MATLAB program, fluorescence images were aligned frame by frame to compensate for lateral motions post hoc ( 38 ). Regions of interest (ROIs) were manually drawn on the motion-corrected fluorescence images, by circumscribing the cell bodies based on their GCaMP fluorescence intensity distinguishable from the background. Pixels inside each ROI were considered as a single soma, whereas pixels extending radially outward from the cell boundary by 2 to 6 pixels were considered background. For each ROI, we subtracted 70% of the average background pixel intensity from the average soma pixel intensity at each frame as the fluorescence signal of the ROI. The fluorescence signals were transformed to dF/F following the procedure in the previous study ( 17 ) and then further transformed into an estimate of spike rates using the spike-triggered mixture model ( https://github.com/lucastheis/c2s ) ( 39 ). Signal-to-noise ratio For each ROI, we first computed the mean (μ) and SD (σ) of its fluorescence signal, and detected all calcium events using MATLAB function findpeaks. In this function, the minimum peak height was set to be μ + 2σ, and the minimum distance between adjacent peaks was set to be 10 frames (~350 ms). Surrounding each detected peak, we delimited its event period as the time period in which the fluorescence signal was continuously above μ. We treated the signal outside the event periods as noise. Using the detected peak heights and noise, we computed SNR for each ROI as the following: SNR = mean ( peak heights ) − mean ( noise ) SD ( noise ) .
Trial-to-trial population activity correlation
The population activity correlation between two trials was the correlation coefficient between the two concatenated activity time series (−1 to 4 s from movement onset) of a population of neurons ( Fig. 3E ). Since the number of neurons in a population varies across days and animals ( Fig. 4D ), we matched the population size by randomly subsampling 50 neurons and computed the trial-to-trial correlation of the 50-neuron population activity. The subsampling process was repeated 100 times, and the average across 100 trial-to-trial correlations was used for the given population. Relationship between movements and population activity For each pair of trials, we computed the correlation coefficients between the movement trajectories and between the population activity (population size matched as described above) in each day. Pairs of trials in a 3-day bin were pooled together, and 1000 pairs were randomly sampled. The 1000 pairs were binned into nine intervals based on movement correlation, two boundary and seven intermediate intervals between −1 and 1 ( Fig. 5A ). The lower boundary interval included all the pairs in which movement correlation was less than 0.05, the upper boundary interval included all the pairs with movement correlation greater than or equal to 0.75, and the intermediate intervals were uniformly spaced between 0.05 and 0.75. Movement-related neurons For each neuron, we tested whether the distribution of its movement period activity was significantly different from that of baseline activity using Wilcoxon rank sum test ( P < 0.01). We defined baseline as the 0.5-s period before trial onset. A wide range of movement periods were examined, ranging from 0.5- to 4-s windows after movement onset. A similar and significant trend was seen across all different time windows, except that a decrease in the fraction during the later phase was statistically significant up to 1 s. Data presented in fig. S6 are from the 0.5-s window.
Extracellular electrophysiology
Extracellular recordings were performed similar to those previously described ( 40 ). Adult mice ( PV-Cre::Ai32 , n = 2), 6 weeks or older were anesthetized with urethane (1.2 g/kg, intraperitoneal) and given the sedative chlorprothixene (0.05 ml of 4 mg/ml, intramuscular) and implanted with a T-shaped head bar for head fixation. Body temperature was maintained at 37°C using a feedback-controlled heating pad (40-90-8D, FHC Inc.). A uniform layer of silicone oil was applied to the eyes to prevent drying. A craniotomy ~1 mm in diameter was made over the middle of V1 (~2.75 mm lateral to the midline and ~0 mm anterior to the lambda suture), and sterile saline was placed in the well of the craniotomy to keep the brain moist. A 16-channel linear silicon probe (a1x16-5 mm-25-177, NeuroNexus) mounted on a manipulator (Luigs & Neumann) was slowly advanced into the brain to a depth of ~750 μm. Recordings were started 20 min after insertion of the probe into V1. Signals were amplified 400-fold, band-pass–filtered (0.3 to 5000 Hz, with the presence of a 60-Hz notch filter, A-M Systems 3600), and then digitized at 32 kHz (PCIe-6259, National Instruments) with custom MATLAB software. Visual stimulus was presented across three computer monitors (VX2450wm-LED, 60-Hz refresh rate, gamma corrected, ViewSonic) mounted orthogonally to each other to form a square enclosure that covered ~270° of the visual field along the azimuth. The mouse head was immobilized at the center of the enclosure. Visual stimuli were generated using Psychtoolbox. The gratings drifted clockwise or counterclockwise in an oscillatory manner (amplitude ± 5°; grating spatial frequency, 0.08 cycles per degree; oscillation frequency, 0.4 Hz; contrast, 100%; mean luminance, 40 cd/m 2 ). Trials were spaced by an interstimulation interval of 8 s. Optogenetic stimulation of V1 was accomplished by shining 470-nm blue light through an optical fiber pointed at V1. We recorded from V1 using three different blue light intensities: 3.5, 7.0, and 10.5 mW. Blue light intensities were varied in separate blocks of trials (i.e., 100 trials of 3.5 mW, followed by 100 trials of 7.0 mW). During optogenetic cortical inactivating trials, 10 s of blue-light stimulation were applied in the middle of 12 s of visual stimulus. Trials of cortical inactivation (light on) were interleaved with control trials (light off).
Multiunit analysis
Multiunit activity was isolated using spike-sorting software in MATLAB as previously described ( 40 ). The raw extracellular signal was band-pass–filtered between 0.5 and 10 kHz. Spiking events were detected with a threshold of 3.5 times the SD of the filtered signal. Spike waveforms of four adjacent electrode sites were clustered using a k -means algorithm. Multiunit spiking activity was defined as all spiking events exceeding the detection threshold after the removal of electrical noise or movement artifacts by the sorting algorithm. Individual spiking events were assigned to one of the 16 recording sites according to where they showed the largest amplitude. Video analysis of forelimb movements Mice performing the task were video recorded at the rate of 30 frames/s, with the resolution of ~0.15 mm per pixel (DMK 23U618, Imaging Source). Five points of interest (POIs) that we tracked in each frame were the tip positions of the three digits on the radial side (analogous to index, middle, and ring fingers) of the left paw and the two end points of the linear joystick bar. Lighting conditions and camera angles slightly differed across days, so we manually sorted all recording days into five groups, each with similar recording settings, and built a deep neural network model separately for each group. In each group, we first randomly selected 180 frames and manually labeled POIs in those frames and used them to train and test a neural network model implemented in DeepLabCut ( 23 ). The trained model tracked the POIs in the test data with an average tracking error of less than 2.5 pixels. Applying the trained model to unlabeled frames produced the POIs and the strength of evidence (range, 0 to 100) for each POI in each frame. Then, in each frame, we identified the closest digit from the line between the two end points of the joystick and deemed the frame as high confidence if the strength of evidence for the identified digit was greater than 74. On the basis of this criterion, 94% of frames were classified as high confidence. In each high-confidence frame, we calculated the distance between the closest digit and the joystick bar. The distances in low-confidence frames were linearly interpolated using the nearest high-confidence frames. On a given trial, we declared a grip loss if the distance was greater than 20 pixels (~3 mm) for at least 15 consecutive frames (0.5 s). In very rare trials that included more than 10 consecutive low-confidence frames (~ 2%), grip losses were manually scored.
Statistical analysis
For within-condition comparisons, we applied either a Wilcoxon signed-rank test or Student t test on a set of paired values from each animal (e.g., control versus inactivation trials in early-stage inactivation), depending on the result of Lilliefors goodness-of-fit test with the null hypothesis that the data were normally distributed ( P < 0.05 was used for the rejection of the null hypothesis). For effect size comparisons between conditions (early-stage inactivation versus late-stage inactivation), we applied a Wilcoxon rank sum test or two-sample t test as the two samples were not from identical sets of animals.
Supplementary Material http://advances.sciencemag.org/cgi/content/full/5/10/eaay0001/DC1 Download PDF Disengagement of motor cortex from movement control during long-term learning
📊 Figures
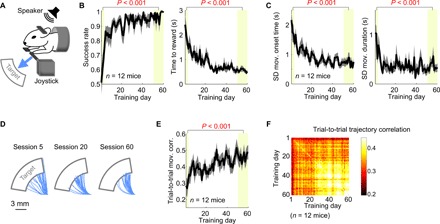
Fig. 1
Task performance and movement consistency improve over long-term training in the joystick task.
( A ) The joystick task setup. The mouse is required to move the joystick into the target upon the auditory go cue to receive a water reward. ( B ) The success rate (i.e., fraction of trials that acqu...
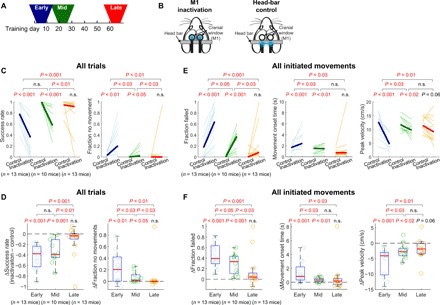
Fig. 2
M1 inactivation effects on movements gradually decline during long-term training.
( A ) Inactivation/head-bar control experiments in the early (days 1 to 9), mid (days 19 to 26), or late learning stage (days 61 to 69). ( B ) M1 inactivation and head-bar control days were randomly i...
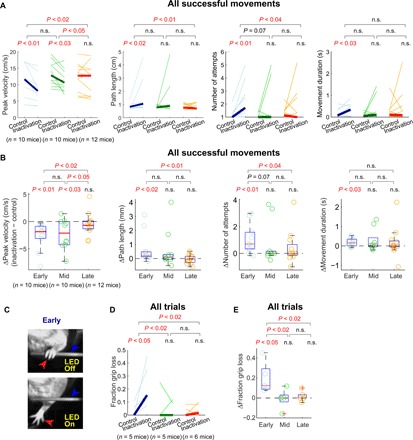
Fig. 3
M1 inactivation affects successful movements and grips on the joystick at the early stage.
( A ) Inactivation effects on movements that successfully entered the target. The peak velocity, path length, number of attempts to reach the target, and movement duration, in control versus inactivat...
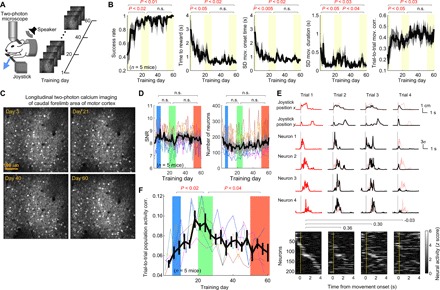
Fig. 4
M1 population activity consistency evolves in two phases over long-term training.
( A ) Longitudinal imaging of the neurons in the same field in M1 over the course of 60-day training in the joystick task. ( B ) Task performance and movement consistency during the 60-day training in...
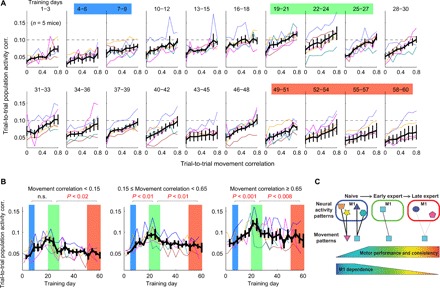
Fig. 5
The relationship between M1 activity and movements varies with learning stages.
( A ) The relationship between trial-to-trial movement trajectory correlation and population activity correlation over the 60-day training (bin size: 3 days). The x axis represents the movement correl...
Figure images are served from the NIH/NLM PubMed Central Open Access Subset or Europe PMC; copyright remains with the publishers and authors.
💬 Discussion
0 commentsNo comments yet. Be the first to start a discussion!
Leave a Comment