Abstract
BACKGROUND: The biological effects of nanoparticles depend on several characteristics such as size and shape that must be taken into account in any type of assessment. The increased use of titanium dioxide nanoparticles (TiO2NPs) for industrial applications, and specifically as a food additive, demands a deep assessment of their potential risk for humans, including their abilities to cross biological barriers. METHODS: We have investigated the interaction of three differently shaped TiO2NPs (nanospheres, nanorods and nanowires) in an in vitro model of the intestinal barrier, where the coculture of Caco-2/HT29 cells confers inherent intestinal epithelium characteristics to the model (i.e. mucus secretion, brush border, tight junctions, etc.). RESULTS: Adverse effects in the intestinal epithelium were detected by studying the barrier's integrity (TEER), permeability (LY) and changes in the gene expression of selected specific markers. Using Laser Scanning Confocal Microscopy, we detected a different behaviour in the bio-adhesion and biodistribution of each of the TiO2NPs. Moreover, we were able to specifically localize each type of TiO2NPs inside the cells. Interestingly, general DNA damage, but not oxidative DNA damage effects, were detected by using the FPG version of the comet assay. CONCLUSIONS: Results indicate different interactions and cellular responses related to differently shaped TiO2NPs, nanowires showing the most harmful effects.
🔬 Techniques
🔭 Microscopes
✨ Fluorophores
🧪 Sample Preparation
🔬 Cell Lines
🏭 Microscope Brands
🧪 Reagent Suppliers
💻 Software Details
🏛️ Research Organizations (ROR)
Affiliated research institutions:
📋 Methods
We have investigated the interaction of three differently shaped TiO 2 NPs (nanospheres, nanorods and nanowires) in an in vitro model of the intestinal barrier, where the coculture of Caco-2/HT29 cells confers inherent intestinal epithelium characteristics to the model (i.e. mucus secretion, brush border, tight junctions, etc.).
Electronic supplementary material The online version of this article (10.1186/s12989-018-0269-x) contains supplementary material, which is available to authorized users.
Methods Nanomaterial dispersion and characterization
Three different shapes of titanium dioxide nanoparticles (TiO 2 NPs), pure anatase crystal-structure nanospheres of TiO 2 (< 25 nm, TiO 2 NPs-S), pure rutile crystal-structure nanorods of TiO 2 (< 100 nm of diameter, and about 250 nm of length, TiO 2 NPs-R), and nanowires of TiO 2 (< 10 nm of diameter and 100 μm of length, TiO 2 NPs-W) were purchased from Sigma Chemical Co. (St. Louis, MO). To disperse them, TiO 2 NPs were pre-wetted in 0.5% absolute ethanol and suspended in 0.05% filtered bovine serum albumin (BSA) dissolved in autoclaved MilliQ water. TiO 2 NPs were sonicated in their dispersion medium for 16 min at 10% of amplitude obtaining a dispersed stock of 2.56 mg/mL, according to the Nanogenotox protocol [ 24 ]. A complete characterization of the three TiO 2 NPs was carried out to see their behaviour in the cell culture medium used. First, transmission electron microscopy (TEM) was used to determine the dried nanoparticle’s size and morphology on a JEOL JEM-1400 instrument (Jeol LTD, Tokyo, Japan). For this purpose, grids covered with Holey carbon film were immersed carefully in each NPs stock (2.56 mg/mL) and left to dry. Then, TEM images of random fields of view were processed with Image J software to measure and calculate the diameter of 200 NPs. Moreover, the hydrodynamic size and ζ-potential of the three TiO 2 NPs diluted in DMEM cell culture medium (12.5, 50, 100 and 350 μg/mL) were evaluated at 0, 24 and 48 h after sonication by dynamic light scattering (DLS) and laser Doppler velocimetry (LDV) methodologies in a Malvern ZetasizerNano-ZS zen3600 device (Malvern, UK).
Show full methods section
We have investigated the interaction of three differently shaped TiO 2 NPs (nanospheres, nanorods and nanowires) in an in vitro model of the intestinal barrier, where the coculture of Caco-2/HT29 cells confers inherent intestinal epithelium characteristics to the model (i.e. mucus secretion, brush border, tight junctions, etc.).
Electronic supplementary material The online version of this article (10.1186/s12989-018-0269-x) contains supplementary material, which is available to authorized users.
Methods Nanomaterial dispersion and characterization
Three different shapes of titanium dioxide nanoparticles (TiO 2 NPs), pure anatase crystal-structure nanospheres of TiO 2 (< 25 nm, TiO 2 NPs-S), pure rutile crystal-structure nanorods of TiO 2 (< 100 nm of diameter, and about 250 nm of length, TiO 2 NPs-R), and nanowires of TiO 2 (< 10 nm of diameter and 100 μm of length, TiO 2 NPs-W) were purchased from Sigma Chemical Co. (St. Louis, MO). To disperse them, TiO 2 NPs were pre-wetted in 0.5% absolute ethanol and suspended in 0.05% filtered bovine serum albumin (BSA) dissolved in autoclaved MilliQ water. TiO 2 NPs were sonicated in their dispersion medium for 16 min at 10% of amplitude obtaining a dispersed stock of 2.56 mg/mL, according to the Nanogenotox protocol [ 24 ]. A complete characterization of the three TiO 2 NPs was carried out to see their behaviour in the cell culture medium used. First, transmission electron microscopy (TEM) was used to determine the dried nanoparticle’s size and morphology on a JEOL JEM-1400 instrument (Jeol LTD, Tokyo, Japan). For this purpose, grids covered with Holey carbon film were immersed carefully in each NPs stock (2.56 mg/mL) and left to dry. Then, TEM images of random fields of view were processed with Image J software to measure and calculate the diameter of 200 NPs. Moreover, the hydrodynamic size and ζ-potential of the three TiO 2 NPs diluted in DMEM cell culture medium (12.5, 50, 100 and 350 μg/mL) were evaluated at 0, 24 and 48 h after sonication by dynamic light scattering (DLS) and laser Doppler velocimetry (LDV) methodologies in a Malvern ZetasizerNano-ZS zen3600 device (Malvern, UK).
Cell culture and the in vitro coculture model
The human colorectal adenocarcinoma cell line Caco-2 was kindly provided by Dr. Isabella Angelis, from Istituto Superiore di Sanità (ISS, Italia). HT29, another human cell line derived from a colorectal adenocarcinoma, was purchased from American Type Culture Collection (ATCC, Manassas VA 20108 USA). Both cell lines were maintained in Dulbecco’s modified Eagle’s High Glucose medium without pyruvate (DMEM w/o pyruvate, Life Technologies NY) supplemented with 10% fetal bovine serum (FBS), 1% non-essential amino acids (NEAA) (PAA Laboratories GmbH, Pasching, Austria) and 2.5 mg/mL plasmocin (Invivo Gen, San Diego, CA). Cells were placed in a humidified atmosphere of 5% CO 2 and 95% air at 37 °C. Routinely, Caco-2 and HT29 cell lines were subcultured once a week with 1% trypsin-EDTA (PAA Laboratories GmbH, Pasching, Austria) at 7.5 × 10 5 cells/flask and 4 × 10 5 cells/flask, respectively, in 75 cm 2 flask. The in vitro coculture model was seeded in 12-well culture plates using a Polyethylene Terephthalate Transwell® (PET) insert with 1 μm pore size and an area of 1.12 cm 2 (Millipore®) (Merck KGaA, Darmstadt, Germany). Briefly, 1.7 × 10 5 Caco-2 and HT29 cells clones were mixed and seeded on the apical side of the transwell in a ratio of 90:10, respectively. Finally, Caco-2/HT29 cocultures were left to differentiate for 21 days and the cell culture medium was changed every 3 days. As indicated in Additional file 1 : Figure S1, the Caco-2/HT29 barrier shows a structure similar to the one constituted by Caco-2 monocultures, without relevant overgrown. Viability studies To choose the range of sub-toxic doses to be used in our studies, an initial toxicity study was carried out. Cell viability was determined by the Beckman counter method with a ZTM Series coulter-counter (Beckman Coulter Inc., CA). Twenty-one days-old Caco-2/HT-29 cocultures were exposed for 24 and 48 h to different concentrations of TiO 2 NPs-S, −R and –W, ranging from 0 to 350 μg/mL. After exposure to the given NPs, barriers were washed three times with 0.5 mL of PBS (1%) and incubated 4 min at 37 °C with 0.25 mL of trypsin-EDTA 1%, to detach and individualize the cells. Finally, cells were diluted in ISOTON solution (1/100) and counted with the Beckman Cell Counter. Viability values for each concentration were calculated by averaging three independent viability experiments, each containing three replicates per sample ( n = 9). Evaluation of the barrier’s integrity in the in vitro coculture model To monitor the formation of the differentiated barrier and its integrity, its trans-epithelial electrical resistance (TEER) was measured weekly with a Voltmeter (Millicell-ERS volt/ohm meter). TEER was measured 7, 14 and 21 days after seeding Caco-2/HT29 in PET transwells. Caco-2/HT29 cocultures with TEER values higher than 200 Ω/cm 2 were used for further experiments. TEER values were also measured after TiO 2 NPs-S, TiO 2 NPs-R, and TiO 2 NPs-W exposure for 24 and 48 h. Briefly, after NPs exposure, the apical and basolateral chambers of the barriers were washed three times with PBS (1%) to remove the NPs as much as possible and fresh DMEM cell culture medium was placed again in the transwells. Each sample was measured three times in different parts of the insert before and after NPs exposure. TEER values for each concentration were calculated by averaging three independent experiments. TEER values were calculated according to the formula TEER = [Ω (cell inserts) - Ω (cell-free inserts)] × 1.12 cm 2 . Paracellular transport through the coculture barrier To support the integrity studies of the Caco-2/HT29 barrier, the paracellular passage of Lucifer yellow (LY) was analyzed. Briefly, after 24 and 48 h of exposure to the different TiO 2 NPs, barriers were washed three times with transport buffer (HBSS; Ca 2+ , Mg 2+ , + 10 mM HEPES, pH 7.4). The inserts were transferred to a new 12-well plate with 1.5 mL of HBSS in the basolateral compartment. LY diluted in HBSS was added to the apical compartment at a final concentration of 0.4 mg/mL and plates were then placed in a 37 °C incubator for 2 h. One hundred μL of each basal compartment was transferred in triplicates to a black 96-well plate. LY leakage through the barrier was measured in a prompt fluorimeter (Victor III, Perkin Elmer) plate reader using a 405–535 nm excitation-emission spectrum. TiO 2 NPs localization by confocal microscopy Laser Confocal Microscopy has demonstrated to be a useful method for localizing metallic NPs inside cells [ 25 ]. This method was used to visualize and locate the three different TiO 2 NPs through the cocultured barrier. For this purpose, Caco-2/HT29 barriers were exposed to 150 μg/mL of TiO 2 NPs-S, −R and -W for 24 and 48 h. After the exposure time, barriers were stained in situ with Hoechst 33,351 and WGA Alexa Fluor™ , diluted in DMEM cell culture medium at concentrations of 1/500 and 1/100, respectively, for 15 min. Images were obtained by using a confocal laser scanning microscope Leica TC2 SP5. The three types of TiO 2 NPs were visualized thanks to their own reflective capability and manually masked with green colour, in contrast with the blue colour of the cells’ nucleus and the red colour or the extracellular membrane and the mucus layer. Confocal images were processed with the software Huygens Essential 4.4.0p6 (Scientific Volume Imaging, Netherlands), and Imaris 7.2.1 (Bitplane, AG). TiO 2 NPs transport across the Caco-2/HT29 coculture barrier To detect the TiO 2 NPs crossing through the Caco-2/HT29 barriers, laser confocal microscopy was also used. To discern if TiO 2 NPs’ transport was shape-, concentration- or time-dependent, coculture barriers were exposed to different concentrations (12.5, 50, 100, and 350 μg/mL) of TiO 2 NPs-S, −R and -W for 24 and 48 h. After the NPs’ exposure, the cell culture medium (1.5 mL) in the basolateral compartment was collected. To eliminate the inorganic material aggregates and crystallized proteins, samples were treated with proteinase K (100 μg/mL) during 30 min at 37 °C. Next, samples were centrifuged in a speed vacuum at 37 °C for 2 h to concentrate the NPs present in the medium. Finally, 10 μL of each sample was placed in slides, covered with a cover-slip, and the NPs were observed under the confocal microscopy. Several images were taken from random fields of each sample. Confocal images were processed with Huygens Essential 4.4.0p6 (Scientific Volume Imaging, Netherlands) and Imaris 7.2.1 (Bitplane, AG) softwares, where the percentage of the reflective area of each sample was calculated. Semi-quantitative values were obtained from three different experiments.
RNA extraction and gene expression by real-time qPCR Total
RNA from Caco-2/HT29 coculture barriers exposed to 0, 50 and 150 μg/mL of TiO 2 NPs-S, −R and –W, for 24 and 48 h, was extracted using TRIzol® Reagent (Invitrogen, USA) following the manufacturer’s instructions. RNase-free DNase I (DNA-free TM kit; Ambion, UK) was used to discard residual DNA contamination. The first-strand cDNA synthesis kit (Roche, Basel, Switzerland) was used to obtain cDNA from 100 ng of total RNA. The resulting cDNA was subjected to real-time PCR analysis on a LightCycler-480 to evaluate the relative expression of the brush border enzymes sucrase-isomaltase, alkaline phosphatase, and solute carrier family. Gene expression of tight junction components such as claudin 2 , zonula occludens , and occludin . The expression of β-actin was used as the housekeeping control. The primer sequences are summarized as a table in Additional file 1 : (Table S1). Each 20 μL of reaction volume contained 5 μL cDNA, 10 μL of 2× LightCycler 480 SYBR Green I Mater (Roche, Germany), 3 μL of distilled H 2 O and 1 μL of each primer pairs at a final concentration of 10 μM. The cycling parameters were the following: an initial step of 95 °C for 5 min, then 45 cycles of 95 °C for 10 s, 62 °C for 15 s and 72 °C for 25 s. Cycle time (Ct) values were calculated with the LightCycler 480 software package and then normalized with β-Actin Ct values.
Genotoxic and oxidative DNA damage quantification
The potential induction of genotoxic and oxidative DNA damage in Caco-2/HT29 coculture barriers was assessed by the alkaline comet assay after 24 and 48 h of exposure to TiO 2 NPs-S, −R, and W treatments. The concentration-range was 0, 12.5, 50, 150, and 350 μg/mL for all the TiO 2 -shapes. The addition of formamidopyrimidine-DNA glycosylase (FPG enzyme) was used to measure oxidatively-damaged DNA bases. The used FPG was a gift from Prof. Andrew Collins (University of Oslo). Briefly, once treated, barriers were washed twice with PBS, trypsinized (1% trypsin), and centrifuged at 1000 rpm for 8 min. The pellet was then resuspended in PBS to a concentration of 700 cells/μL and placed in ice at 4 °C, to avoid DNA repair. 25 μL of cells’ suspension was mixed with 0.75% of LMP agarose at 37 °C and dropped (7 μL/drop and 3 drops/sample) on Gelbond (GB) films. Cells on GB were lysed in lysis buffer at 4 °C and pH 10 overnight. The next morning, GB were washed twice (1 × 5 min, and 1 × 50 min) in enzyme buffer at 4 °C and pH 8.0, followed by a 30 min incubation with the enzyme buffer at 37 °C. One GB was incubated with enzyme buffer and FPG enzyme (1/10.000), and the other in enzyme buffer without FPG. GB were incubated with electrophoresis buffer (alkaline buffer) for 35 min followed by the electrophoresis step for 20 min at 20 V and 300 mA at 4 °C. Finally, GB were rinsed twice in cold PBS for 5 min, in distilled water for 1 min, fixed in absolute ethanol for at least 2 h, air-dried overnight at room temperature, and stained with SYBR Gold for 20 min. Each GB film was cut into two similar-sized parts to fit in an acrylic slide (52.5 × 75 × 3 mm). A coverslip of 52.5 × 75 mm was placed on top of the drops, effectively sealing the samples. GB were observed using an epifluorescent Olympus BX50 and damage was quantified measuring the percentage of DNA in tail by using the Komet 5.5 Image analysis software. One hundred randomly-selected comet images were analyzed per sample. 30 min treatments of 5 mM of potassium bromate (KBrO 3 ) and 2.5 mM of methylmethanesulfonate (MMS) were used as positive control of oxidative and genotoxic damage, respectively.
Statistical analysis
All measurements were made in triplicates, at least for 2 separate experiments. Results are expressed as mean ± standard error. One-way ANOVA with Tukey’s post-test, unpaired and paired Student’s t -test or two-way ANOVA were used to compare differences between means. Data were analyzed with GraphPad Prism version 5.00 for Windows (GraphPad Software, San Diego California USA, http://www.graphpad.com ). Differences between means were considered significant at P < 0.05.
Nanomaterial dispersion and characterization
Three different shapes of titanium dioxide nanoparticles (TiO 2 NPs), pure anatase crystal-structure nanospheres of TiO 2 (< 25 nm, TiO 2 NPs-S), pure rutile crystal-structure nanorods of TiO 2 (< 100 nm of diameter, and about 250 nm of length, TiO 2 NPs-R), and nanowires of TiO 2 (< 10 nm of diameter and 100 μm of length, TiO 2 NPs-W) were purchased from Sigma Chemical Co. (St. Louis, MO). To disperse them, TiO 2 NPs were pre-wetted in 0.5% absolute ethanol and suspended in 0.05% filtered bovine serum albumin (BSA) dissolved in autoclaved MilliQ water. TiO 2 NPs were sonicated in their dispersion medium for 16 min at 10% of amplitude obtaining a dispersed stock of 2.56 mg/mL, according to the Nanogenotox protocol [ 24 ]. A complete characterization of the three TiO 2 NPs was carried out to see their behaviour in the cell culture medium used. First, transmission electron microscopy (TEM) was used to determine the dried nanoparticle’s size and morphology on a JEOL JEM-1400 instrument (Jeol LTD, Tokyo, Japan). For this purpose, grids covered with Holey carbon film were immersed carefully in each NPs stock (2.56 mg/mL) and left to dry. Then, TEM images of random fields of view were processed with Image J software to measure and calculate the diameter of 200 NPs. Moreover, the hydrodynamic size and ζ-potential of the three TiO 2 NPs diluted in DMEM cell culture medium (12.5, 50, 100 and 350 μg/mL) were evaluated at 0, 24 and 48 h after sonication by dynamic light scattering (DLS) and laser Doppler velocimetry (LDV) methodologies in a Malvern ZetasizerNano-ZS zen3600 device (Malvern, UK).
Additional file Additional file 1: Table S1. Primer sequences. Table S2. Interconversion of the used concentrations. The relationships between μg/mL and μg/cm 2 are indicated. Figure S1. Monolayer confirmation of the intestinal in vitro model, Caco-2/HT29. Transversal cuts of the Caco-2/HT29 barrier stained in Alcian Blue (A and C). Transversal cuts of Caco-2 monocultures (B and D) stained in Hematoxylin and Eosin. Figure S2. Dynamic light scattering characterization of the NP’s over the incubation time. Hydrodynamic size for TiO 2 NPs-S (A), TiO 2 NPs-R (B), and TiO 2 NPs-W (C), suspended in DMEM cell culture medium at concentrations ranging from 12.5 to 350 μg/mL. Bars that do not share any letter are significantly different according to the one-way ANOVA with a Tukey’s post-test ( P < 0.05). Data is represented as mean ± SD. Figure S3. Three-dimensional confocal image of the Caco-2/HT29 co-culture exposed to 150 μg/mL of TiO 2 NPs-Wires. Cell nuclei (blue) were stained with Hoechst and mucus (red) stained with WGA. NPs were visualized by reflection and marked with a green mask. NPs-cell nucleus interactions are indicated with white circles. Images were processed with the Imaris 7.2.1 software. Figure S4.
Confocal images of the reflected
NPs found in the collected basolateral medium after exposing the Caco-2/HT29 co-culture barrier to 150 μg/mL of TiO 2 NPs. (DOCX 3832 kb)
Availability of data and materials The data supporting our conclusions is included in the main body of the manuscript.
📊 Figures
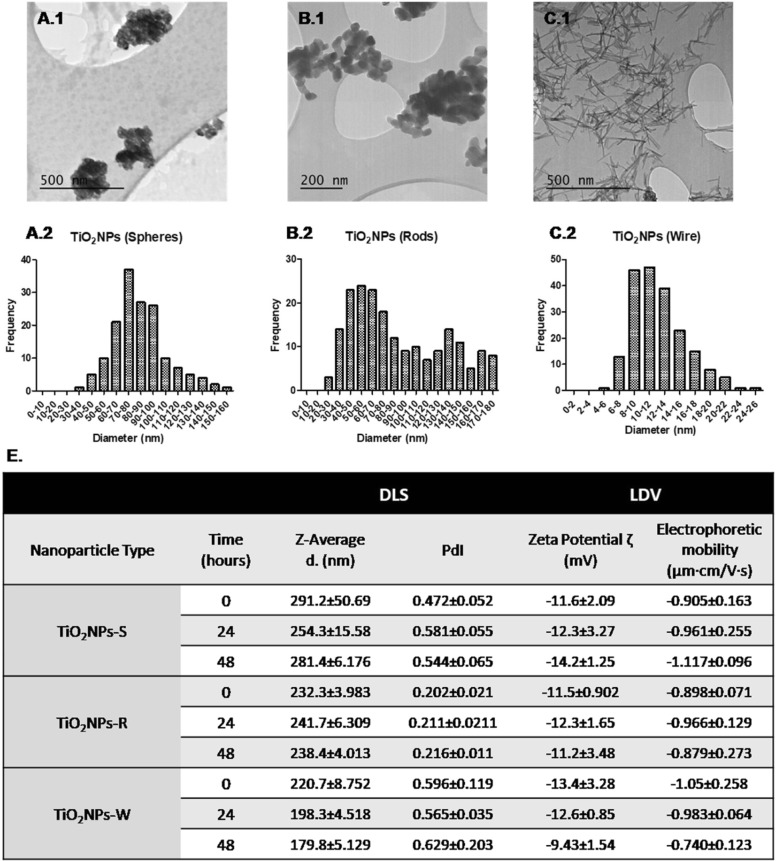
Fig. 1
TiO 2 NPs characterization. TEM images of TiO 2 NPs-S ( A.1 ), TiO 2 NPs-R ( B.1 ), and TiO 2 NPs-W ( C.1 ) in their dry form. Size distribution of TiO 2 NPs-S ( A.2 ), TiO 2 NPs-R ( B.2 ), and TiO 2 ...
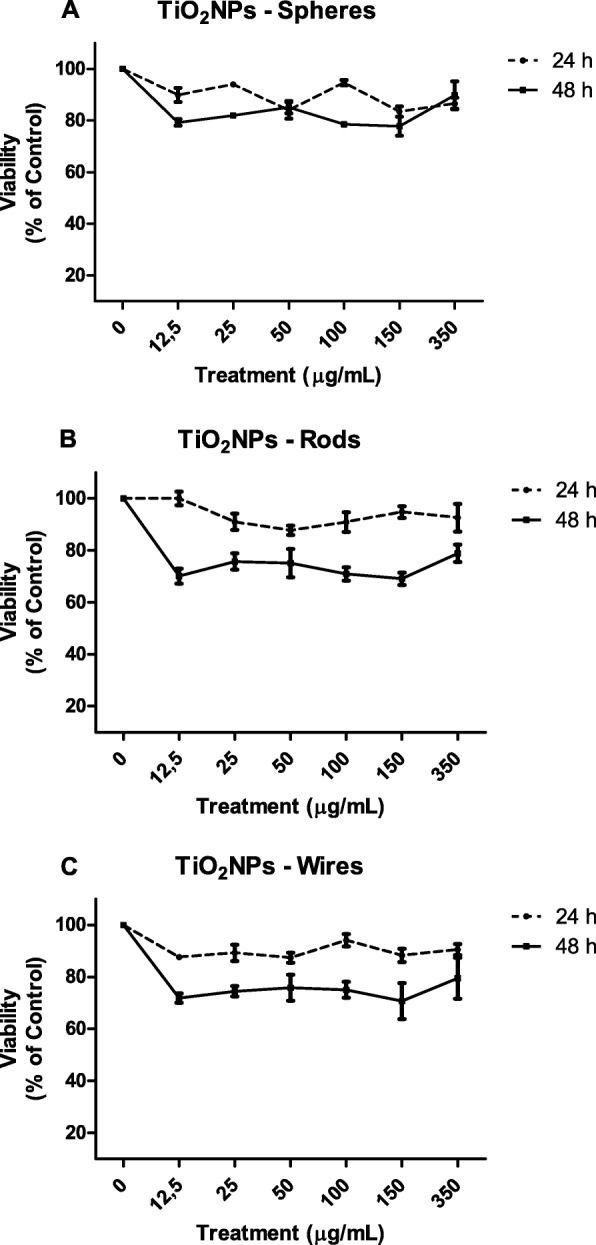
Fig. 2
Cell viability (% of control) of Caco-2/HT29 co-culture barrier treated with 0u2013350u00a0u03bcg/mL of TiO 2 NPs-S ( a ), TiO 2 NPs-R ( b ), and TiO 2 NPs-W ( c ) for 24 or 48u00a0h. Results were ana...
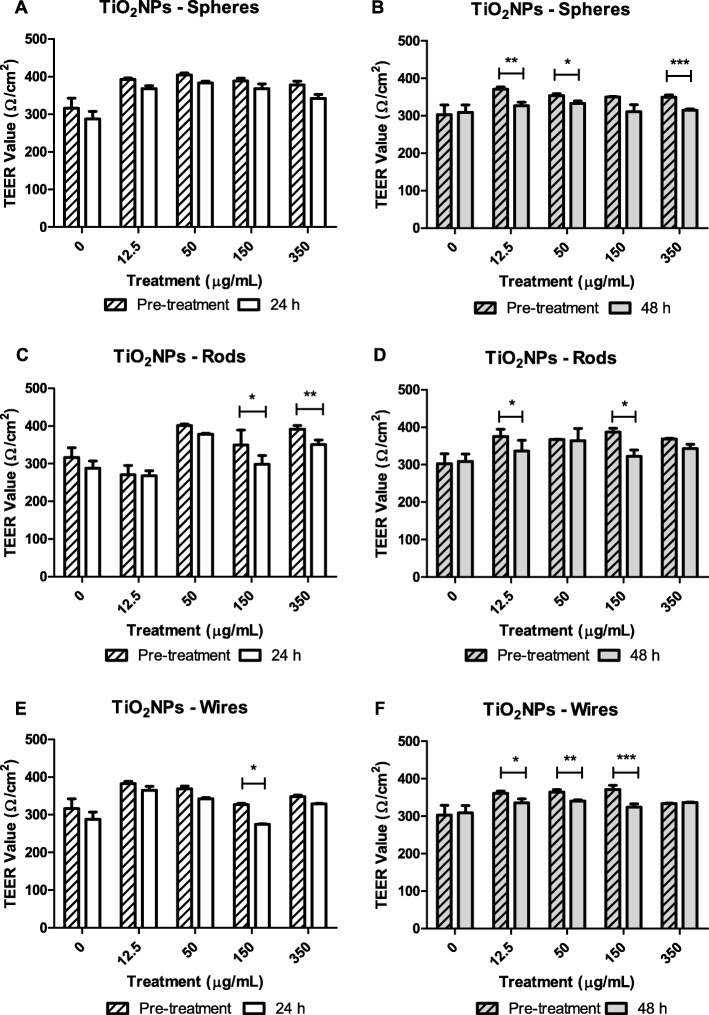
Fig. 3
TEER measurements of Caco-2/HT29 co-culture barriers before and after 24 and 48u00a0h of exposure to TiO 2 NPs-S ( a and b ), TiO 2 NPs-R ( c and d ), and TiO 2 NPs-W ( e and f ). Results were analyze...
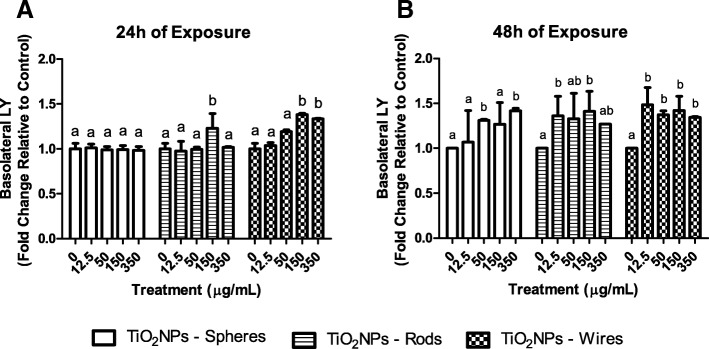
Fig. 4
Percentage of LY found in the basolateral chamber of the transwell. The paracellular transport of LY was measured after treating the Caco-2/HT29 co-culture barriers with TiO 2 NPs-S, TiO 2 NPs-R, and ...
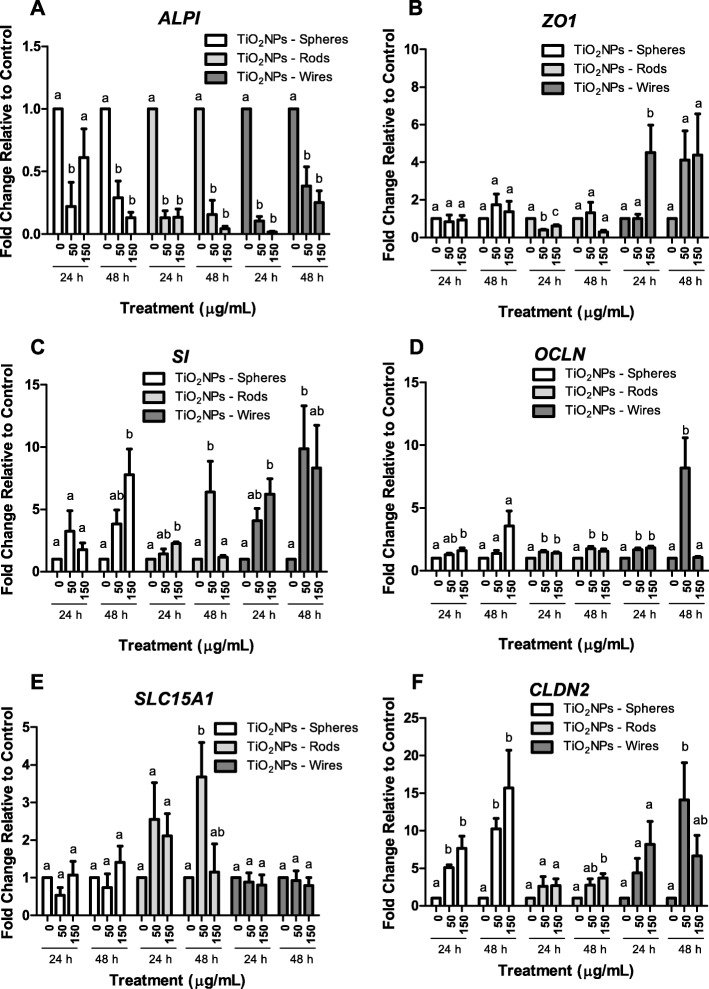
Fig. 5
Gene expression of Caco-2/HT29 molecular markers in response to 24 or 48u00a0h of TiO 2 NPs-S, TiO 2 NPs-R, and TiO 2 NPs-W exposure. Results represented as meanu2009u00b1u2009SEM. Bars that do not sh...
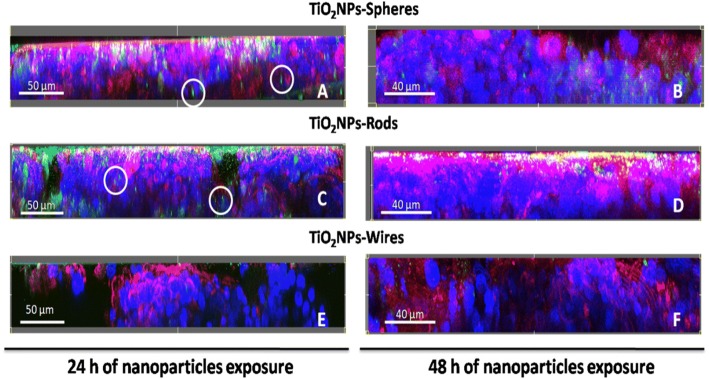
Fig. 6
Confocal microscope z-scans of Caco-2/HT29 co-culture barriers after TiO 2 NPs-S ( a and b ), TiO 2 NPs-R ( c and d ), and TiO 2 NPs-W ( e and f ) exposures lasting for 24u00a0h ( a , c and e ), or 48...
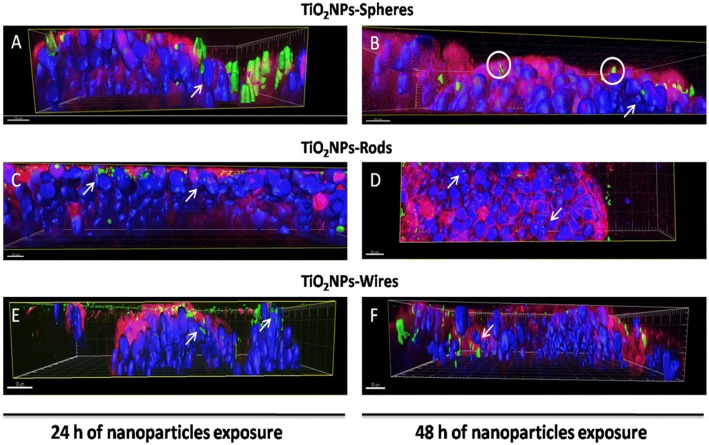
Fig. 7
Three-dimensional confocal images of the Caco-2/HT29 co-culture barriers z -scans from Fig. 6 . Images were taken after exposures of 24 or 48u00a0h to TiO 2 NPs-S ( a and b ), TiO 2 NPs-R ( c and d ),...
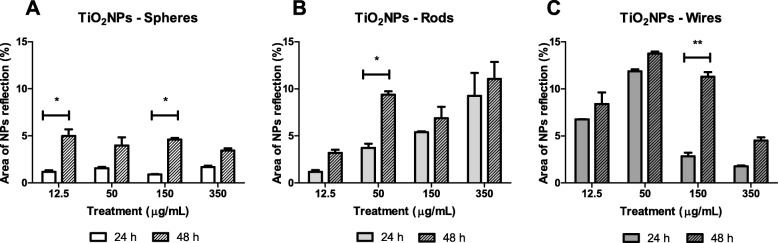
Fig. 8
Percentage of the TiO 2 NPs-reflective area of the basolateral chamber of the transwell. The transport of TiO 2 NPs-S ( a ), TiO 2 NPs-R ( b ), and TiO 2 NPs-W ( c ) across the Caco-2/HT29 co-culture ...
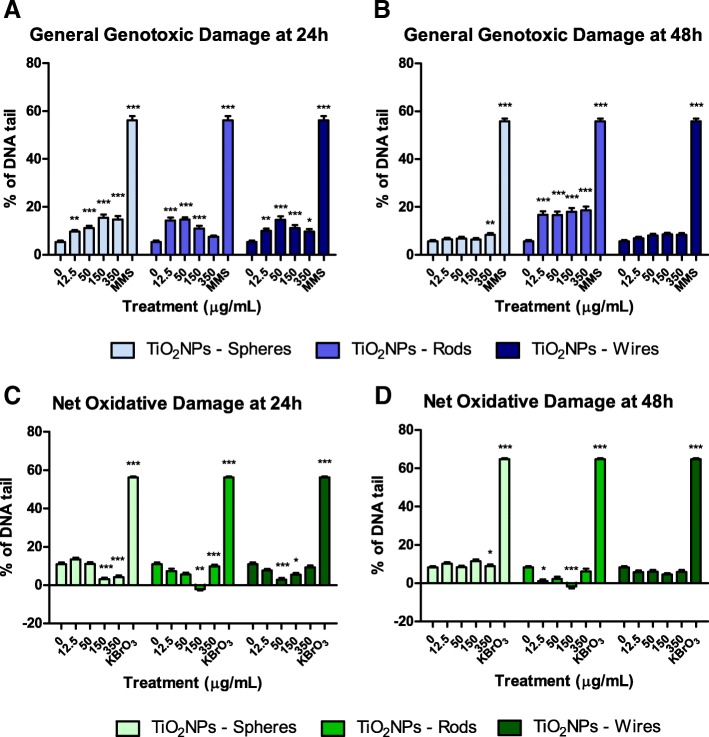
Fig. 9
DNA damage studies using the Comet assay complemented with the FPG enzyme. Genotoxic damage observed after 24 ( a ) or 48 ( b ) h of exposure to TiO 2 NPs (-S, u2212R and -W). Mean oxidative damage ob...
Figure images are served from the NIH/NLM PubMed Central Open Access Subset or Europe PMC; copyright remains with the publishers and authors.
💬 Discussion
0 commentsNo comments yet. Be the first to start a discussion!
Leave a Comment