Abstract
OBJECTIVE: To determine whether leukocyte-platelet-rich fibrin (L-PRF) and advanced platelet-rich fibrin (A-PRF+) differ in their in vitro capacity to induce proliferation and migration of periodontal fibroblasts. BACKGROUND: L-PRF and A-PRF + are autologous materials used in periodontal regenerative surgery. They derive from blood from patients, but have different characteristics. The literature is controversial regarding the effects of the two PRF preparations on periodontal tissue fibroblasts. MATERIALS AND METHODS: L-PRF and A-PRF + membranes were prepared from eight patients and incubated in 3 mL of culture medium for 2 days. Gingival fibroblasts (G-F) and periodontal ligament fibroblast (PDL-F) primary cells were retrieved from 7 donors. These cells were pre-cultured for 1 day in wound healing experiment plates leaving a gap of 500 ± 50 µm in a concentration of 3.3 x 10⁵ cells/mL. 70 µL of the cell suspension was placed in each half of the well. Thereafter, the pre-cultured L-PRF and A-PRF + supernatants were added to the experimental plates, and the fibroblasts were incubated for another 24 h. Medium alone (NEG) and fibroblast growth factor II (FGF) were used as controls. Subsequently, cell migration was registered for 24 h with live cell imaging in a time frame microscope at 5% CO2 in air at 37°C. Images were analyzed using ImageJ. Cell proliferation and cell viability were measured. RESULTS: L-PRF and A-PRF + induced higher cell proliferation than FGF and NEG. Both A-PRF + and L-PRF induced significant faster artificial wound closure than controls. Both PRF conditioned media induced faster cell migration in the initial phase (P < .01), but in the stoppage phase, the induced migration was higher for the A-PRF+, compared with L-PRF (P < .01). CONCLUSION: L-PRF and A-PRF + have a stimulatory effect on migration and proliferation of periodontal fibroblasts, and artificial wound closure was longer sustained by A-PRF + than L-PRF.
🔬 Techniques
🔭 Microscopes
💻 Software
🧪 Sample Preparation
🔬 Cell Lines
🏭 Microscope Brands
🧪 Reagent Suppliers
💻 Software Details
🏛️ Research Organizations (ROR)
Affiliated research institutions:
📋 Methods
L‐PRF and A‐PRF + membranes were prepared from eight patients and incubated in 3 mL of culture medium for 2 days. Gingival fibroblasts (G‐F) and periodontal ligament fibroblast (PDL‐F) primary cells were retrieved from 7 donors. These cells were pre‐cultured for 1 day in wound healing experiment plates leaving a gap of 500 ± 50 µm in a concentration of 3.3 x 10 5 cells/mL. 70 µL of the cell suspension was placed in each half of the well. Thereafter, the pre‐cultured L‐PRF and A‐PRF + supernatants were added to the experimental plates, and the fibroblasts were incubated for another 24 h. Medium alone (NEG) and fibroblast growth factor II (FGF) were used as controls. Subsequently, cell migration was registered for 24 h with live cell imaging in a time frame microscope at 5% CO 2 in air at 37°C. Images were analyzed using ImageJ. Cell proliferation and cell viability were measured.
2 MATERIAL AND METHODS 2.1 PRF preparation The study was performed in accordance with the Medical Ethical Committee of VU Medical Center, Vrije Universiteit Amsterdam (study protocol reference 2016.530). Blood samples were collected from the antecubital fossa of 8 periodontitis patients attending the Department of Periodontology at the Academic Center for Dentistry Amsterdam (Table 1 ). They were selected for periodontal surgery using PRF materials, aged 25 to 65 years, and signed an informed consent (inclusion criteria: eligible for periodontal surgery, aged 18‐80; exclusion criteria: pregnancy or lactation, uncontrolled diabetes, HIV positive, leukopenia, diseases related to reduced wound healing, use of anticoagulants, corticosteroids, and immunosuppressants). From each patient, seven tubes of blood were sampled; the first one was discarded, and the other tubes were taken within 60 s. Two Tubes were addressed for surgical use and, therefore, excluded from the study. The following four sampled tubes were two A‐PRF + tubes (10 mL tube, glass, PRF Processe); two L‐PRF tubes (9 mL tube, glass coated plastic tubes, Intra‐Lock). Subsequently, the two 10 mL tubes were centrifuged at 208 g × 8 min for the A‐PRF+; while the two 9 mL tubes were centrifuged at 708 g × 12 min for L‐PRF preparation. Original brand centrifuges were used for the preparation of the materials (A‐PRF duo Centrifuge, PRF Process or L‐PRF Intra‐spin, Intra‐Lock). After the designated centrifugation steps, the tubes were kept vertical for 5 min. Table 1 Periodontitis patient background characteristics Patient Sex Age a BMI b Smoking Comorbidities 1 F 36 21 Yes No 2 M 55 28 No Yes c 3 M 57 26 Yes No 4 M 23 28 No No 5 F 41 27 No No 6 F 52 19 No No 7 M 63 25 No Yes d 8 F 62 35 No Yes e Abbreviations: BMI, body mass index. a Years. b kg/m 2 . c History of hepatitis B. d Myocardial infarction 2 years ago and medications: Lisinopril 5 mg/day; Nifedipine 40 mg/day. e Myocardial infarction 3 years ago and medications: Lisinopril 2.5 mg/day; Isosorbide mononitrate 30 mg/day. John Wiley & Sons, Ltd The fibrin clot was located in the middle part of the tube, between the red corpuscular phase at the bottom of the tube and the acellular plasma at the top. 10 The fibrin clots from the A‐PRF + and L‐PRF tubes were extracted with sterile tweezers and placed in a dedicated sterile metal box device (Xpression Fabrication Kit, Intra‐Lock), engineered to optimize the consistency and the thickness of the matrix via weighted homogenous pressure, for 5 min. When fibrin clots were obtained, they were transported to the laboratory and further processed under sterile conditions. The PRF clots were removed from the compressive metal box in a sterile environment (airflow cabinet) and placed into a six‐well dish with 3 mL of Dulbecco' Modified Eagle Medium (DMEM, Invitrogen Life Sciences), enriched with 10% FCI (Fetal clone I, HyClone Laboratories) and 1% PSF (Antibiotics Penicillin/Streptomycin/Amphotericin B, Sigma‐Aldrich). The clots were incubated for 48 h in a 37°C incubator with 5% CO 2 . Subsequently, the L‐PRF and A‐PRF + conditioned medium was removed and immediately added to the fibroblasts cells cultures for the following 24 h (see paragraph 2.3, Wound Healing experiment).
Show full methods section
L‐PRF and A‐PRF + membranes were prepared from eight patients and incubated in 3 mL of culture medium for 2 days. Gingival fibroblasts (G‐F) and periodontal ligament fibroblast (PDL‐F) primary cells were retrieved from 7 donors. These cells were pre‐cultured for 1 day in wound healing experiment plates leaving a gap of 500 ± 50 µm in a concentration of 3.3 x 10 5 cells/mL. 70 µL of the cell suspension was placed in each half of the well. Thereafter, the pre‐cultured L‐PRF and A‐PRF + supernatants were added to the experimental plates, and the fibroblasts were incubated for another 24 h. Medium alone (NEG) and fibroblast growth factor II (FGF) were used as controls. Subsequently, cell migration was registered for 24 h with live cell imaging in a time frame microscope at 5% CO 2 in air at 37°C. Images were analyzed using ImageJ. Cell proliferation and cell viability were measured.
2 MATERIAL AND METHODS 2.1 PRF preparation The study was performed in accordance with the Medical Ethical Committee of VU Medical Center, Vrije Universiteit Amsterdam (study protocol reference 2016.530). Blood samples were collected from the antecubital fossa of 8 periodontitis patients attending the Department of Periodontology at the Academic Center for Dentistry Amsterdam (Table 1 ). They were selected for periodontal surgery using PRF materials, aged 25 to 65 years, and signed an informed consent (inclusion criteria: eligible for periodontal surgery, aged 18‐80; exclusion criteria: pregnancy or lactation, uncontrolled diabetes, HIV positive, leukopenia, diseases related to reduced wound healing, use of anticoagulants, corticosteroids, and immunosuppressants). From each patient, seven tubes of blood were sampled; the first one was discarded, and the other tubes were taken within 60 s. Two Tubes were addressed for surgical use and, therefore, excluded from the study. The following four sampled tubes were two A‐PRF + tubes (10 mL tube, glass, PRF Processe); two L‐PRF tubes (9 mL tube, glass coated plastic tubes, Intra‐Lock). Subsequently, the two 10 mL tubes were centrifuged at 208 g × 8 min for the A‐PRF+; while the two 9 mL tubes were centrifuged at 708 g × 12 min for L‐PRF preparation. Original brand centrifuges were used for the preparation of the materials (A‐PRF duo Centrifuge, PRF Process or L‐PRF Intra‐spin, Intra‐Lock). After the designated centrifugation steps, the tubes were kept vertical for 5 min. Table 1 Periodontitis patient background characteristics Patient Sex Age a BMI b Smoking Comorbidities 1 F 36 21 Yes No 2 M 55 28 No Yes c 3 M 57 26 Yes No 4 M 23 28 No No 5 F 41 27 No No 6 F 52 19 No No 7 M 63 25 No Yes d 8 F 62 35 No Yes e Abbreviations: BMI, body mass index. a Years. b kg/m 2 . c History of hepatitis B. d Myocardial infarction 2 years ago and medications: Lisinopril 5 mg/day; Nifedipine 40 mg/day. e Myocardial infarction 3 years ago and medications: Lisinopril 2.5 mg/day; Isosorbide mononitrate 30 mg/day. John Wiley & Sons, Ltd The fibrin clot was located in the middle part of the tube, between the red corpuscular phase at the bottom of the tube and the acellular plasma at the top. 10 The fibrin clots from the A‐PRF + and L‐PRF tubes were extracted with sterile tweezers and placed in a dedicated sterile metal box device (Xpression Fabrication Kit, Intra‐Lock), engineered to optimize the consistency and the thickness of the matrix via weighted homogenous pressure, for 5 min. When fibrin clots were obtained, they were transported to the laboratory and further processed under sterile conditions. The PRF clots were removed from the compressive metal box in a sterile environment (airflow cabinet) and placed into a six‐well dish with 3 mL of Dulbecco' Modified Eagle Medium (DMEM, Invitrogen Life Sciences), enriched with 10% FCI (Fetal clone I, HyClone Laboratories) and 1% PSF (Antibiotics Penicillin/Streptomycin/Amphotericin B, Sigma‐Aldrich). The clots were incubated for 48 h in a 37°C incubator with 5% CO 2 . Subsequently, the L‐PRF and A‐PRF + conditioned medium was removed and immediately added to the fibroblasts cells cultures for the following 24 h (see paragraph 2.3, Wound Healing experiment).
Fibroblasts and periodontal ligament cells isolation Primary
G‐F and PDL‐F cells were obtained from extracted wisdom teeth, also used in a previous study (from five donors) 24 which were stored in stocks in liquid nitrogen at passage 3. Signed informed consent to use these cells obtained from this operational waste material was obtained. All cell cultures were immediately after the extraction anonymized for the researcher using cell cultures, as required by Dutch law. The week before every experiment, cells were retrieved and seeded in 75 cm 2 culture flasks. The experiments were performed with cells from passages 5‐7. Different primary cell cultures were used per experiment in the study (Distribution of cells and patients per experiment, Table 2 ). The day before the experiment, the periodontal fibroblasts (G‐F or PDL‐F) were seeded in special cell migration culture plates having a silicon insert that separates two compartments (Culture‐insert 2 Well 24, ibiTreat, Ibidi, Martinsried, Germany), in a concentration of 3.3 × 10 5 cells/mL. 70 μL of the cell suspension was placed in each half of the well delimited by the silicon insert, according to the manufacturer instructions, and left incubating for 1 day at 37°C incubator with 5% CO 2. Table 2 Patients and cell lines used Patient number Cell lines used a Distribution 1 G‐F72 ×4 G‐F89 ×4 PDL‐F72 ×3 PDL‐F86 ×2 2 G‐F72 ×5 PDL‐F72 ×4 PDL‐F86 ×4 3 G‐F72 ×7 PDL‐F72 ×7 4 G‐F72 ×4 PDL‐F72 ×4 5 G‐F63 ×3 G‐F66 ×4 PDL‐F66 ×3 6 G‐F63 ×5 PDL‐F66 ×3 7 G‐F72 ×5 PDL‐F86 ×3 8 G‐F63 ×4 G‐F89 ×4 n total: 82 Abbreviations: G‐F, gingival fibroblast; PDL‐F, periodontal ligament fibroblast. a Each number behind the cell type refers to a unique donor: From 5 individuals, 7 primary cell cultures were retrieved from liquid nitrogen and used in the current experiments. 24 John Wiley & Sons, Ltd 2.3 Wound healing experiments To start the actual experimental conditions, the silicon inserts from the special migration plates (Culture‐insert 2 Well 24, ibiTreat) were removed, leaving a gap of 500 ± 50 μm (according to manufacturer) between the fibroblasts attached to the plastic bottom that were until this moment, separated by the silicon insert. Now, these fibroblasts were incubated with the 2‐day conditioned medium from either the A‐PRF + or L‐PRF clots or the controls. As control conditions, either 1 mL of medium (DMEM + 10% FCI + 1% PSF) or 25 ng/mL of human FGF II in 1 mL DMEM + 10% FCI + 1% PSF was used. From this moment, cell migration was monitored with a time frame microscope (Carl Zeiss Observer Z1, Carl Zeiss) at 10 × magnification, under stable pressure of 5% CO 2 in air at 37°C (Tokia Hit Incubation system, Tokai Hit Co.) (See experimental flowchart, Figure 1 ). The cell migration was recorded at two random fields per well at 20 min time intervals for 24 h (Figure 2 ). Figure 1 Flowchart and time line (in hours) of the experimental procedures. Abbreviations: h, hours; G‐F, gingival fibroblasts; PDL‐F, periodontal ligament fibroblasts; PRF, platelet‐rich fibrin Figure 2 Examples of events during an experiment (Experiment 1, PDL‐F72 cells incubated with condition medium from L‐PRF from patient 1). Images of the artificial wound (after insert removal) were obtained every 20 mins, from 0 h to 24 h. Wound Closure was observed via time frame microscope (Carl Zeiss Observer Z1, Carl Zeiss, Goettingen, Germany) at 10 × magnification, under stable pressure of 5% CO 2 in air at 37°C. (A) time = 0 h; (B) time = 6 h; (C) time = 12 h; (D) time = 18 h; (E) time = 24 h After 24h, the fibroblasts were trypsinized, and the number of cells and relative viability was determined using the protocol of Kahn et al 25 that allows discrimination between life and dead cells. Cells were incubated with mix‐and‐read Muse Count & Viability reagent according to manufacturer (Muse Cell analyzer, Merck Millipore, Darmstadt, Germany).
Image analysis
Cell migration images were analyzed with an image software (Fiji, V1.49, open source). 26 Images were normalized in terms of white balance and transformed in Binomial (White and Black), by which the white area represented the fibroblasts and the black area the artificial wound (gap). Image closure was calculated on the raw light intensity per image. Raw light intensity was different for every image stack. To normalize the values between images stacks, the light intensity was calculated in percentage from 0% to maximum 100%. The reduction of the gap due to the migrating cells was scored in every image stack and recorded with a specific software tool (Time Series Analyzer, V3.0). Speed of closure was expressed in µm 2 /min, measured on the basis of the percentage of the cell closure during time, considering that the initial measured area of the gap was of 1 mm 2 . On the basis of the artificial closure graph (Figure 5 ), three different patterns of migration were identified (Phase I: maximal migration. Phase II: linear migration. Phase III: stoppage). At the end of the experiments (total of eight experiments, one plate with 24 migration wells per experiment), 82 series of images from the behavior of seven different fibroblast cultures were available (4 G‐F and 3 PDL‐F).
Statistical analysis
Means and standard deviations were calculated, and data for different conditions were compared. To test normal distribution of data, Kolmogorov‐Smirnov tests were used for all the data sets. The Kruskal‐Wallis test was applied to test proliferation and viability differences between the conditions. To compare differences between G‐F and PDL‐F primary cell cultures, Wilcoxon tests were performed. In terms of migration analysis, the Friedman test was performed, corrected with Dunn's test for multiple comparisons. The speed of cell migration was tested by 1‐way ANOVA corrected with the Bonferroni test for multiple comparison. Statistical analyses and graphical representation (means and standard error of the mean) were made with SPSS (IBM Corporation), GraphPad (GraphPad Software), and Excel (Microsoft Corporation).
📊 Figures
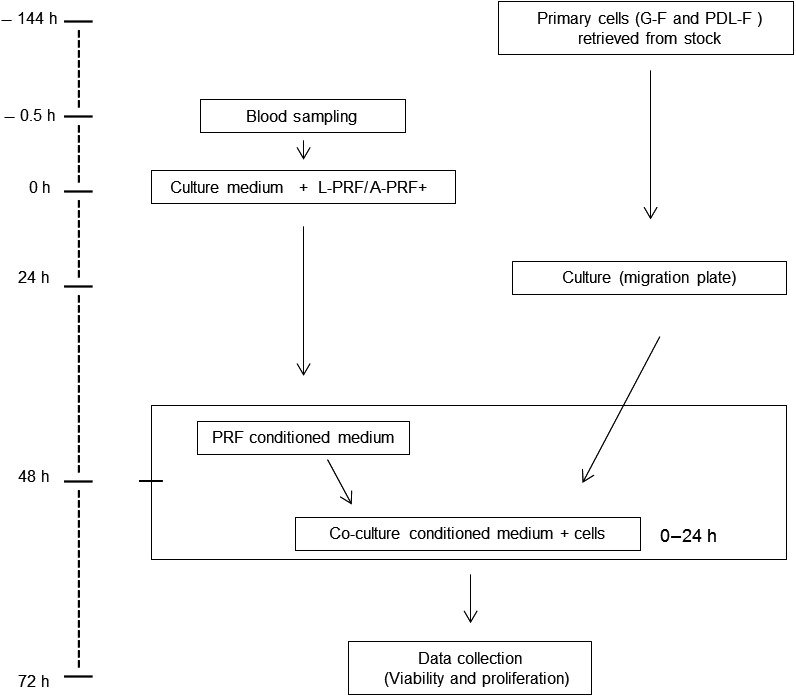
Figure 1
Flowchart and time line (in hours) of the experimental procedures. Abbreviations: h, hours; Gu2010F, gingival fibroblasts; PDLu2010F, periodontal ligament fibroblasts; PRF, plateletu2010rich fibrin
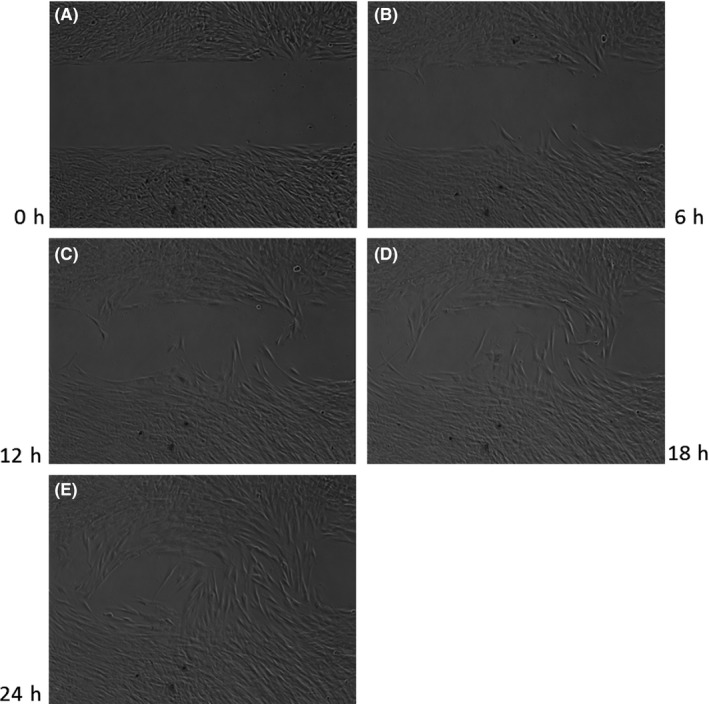
Figure 2
Examples of events during an experiment (Experiment 1, PDLu2010F72 cells incubated with condition medium from Lu2010PRF from patient 1). Images of the artificial wound (after insert removal) were obta...
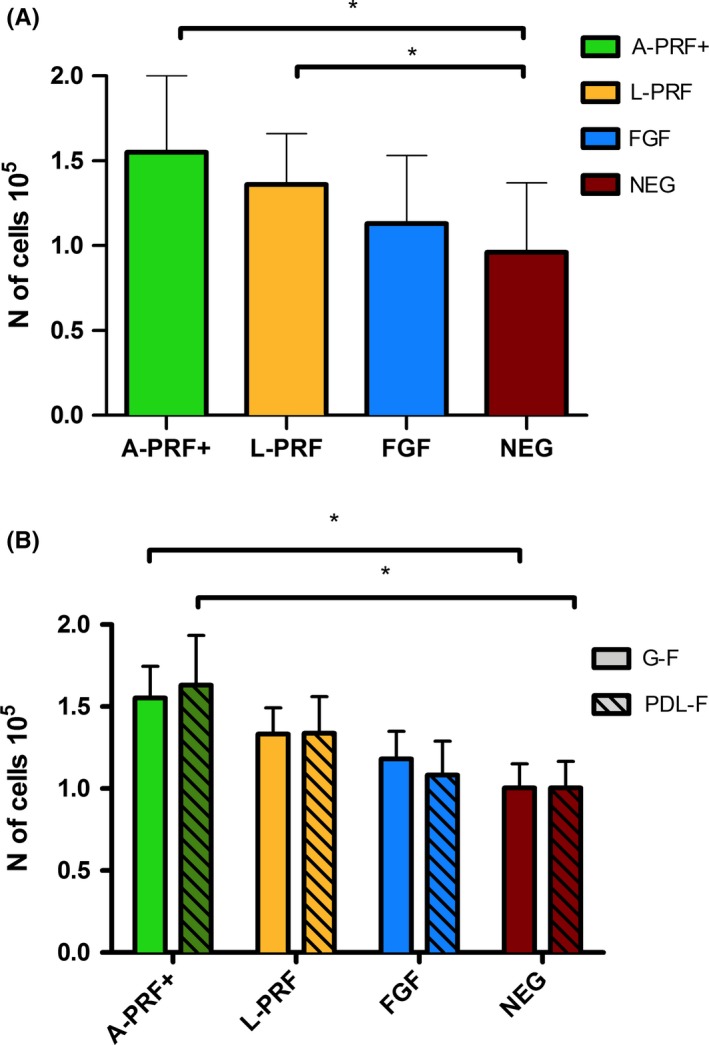
Figure 3
Fibroblast proliferation (results for Gu2010F and PDLu2010F combined) (Panel A) and proliferation per cell type (Panel B) for different culture conditions. Absolute cell concentration after 24h (cell ...
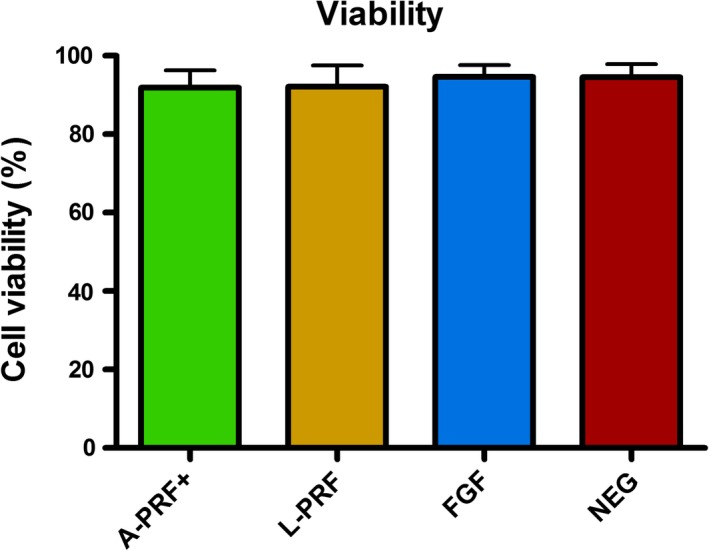
Figure 4
Fibroblast viability in the different culture conditions (results for Gu2010F and PDLu2010F combined) after 24h. Cells viability is comparable in every culture condition. Meansu00a0u00b1u00a0SEM
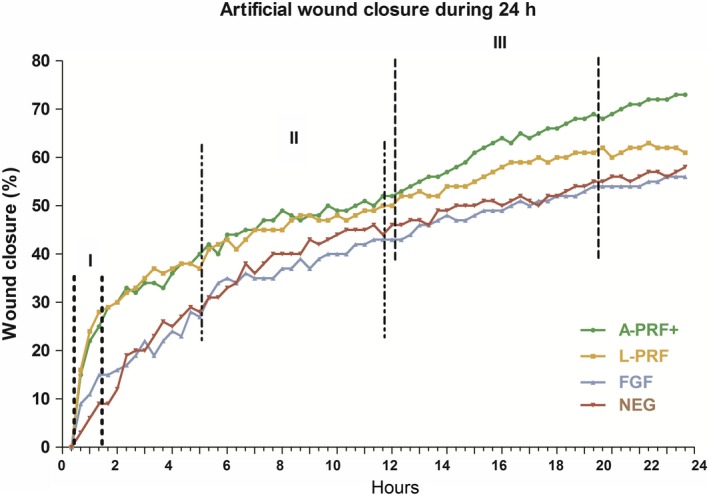
Figure 5
Cell migration of Gu2010F and PDLu2010F over a period of 24u00a0h. n experimentsu00a0=u00a082. PRF medium shows higher migration compared with controls. Migration phases were defined in the figure to ...
Figure images are served from the NIH/NLM PubMed Central Open Access Subset or Europe PMC; copyright remains with the publishers and authors.
💬 Discussion
0 commentsNo comments yet. Be the first to start a discussion!
Leave a Comment