Abstract
Astrocytes display important features that allow them to maintain a close dialog with neurons, ultimately impacting brain function. The complex morphological structure of astrocytes is crucial to the role of astrocytes in brain networks. Therefore, assessing morphologic features of astrocytes will help provide insights into their physiological relevance in healthy and pathological conditions. Currently available tools that allow the tridimensional reconstruction of astrocytes present a number of disadvantages, including the need for advanced computational skills and powerful hardware, and are either time-consuming or costly. In this study, we optimized and validated the FIJI-ImageJ, Simple Neurite Tracer (SNT) plugin, an open-source software that aids in the reconstruction of GFAP-stained structure of astrocytes. We describe (1) the loading of confocal microscopy Z-stacks, (2) the selection criteria, (3) the reconstruction process, and (4) the post-reconstruction analysis of morphological features (process length, number, thickness, and arbor complexity). SNT allows the quantification of astrocyte morphometric parameters in a simple, efficient, and semi-automated manner. While SNT is simple to learn, and does not require advanced computational skills, it provides reproducible results, in different brain regions or pathophysiological states.
🔬 Techniques
🔭 Microscopes
✨ Fluorophores
🧪 Sample Preparation
🔬 Cell Lines
🏭 Microscope Brands
🧪 Reagent Suppliers
💻 Software Details
🏛️ Research Organizations (ROR)
Affiliated research institutions:
📋 Methods
Simple Neurite Tracer Simple Neurite Tracer (SNT), a free software plugin distributed by Fiji-ImageJ, was developed by Mark Longair and his colleagues ( 2011 ) (Fig. 1 ). The free download and documentation are available at “ http://fiji.sc/Simple_Neurite_Tracer ”. SNT was originally designed to trace neurites, allowing the semi-automated tracing of tube-like structures in confocal microscope Z-stacks. To use SNT to reconstruct an astrocyte, the user must select points along the midline of the astrocytic process. If a pathway actually exists between the points, the software will connect them, even if they are distant from each other. This semi-automated process helps avoid reconstruction errors and simultaneously ensures correct process tortuosity. Fig. 1 Reconstruction of astrocyte 3D morphology using SNT. Upload Z-stack of confocal images to Fiji software for astrocytic reconstruction ( upper panel ); Simple Neurite Tracer (SNT) menu and 3D astrocytic reconstruction example with all traced processes discriminated at “All paths window” ( middle panel ); thickness and Sholl analysis windows ( lower panel ) We describe here how to use SNT intuitive workflow to perform the morphometric analysis of astrocytic processes by quantifying their total length, number, thickness, and intersections at concentric spheres originating from the soma (Sholl analysis). We examined confocal Z-stack images, obtained from rodent brain tissue stained by immunofluorescence for GFAP (astrocyte main processes) and DAPI (cell nuclei). We chose to use confocal Z-stacks because fluorophores suffer extensive photobleaching during long-lasting manual reconstruction of their arbor processes. Details on the animal models used and tissue preparation are given below. After the immunostaining, Z-stacks of confocal images (tif format), including two channels (red, GFAP; blue, DAPI), were obtained via Olympus FV1000 laser scanning microscope. A resolution of 640 × 640 px was achieved using a 60× objective (PlanApo N, N.A. 1.42; oil; field size 211.51 × 211.51 µm; 0.33 µm/px; Figs. 2 , 3 , 4 , 5 ) and 1024 × 1024 px using a 40× objective (UPlanSApo, N.A. 0.90; dry; field size 317.13 × 317.13 µm; 0.31 µm/px; Fig. 3 a), to work with a similar image resolution. The acquisition settings were the following: scanning speed, 4 µs/px; pinhole aperture, 110 µm; GFAP, excitation = 559 nm, emission = 618 nm; DAPI, excitation = 405 nm, emission = 461 nm; pinhole aperture = 110 µm. The images analyzed were not post-processed. Fig. 2 Astrocytes selection criteria for 3D morphology reconstruction using SNT. Representative GFAP–DAPI staining micrographs (max projection) showing GFAP + cell suitable for 3D reconstruction ( asterisk ) and GFAP + cells that fail the criteria for astrocytic reconstruction due to lack of nuclei ( thick arrows ) or the presence of two nuclei in the same GFAP + structure ( thin arrows ); scale bar 50 µm Fig. 3 Suitable image Z-stack properties for 3D reconstruction of astrocytes. a Representative GFAP–DAPI staining micrograph (max projection) under 40× and 60× magnification; scale bar 50 µm. b Similar results of astrocytic morphology were obtained from reconstruction at 40× and 60× magnification, both for total length and number of processes. c At process complexity level, no differences were found between magnifications. d Representative micrograph of GFAP + cell (max projection) showing decreased detail of astrocytic morphology information with increased Z-step interslice interval (1, 2, 3, 4 µm, at 60× magnification); scale bar 20 µm. e No statistically significant differences were found between 1 and 2 µm Z-step interval; 3 and 4 µm leads to a significant loss of detail in astrocytic morphology and unreliable measures of total length and number of processes. f Sholl analysis confirms loss of detailed information regarding process arbor complexity at higher Z-step interslice intervals. Data plotted as mean ± SEM. * p < 0.05; ** p < 0.01 different from 1 µm; # p < 0.05 and ## p < 0.01 different from 2 µm Fig. 4 Simple Neurite Tracer is a reliable tool to reconstruct astrocyte process arbors. a Representative GFAP–DAPI staining micrograph (max projection) under 60× magnification, showing detailed astrocytic morphology; scale bar 50 µm. b Representative images of 3D astrocytic morphology reconstruction obtained from different users with SNT. c Similar morphometric results (astrocytic total length, number of processes and process volume) were obtained from different users’ 3D astrocytic reconstructions. d Sholl analysis shows similarity of process arbor complexity of reconstructed astrocytes from different SNT users. e Representative GFAP + cell micrograph (max projection) and its respective reconstruction obtained from AutoNeuron and SNT; scale bar 50 µm. f Astrocytic reconstructions obtained from AutoNeuron and SNT confirm similarity between total length and number of processes. g Sholl analysis confirms similarity between reconstructed astrocytic morphologies at a detailed level of arbor complexity Fig. 5 Simple Neurite Tracer discriminates altered morphology states. a Representative micrographs of GFAP–DAPI staining (max projection) of rat brain sections, including the medial prefrontal cortex from control (Ctrl) and stab wound injury (Stab Wound) animals with a representative reconstructed astrocyte from SNT for each condition, respectively; scale bar 50 µm; b stab animals present astrocytes with greater total length, c increased number of processes, and d GFAP process volume. e Sholl analysis results demonstrate increased arbor complexity in stab animals. f No differences were observed regarding maximum extension of astrocytic processes between groups. Data plotted as mean ± SEM. * p < 0.05 and ** p < 0.01 Astrocyte selection criteria for reconstruction Astrocytes were readily identified by their characteristic GFAP-positive bushy shape, displaying thicker processes around the DAPI-stained nucleus. The selection criteria used (examples in Fig. 2 ) are listed below: GFAP-stained structure encloses a single DAPI-stained nucleus. The main structure does not have truncated processes. Reconstruct the first ten astrocytes per animal that fulfill the above-mentioned criteria (maximum of four astrocytes per randomly selected Z-stack). Step-by-step reconstruction of an astrocyte from a previously acquired Z-stack of images Import the image stack into Fiji (Menu: FileImportImage Sequence); select one image from the stack; press “Open”; in the “Sequence options” verify that the information provided is correct, otherwise update. Open SNT (Menu: PluginsSegmentationSNT); press “Yes” to convert every RGB image to 8-bit luminance; choose 3D visualization options; one may deselect all options to work in a simpler desktop (Fig. 1 , middle panel). Follow the reconstruction instructions available at “ http://fiji.sc/Simple_Neurite_Tracer:_Step-By-Step_Instructions ” to trace the astrocyte selected. Keyboard shortcuts were found very useful. After the selection of a distant point within a process, SNT will automatically suggest the process midline, respecting the process tortuosity. Due to the heterogeneous structure of the astrocytic soma, and its relationship to the main processes, the center of the DAPI staining was always defined as the starting point. Every main process must be reconstructed from this starting point, to perform the Sholl analysis. The information of the reconstructed astrocytes (list of paths and individual path lengths) appears in the “All paths” window. The paths located in the first tree level represent the main processes (Fig. 1 , middle panel). Saving and exporting The “All paths” window data may be saved as CSV file (SNT Menu: FileExport as CSV). The 3D reconstructed traces may be saved as an SWC file (SNT Menu: FileSave traces file). This file may be opened and edited anytime, yet the original Z-stack should be pre-loaded in Fiji, repeating steps 1 and 2. The 3D reconstructed traces may be exported to a 2D image format: After reconstruction step 3, go to SNT Menu: AnalysisMake line stack. Make Z-projection at Fiji Menu: ImageStacksZ project (Max intensity). Invert black/white at Fiji Menu: EditInvert. Save as image at Fiji Menu: FileSave as.
Show full methods section
Simple Neurite Tracer Simple Neurite Tracer (SNT), a free software plugin distributed by Fiji-ImageJ, was developed by Mark Longair and his colleagues ( 2011 ) (Fig. 1 ). The free download and documentation are available at “ http://fiji.sc/Simple_Neurite_Tracer ”. SNT was originally designed to trace neurites, allowing the semi-automated tracing of tube-like structures in confocal microscope Z-stacks. To use SNT to reconstruct an astrocyte, the user must select points along the midline of the astrocytic process. If a pathway actually exists between the points, the software will connect them, even if they are distant from each other. This semi-automated process helps avoid reconstruction errors and simultaneously ensures correct process tortuosity. Fig. 1 Reconstruction of astrocyte 3D morphology using SNT. Upload Z-stack of confocal images to Fiji software for astrocytic reconstruction ( upper panel ); Simple Neurite Tracer (SNT) menu and 3D astrocytic reconstruction example with all traced processes discriminated at “All paths window” ( middle panel ); thickness and Sholl analysis windows ( lower panel ) We describe here how to use SNT intuitive workflow to perform the morphometric analysis of astrocytic processes by quantifying their total length, number, thickness, and intersections at concentric spheres originating from the soma (Sholl analysis). We examined confocal Z-stack images, obtained from rodent brain tissue stained by immunofluorescence for GFAP (astrocyte main processes) and DAPI (cell nuclei). We chose to use confocal Z-stacks because fluorophores suffer extensive photobleaching during long-lasting manual reconstruction of their arbor processes. Details on the animal models used and tissue preparation are given below. After the immunostaining, Z-stacks of confocal images (tif format), including two channels (red, GFAP; blue, DAPI), were obtained via Olympus FV1000 laser scanning microscope. A resolution of 640 × 640 px was achieved using a 60× objective (PlanApo N, N.A. 1.42; oil; field size 211.51 × 211.51 µm; 0.33 µm/px; Figs. 2 , 3 , 4 , 5 ) and 1024 × 1024 px using a 40× objective (UPlanSApo, N.A. 0.90; dry; field size 317.13 × 317.13 µm; 0.31 µm/px; Fig. 3 a), to work with a similar image resolution. The acquisition settings were the following: scanning speed, 4 µs/px; pinhole aperture, 110 µm; GFAP, excitation = 559 nm, emission = 618 nm; DAPI, excitation = 405 nm, emission = 461 nm; pinhole aperture = 110 µm. The images analyzed were not post-processed. Fig. 2 Astrocytes selection criteria for 3D morphology reconstruction using SNT. Representative GFAP–DAPI staining micrographs (max projection) showing GFAP + cell suitable for 3D reconstruction ( asterisk ) and GFAP + cells that fail the criteria for astrocytic reconstruction due to lack of nuclei ( thick arrows ) or the presence of two nuclei in the same GFAP + structure ( thin arrows ); scale bar 50 µm Fig. 3 Suitable image Z-stack properties for 3D reconstruction of astrocytes. a Representative GFAP–DAPI staining micrograph (max projection) under 40× and 60× magnification; scale bar 50 µm. b Similar results of astrocytic morphology were obtained from reconstruction at 40× and 60× magnification, both for total length and number of processes. c At process complexity level, no differences were found between magnifications. d Representative micrograph of GFAP + cell (max projection) showing decreased detail of astrocytic morphology information with increased Z-step interslice interval (1, 2, 3, 4 µm, at 60× magnification); scale bar 20 µm. e No statistically significant differences were found between 1 and 2 µm Z-step interval; 3 and 4 µm leads to a significant loss of detail in astrocytic morphology and unreliable measures of total length and number of processes. f Sholl analysis confirms loss of detailed information regarding process arbor complexity at higher Z-step interslice intervals. Data plotted as mean ± SEM. * p < 0.05; ** p < 0.01 different from 1 µm; # p < 0.05 and ## p < 0.01 different from 2 µm Fig. 4 Simple Neurite Tracer is a reliable tool to reconstruct astrocyte process arbors. a Representative GFAP–DAPI staining micrograph (max projection) under 60× magnification, showing detailed astrocytic morphology; scale bar 50 µm. b Representative images of 3D astrocytic morphology reconstruction obtained from different users with SNT. c Similar morphometric results (astrocytic total length, number of processes and process volume) were obtained from different users’ 3D astrocytic reconstructions. d Sholl analysis shows similarity of process arbor complexity of reconstructed astrocytes from different SNT users. e Representative GFAP + cell micrograph (max projection) and its respective reconstruction obtained from AutoNeuron and SNT; scale bar 50 µm. f Astrocytic reconstructions obtained from AutoNeuron and SNT confirm similarity between total length and number of processes. g Sholl analysis confirms similarity between reconstructed astrocytic morphologies at a detailed level of arbor complexity Fig. 5 Simple Neurite Tracer discriminates altered morphology states. a Representative micrographs of GFAP–DAPI staining (max projection) of rat brain sections, including the medial prefrontal cortex from control (Ctrl) and stab wound injury (Stab Wound) animals with a representative reconstructed astrocyte from SNT for each condition, respectively; scale bar 50 µm; b stab animals present astrocytes with greater total length, c increased number of processes, and d GFAP process volume. e Sholl analysis results demonstrate increased arbor complexity in stab animals. f No differences were observed regarding maximum extension of astrocytic processes between groups. Data plotted as mean ± SEM. * p < 0.05 and ** p < 0.01 Astrocyte selection criteria for reconstruction Astrocytes were readily identified by their characteristic GFAP-positive bushy shape, displaying thicker processes around the DAPI-stained nucleus. The selection criteria used (examples in Fig. 2 ) are listed below: GFAP-stained structure encloses a single DAPI-stained nucleus. The main structure does not have truncated processes. Reconstruct the first ten astrocytes per animal that fulfill the above-mentioned criteria (maximum of four astrocytes per randomly selected Z-stack). Step-by-step reconstruction of an astrocyte from a previously acquired Z-stack of images Import the image stack into Fiji (Menu: FileImportImage Sequence); select one image from the stack; press “Open”; in the “Sequence options” verify that the information provided is correct, otherwise update. Open SNT (Menu: PluginsSegmentationSNT); press “Yes” to convert every RGB image to 8-bit luminance; choose 3D visualization options; one may deselect all options to work in a simpler desktop (Fig. 1 , middle panel). Follow the reconstruction instructions available at “ http://fiji.sc/Simple_Neurite_Tracer:_Step-By-Step_Instructions ” to trace the astrocyte selected. Keyboard shortcuts were found very useful. After the selection of a distant point within a process, SNT will automatically suggest the process midline, respecting the process tortuosity. Due to the heterogeneous structure of the astrocytic soma, and its relationship to the main processes, the center of the DAPI staining was always defined as the starting point. Every main process must be reconstructed from this starting point, to perform the Sholl analysis. The information of the reconstructed astrocytes (list of paths and individual path lengths) appears in the “All paths” window. The paths located in the first tree level represent the main processes (Fig. 1 , middle panel). Saving and exporting The “All paths” window data may be saved as CSV file (SNT Menu: FileExport as CSV). The 3D reconstructed traces may be saved as an SWC file (SNT Menu: FileSave traces file). This file may be opened and edited anytime, yet the original Z-stack should be pre-loaded in Fiji, repeating steps 1 and 2. The 3D reconstructed traces may be exported to a 2D image format: After reconstruction step 3, go to SNT Menu: AnalysisMake line stack. Make Z-projection at Fiji Menu: ImageStacksZ project (Max intensity). Invert black/white at Fiji Menu: EditInvert. Save as image at Fiji Menu: FileSave as.
Volume analysis
Select all paths and press “Fill out” (detailed instructions under “ http://fiji.sc/Simple_Neurite_Tracer:_Basic_Instructions#Filling_Out_Neurons ”). In the “All fills” window (Fig. 1 , lower panel, left), set the threshold to a value that produces an adequate fill of the GFAP staining across a considerable number of cells, respecting both thicker and thinner processes (0.05 yielded reproducible results across astrocytes of four different sets of rats and mice in our experiments); press “Set”. Export the volume data to a CSV file.
Sholl analysis
Select the first traced path in the “All paths” window and press Ctrl + Shift to follow the path. Select the starting point located in the center of the DAPI staining. Press Ctrl + Shift + A to open the “Sholl analysis” window (detailed instructions under “ http://fiji.sc/Simple_Neurite_Tracer:_Sholl_analysis ”). In the “Sholl analysis” window (Fig. 1 , lower panel, right), select “Use all paths” and “sphere radius”. A radius of 4 µm was sufficient to provide enough morphologic detail for GFAP-stained astrocytes in our study (Figs. 3 , 4 , 5 ). Export the data as a CSV file. Data interpretation Total process length: sum of the length of all individual paths, obtained from the “All paths” window. Number of processes/endings: number of individual paths, obtained from the “All paths” window. Process thickness: estimated from the GFAP thickness; provided by the “Fill Out” analysis. Morphology complexity: estimated from the number of intersections at each radial distance from the starting point (DAPI-stained nucleus); provided by the Sholl analysis. Animals, surgical procedures and tissue preparation All experiments were performed in accordance with the European Directive 2010/63/EU, of 22 September and DGAV Decreto-Lei No. 113/2013, of 7 of August. All animals were group housed in standard cages under defined laboratory conditions (light/dark cycle 8 a.m. to 8 p.m.; room temperature 22 °C; ad libitum access to food and water). Mice and rat models were used to confirm the suitability of SNT for astrocyte reconstruction in both species. To validate the method, hippocampal slices obtained from C57BL/6J wild-type mice ( n = 4) (Charles River, Barcelona, Spain) were stained (Figs. 3 , 4 ). The stab wound injury model was performed on Wistar Han rats ( n = 2 per group) to induce astrogliosis (Sofroniew 2015 ) and confirm the ability of SNT to discriminate morphological changes in astrocytes under this condition (Fig. 5 ). The stab wound injury was performed in a similar manner to that previously defined (Lima et al. 2014 ). Briefly, rats were deeply anesthetized with a mixture of ketamine (75 mg/kg, i.p.; Imalgene 1000, Merial, EUA) and medetomidine (0.5 mg/kg, i.p.; Dorbene Vet, Pfizer, EUA). A 30 G needle was stereotaxically inserted into the medial prefrontal cortex, bilaterally, following the coordinates 3.0 mm posterior to bregma, ±0.6 mm lateral to the midline and 2.5 mm ventral to the skull surface, based on the Paxinos and Watson rat brain atlas ( 2005 ). Age- and sex-matched rats, not submitted to needle insertion, were considered as controls. At the end of the surgical procedure, the anesthesia was reversed with atipamezole (2 mg/kg i.p.; Antisedan, Pfizer) and the animals were given 6 days to recover. After the rest period, rats and wild-type mice were deeply anesthetized (for mice, the concentration of medetomidine was corrected to 1 mg/kg in the mixture) and immediately intracardially perfused with saline, followed by 4 % paraformaldehyde solution [(PFA, 0.1 M, pH 7.4, in phosphate saline buffer (PBS)]. Brains were removed and immersed in 4 % PFA (48 h), followed by 1 week in a 30 % sucrose PBS buffer (at 4 °C). Brains were then frozen by immersion in isopentane (BDH Prolabo; cooled in liquid nitrogen) in Neg-50 frozen section medium (Thermo Scientific, EUA) and stored at −20 °C until sectioning. The immunohistochemistry protocol was performed in cryosections (20 µm-thick) of mice (stratum radiatum, CA1, dorsal hippocampus; Figs. 2 , 3 , 4 ) and rat (layers 3–5, medial prefrontal cortex; Fig. 5 ) brains. Tissue slices were hydrated with PBS for 10 min and then permeabilized with PBS-T 0.3 % (0.3 % triton X-100, Sigma Aldrich, USA, in PBS) for 10 min. Antigen retrieval was then performed by immersing the slices in pre-heated citrate buffer (10 mM, pH 6.0; Sigma Aldrich, USA) during 20 min at microwave low potency. Once cooled, slices were rinsed in PBS and then in 10 % fetal bovine serum (FBS) in PBS. The slices were then incubated at room temperature for 30 min. The slices were incubated in the primary antibody, rabbit polyclonal anti-GFAP (1:200; Dako, Denmark) diluted in PBS-T 0.3 % 4 % FBS, and then incubated at 4 °C overnight. Next morning, tissue slices were rinsed in PBS and incubated with a secondary antibody, Alexa Fluor ® 594 goat anti-rabbit (1:1000; Molecular Probes ® , Invitrogen, USA) diluted in PBS during 90 min at room temperature, protected from light. DAPI staining was performed by a 10-min incubation (1:1000; Invitrogen, USA), followed by several rinses with PBS. Coverslips were mounted using Immu-Mount™ (Thermo Scientific, USA).
Statistical analysis
Results are presented as mean ± SEM (standard error of the mean). The statistical significance was observed for a confidence level of 95 %. All data sets passed the Shapiro–Wilk normality test for Gaussian distributions. Accordingly, parametric tests were applied throughout. t tests were used to compare astrocytic total length, number of processes and process thickness between groups (unpaired, Figs. 3 , 5 ; paired, Fig. 4 ). One-way analysis of variance (ANOVA) was applied to compare astrocytic morphologies (total length and number of processes) obtained by decreasing the Z-step intervals (Bonferroni post hoc comparisons; Fig. 3 e). Two-way ANOVA was used to compare Sholl analysis data between astrocytic reconstructions (between experimental groups and along the radial distances; Sidak post hoc comparisons; Figs. 3 , 4 , 5 ). Pearson correlation coefficients were calculated to compare distributions of data obtained through two different reconstruction programs. Additionally, the degree of consistency between two independent users was evaluated by calculating Pearson coefficients (Fig. 4 ). Statistical analysis was performed by using GraphPad Prism 6 (GraphPad Software Inc., USA).
Animals, surgical procedures and tissue preparation All experiments were performed in accordance with the European Directive 2010/63/EU, of 22 September and DGAV Decreto-Lei No. 113/2013, of 7 of August. All animals were group housed in standard cages under defined laboratory conditions (light/dark cycle 8 a.m. to 8 p.m.; room temperature 22 °C; ad libitum access to food and water). Mice and rat models were used to confirm the suitability of SNT for astrocyte reconstruction in both species. To validate the method, hippocampal slices obtained from C57BL/6J wild-type mice ( n = 4) (Charles River, Barcelona, Spain) were stained (Figs. 3 , 4 ). The stab wound injury model was performed on Wistar Han rats ( n = 2 per group) to induce astrogliosis (Sofroniew 2015 ) and confirm the ability of SNT to discriminate morphological changes in astrocytes under this condition (Fig. 5 ). The stab wound injury was performed in a similar manner to that previously defined (Lima et al. 2014 ). Briefly, rats were deeply anesthetized with a mixture of ketamine (75 mg/kg, i.p.; Imalgene 1000, Merial, EUA) and medetomidine (0.5 mg/kg, i.p.; Dorbene Vet, Pfizer, EUA). A 30 G needle was stereotaxically inserted into the medial prefrontal cortex, bilaterally, following the coordinates 3.0 mm posterior to bregma, ±0.6 mm lateral to the midline and 2.5 mm ventral to the skull surface, based on the Paxinos and Watson rat brain atlas ( 2005 ). Age- and sex-matched rats, not submitted to needle insertion, were considered as controls. At the end of the surgical procedure, the anesthesia was reversed with atipamezole (2 mg/kg i.p.; Antisedan, Pfizer) and the animals were given 6 days to recover. After the rest period, rats and wild-type mice were deeply anesthetized (for mice, the concentration of medetomidine was corrected to 1 mg/kg in the mixture) and immediately intracardially perfused with saline, followed by 4 % paraformaldehyde solution [(PFA, 0.1 M, pH 7.4, in phosphate saline buffer (PBS)]. Brains were removed and immersed in 4 % PFA (48 h), followed by 1 week in a 30 % sucrose PBS buffer (at 4 °C). Brains were then frozen by immersion in isopentane (BDH Prolabo; cooled in liquid nitrogen) in Neg-50 frozen section medium (Thermo Scientific, EUA) and stored at −20 °C until sectioning. The immunohistochemistry protocol was performed in cryosections (20 µm-thick) of mice (stratum radiatum, CA1, dorsal hippocampus; Figs. 2 , 3 , 4 ) and rat (layers 3–5, medial prefrontal cortex; Fig. 5 ) brains. Tissue slices were hydrated with PBS for 10 min and then permeabilized with PBS-T 0.3 % (0.3 % triton X-100, Sigma Aldrich, USA, in PBS) for 10 min. Antigen retrieval was then performed by immersing the slices in pre-heated citrate buffer (10 mM, pH 6.0; Sigma Aldrich, USA) during 20 min at microwave low potency. Once cooled, slices were rinsed in PBS and then in 10 % fetal bovine serum (FBS) in PBS. The slices were then incubated at room temperature for 30 min. The slices were incubated in the primary antibody, rabbit polyclonal anti-GFAP (1:200; Dako, Denmark) diluted in PBS-T 0.3 % 4 % FBS, and then incubated at 4 °C overnight. Next morning, tissue slices were rinsed in PBS and incubated with a secondary antibody, Alexa Fluor ® 594 goat anti-rabbit (1:1000; Molecular Probes ® , Invitrogen, USA) diluted in PBS during 90 min at room temperature, protected from light. DAPI staining was performed by a 10-min incubation (1:1000; Invitrogen, USA), followed by several rinses with PBS. Coverslips were mounted using Immu-Mount™ (Thermo Scientific, USA).
📊 Figures
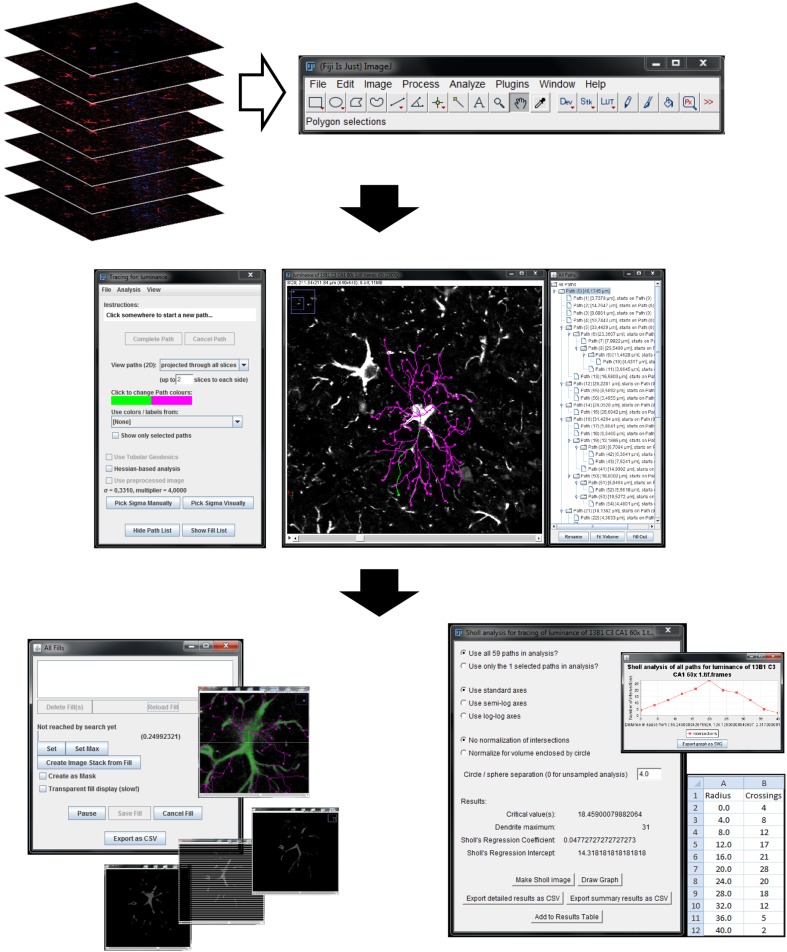
Fig.u00a01
Reconstruction of astrocyte 3D morphology using SNT. Upload Z-stack of confocal images to Fiji software for astrocytic reconstruction ( upper panel ); Simple Neurite Tracer (SNT) menu and 3D astrocyti...
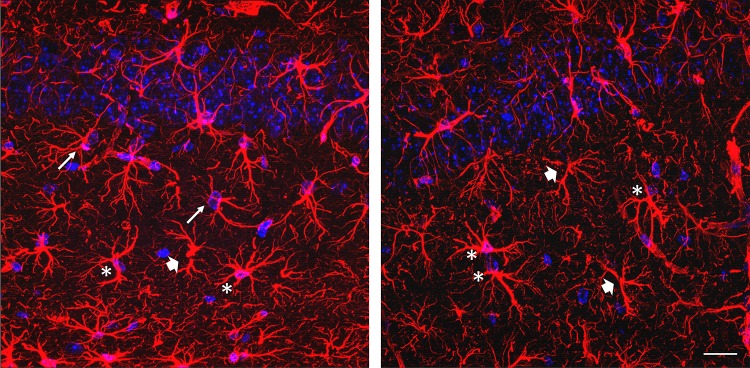
Fig.u00a02
Astrocytes selection criteria for 3D morphology reconstruction using SNT. Representative GFAPu2013DAPI staining micrographs (max projection) showing GFAP + cell suitable for 3D reconstruction ( asteri...
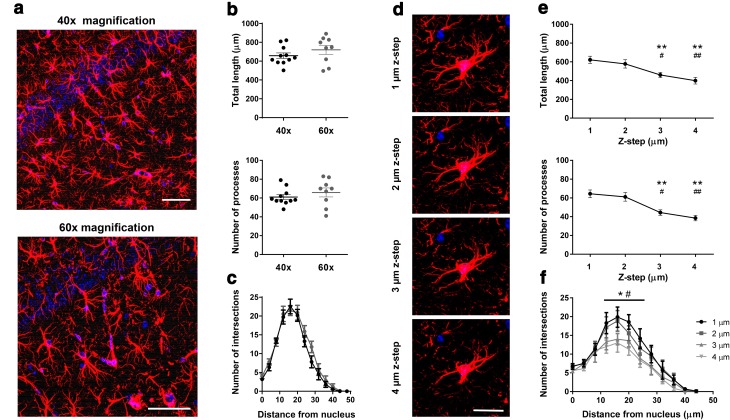
Fig.u00a03
Suitable image Z-stack properties for 3D reconstruction of astrocytes. a Representative GFAPu2013DAPI staining micrograph (max projection) under 40u00d7 and 60u00d7 magnification; scale bar 50u00a0u00...
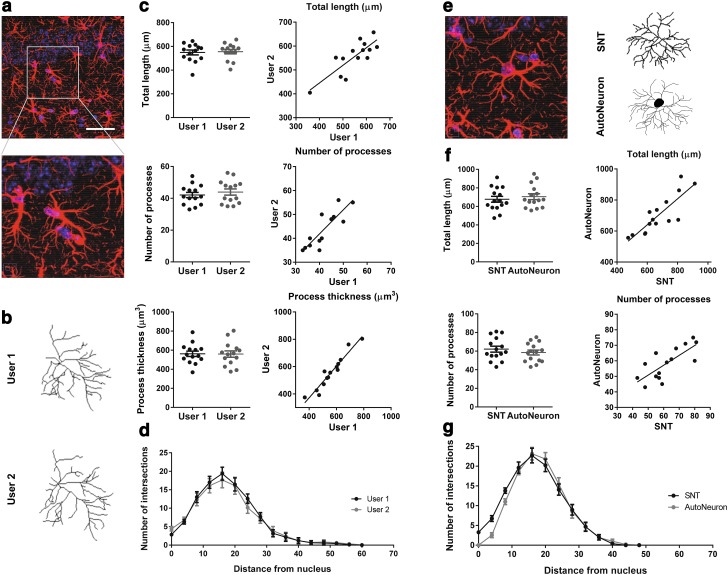
Fig.u00a04
Simple Neurite Tracer is a reliable tool to reconstruct astrocyte process arbors. a Representative GFAPu2013DAPI staining micrograph (max projection) under 60u00d7 magnification, showing detailed astr...
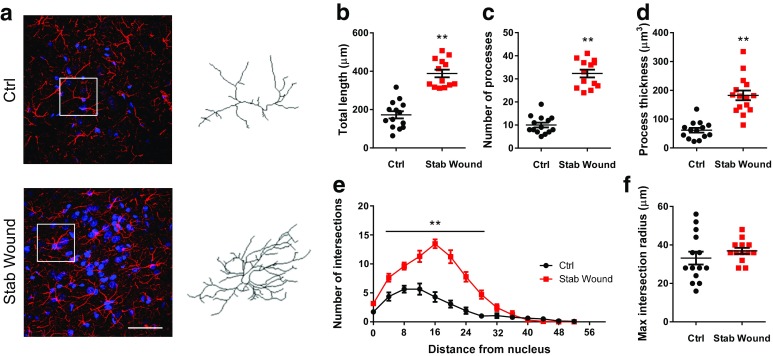
Fig.u00a05
Simple Neurite Tracer discriminates altered morphology states. a Representative micrographs of GFAPu2013DAPI staining (max projection) of rat brain sections, including the medial prefrontal cortex fro...
Figure images are served from the NIH/NLM PubMed Central Open Access Subset or Europe PMC; copyright remains with the publishers and authors.
💬 Discussion
0 commentsNo comments yet. Be the first to start a discussion!
Leave a Comment