Abstract
BACKGROUND: All three nitric oxide synthase (NOS) isoforms are expressed in atherosclerotic plaques. NOS enzymes in general catalyse NO production. However, under conditions of substrate and cofactor deficiency, the enzyme directly catalyse superoxide formation. Considering this alternative chemistry, the effects of NOS on key events in spontaneous hyperlipidemia driven atherosclerosis have not been investigated yet. Here, we evaluate how endothelial nitric oxide synthase (eNOS) modulates leukocyte/endothelial- (L/E) and platelet/endothelial- (P/E) interactions in atherosclerosis and the production of nitric oxide (NO) and superoxide by the enzyme. PRINCIPAL FINDINGS: Intravital microscopy (IVM) of carotid arteries revealed significantly increased L/E-interactions in apolipoproteinE/eNOS double knockout mice (apoE(-/-)/eNOS(-/-)), while P/E-interactions did not differ, compared to apoE(-/-). eNOS deficiency increased macrophage infiltration in carotid arteries and vascular cell adhesion molecule-1 (VCAM-1) expression, both in endothelial and smooth muscle cells. Despite the expression of other NOS isoforms (inducible NOS, iNOS and neuronal NOS, nNOS) in plaques, Electron Spin Resonance (ESR) measurements of NO showed significant contribution of eNOS to total circulating and vascular wall NO production. Pharmacological inhibition and genetic deletion of eNOS reduced vascular superoxide production, indicating uncoupling of the enzyme in apoE(-/-) vessels. CONCLUSION: Overt plaque formation, increased vascular inflammation and L/E- interactions are associated with significant reduction of superoxide production in apoE(-/-)/eNOS(-/-) vessels. Therefore, lack of eNOS does not cause an automatic increase in oxidative stress. Uncoupling of eNOS occurs in apoE(-/-) atherosclerosis but does not negate the enzyme's strong protective effects.
🔬 Techniques
✨ Fluorophores
🧪 Sample Preparation
🔬 Cell Lines
🏭 Microscope Brands
🧪 Reagent Suppliers
🏛️ Research Organizations (ROR)
Affiliated research institutions:
📋 Methods
Ethics statement
All procedures performed were approved by the ethics committee of University of Würzburg (Approval No. 54-2531.01-40/07).
Mice
Animals were backcrossed for 10 generations to the C57BL/6J genetic background. eNOS −/− , provided by Paul Huang [10] , and apoE −/− (Jackson Laboratories, Bar Harbor, ME, USA) were crossed to generate double heterozygous mice. Offsprings were crossed and progenies were genotyped for eNOS by southern blotting and for apoE by polymerase chain reaction. apoE −/− and apoE −/− /eNOS −/− were weaned at 21 days and fed a western-type diet for 18 weeks (42% of total calories from fat; 0.15% cholesterol; Harlan Teklad, USA). For clear visualisation of L/E-interactions through the vessel wall, IVM studies were performed after 10 weeks of western-type diet, prior to macroscopic lesion development in this vessel segment. Animals were maintained in pathogen free facility with 12 hours light/dark cycle. Assessment of L/E and P/E- interactions by IVM studies L/E- and P/E-interactions were assessed in vivo by use of video fluorescence microscopy [19] . Mice were anesthetized by intraperitoneal injection of a solution of midazolame (5 mg/kg body weight; Ratiopharm), medetomidine (0.5 mg/kg body weight; Pfizer), and fentanyl (0.05 mg/kg body weight; CuraMed Pharma GmbH). Due to easy accessibility, the carotid bifurcation was chosen for IVM studies. The right common carotid artery was carefully exposed, from 3 mm distal to 7 mm proximal to the carotid bifurcation. Tissues were continuously superfused with a thermostated bicarbonate-buffered saline solution, equilibrated with 5% CO 2 in nitrogen, to maintain a physiological pH. Polyethylene catheters were implanted into the right jugular vein for intravenous injections. For platelet isolation, blood was collected from the retro-orbital venous plexus of a donor mouse using heparin containing syringes. Blood was centrifuged at 400 g for 5 minutes. The supernatant was centrifuged at 250 g for 6 minutes to obtain platelet rich plasma. Subsequently, the platelets were isolated by centrifugation of the platelet rich plasma. The platelet pellet was re-suspended in PBS (pH 7.4) and incubated for 2 minutes with the fluorochrome carboxyfluorescein diacetate succinimidyl ester (CFSE, Molecular Probes). Labelled platelets were centrifuged and pellets were re-suspended in PBS and stored at room temperature until use. The suspension was adjusted to a final concentration of 50×10 6 platelets per 250 µl and infused intravenously into a recipient mouse. As reported earlier, platelet preparation did not increase P-selectin expression, indicating absence of platelet activation due to preparation procedures [29] . Leukocytes were stained in vivo by intravenous injection of 100 µl 0.02% rhodamine 6G (Molecular Probes). The carotid artery was visualized using a Zeiss Axiotech microscope (water immersion objective: 20×, W 20×/0.5; Zeiss) with a mercury lamp for epi-illumination. The experiments were done as previously described [19] . L/E- and P/E-interactions were determined at high magnification (500-fold) in a 200 µm×100 µm area. L/E- and P/E-interactions were studied 200 µm proximal to the carotid bifurcation, at a predilection site for plaque development, which did not show macroscopic lesions at the time of IVM. All images were videotaped and evaluated off-line, using a computer-assisted image analysis program (Cap Image 7.1; Dr. H. Zeintl, Ingenieurbüro Dr. Zeintl, Heidelberg, Germany). The cells that make an initial contact with the vessel wall followed by slow surface translocation (with several further contacts) with a velocity significantly lower than the centreline velocity were defined as ‘rolling cells’. Transiently adherent cells were defined as cells crossing an imaginary perpendicular through the vessel at a velocity significantly lower than the centreline velocity and were quantified as cells per mm 2 endothelial surface. Cells that did not move or detach from the endothelial surface within 20 seconds of observation were defined as firmly adherent cells. All experiments were performed by a blinded operator.
Show full methods section
Ethics statement
All procedures performed were approved by the ethics committee of University of Würzburg (Approval No. 54-2531.01-40/07).
Mice
Animals were backcrossed for 10 generations to the C57BL/6J genetic background. eNOS −/− , provided by Paul Huang [10] , and apoE −/− (Jackson Laboratories, Bar Harbor, ME, USA) were crossed to generate double heterozygous mice. Offsprings were crossed and progenies were genotyped for eNOS by southern blotting and for apoE by polymerase chain reaction. apoE −/− and apoE −/− /eNOS −/− were weaned at 21 days and fed a western-type diet for 18 weeks (42% of total calories from fat; 0.15% cholesterol; Harlan Teklad, USA). For clear visualisation of L/E-interactions through the vessel wall, IVM studies were performed after 10 weeks of western-type diet, prior to macroscopic lesion development in this vessel segment. Animals were maintained in pathogen free facility with 12 hours light/dark cycle. Assessment of L/E and P/E- interactions by IVM studies L/E- and P/E-interactions were assessed in vivo by use of video fluorescence microscopy [19] . Mice were anesthetized by intraperitoneal injection of a solution of midazolame (5 mg/kg body weight; Ratiopharm), medetomidine (0.5 mg/kg body weight; Pfizer), and fentanyl (0.05 mg/kg body weight; CuraMed Pharma GmbH). Due to easy accessibility, the carotid bifurcation was chosen for IVM studies. The right common carotid artery was carefully exposed, from 3 mm distal to 7 mm proximal to the carotid bifurcation. Tissues were continuously superfused with a thermostated bicarbonate-buffered saline solution, equilibrated with 5% CO 2 in nitrogen, to maintain a physiological pH. Polyethylene catheters were implanted into the right jugular vein for intravenous injections. For platelet isolation, blood was collected from the retro-orbital venous plexus of a donor mouse using heparin containing syringes. Blood was centrifuged at 400 g for 5 minutes. The supernatant was centrifuged at 250 g for 6 minutes to obtain platelet rich plasma. Subsequently, the platelets were isolated by centrifugation of the platelet rich plasma. The platelet pellet was re-suspended in PBS (pH 7.4) and incubated for 2 minutes with the fluorochrome carboxyfluorescein diacetate succinimidyl ester (CFSE, Molecular Probes). Labelled platelets were centrifuged and pellets were re-suspended in PBS and stored at room temperature until use. The suspension was adjusted to a final concentration of 50×10 6 platelets per 250 µl and infused intravenously into a recipient mouse. As reported earlier, platelet preparation did not increase P-selectin expression, indicating absence of platelet activation due to preparation procedures [29] . Leukocytes were stained in vivo by intravenous injection of 100 µl 0.02% rhodamine 6G (Molecular Probes). The carotid artery was visualized using a Zeiss Axiotech microscope (water immersion objective: 20×, W 20×/0.5; Zeiss) with a mercury lamp for epi-illumination. The experiments were done as previously described [19] . L/E- and P/E-interactions were determined at high magnification (500-fold) in a 200 µm×100 µm area. L/E- and P/E-interactions were studied 200 µm proximal to the carotid bifurcation, at a predilection site for plaque development, which did not show macroscopic lesions at the time of IVM. All images were videotaped and evaluated off-line, using a computer-assisted image analysis program (Cap Image 7.1; Dr. H. Zeintl, Ingenieurbüro Dr. Zeintl, Heidelberg, Germany). The cells that make an initial contact with the vessel wall followed by slow surface translocation (with several further contacts) with a velocity significantly lower than the centreline velocity were defined as ‘rolling cells’. Transiently adherent cells were defined as cells crossing an imaginary perpendicular through the vessel at a velocity significantly lower than the centreline velocity and were quantified as cells per mm 2 endothelial surface. Cells that did not move or detach from the endothelial surface within 20 seconds of observation were defined as firmly adherent cells. All experiments were performed by a blinded operator.
Evaluation of VCAM-1 RNA expression Total
RNA was isolated from the carotid arteries using a RNA Miniprep Kit (Stratagene, CA, USA). cDNA was synthesised from total RNA using the First Strand cDNA synthesis kit (Fermentas GmbH, Germany). mRNA expression of VCAM-1 and CD14 was quantified by real-time PCR (iCycler, Bio-Rad Laboratories, USA). PCR amplification was performed for 40 cycles at primer annealing of 60°C. VCAM-1 and CD14 expression was normalized to the HPRT signal. VCAM-1 sense: 5′-CTT GTG TTG AGC TCT GTG GGT TT-3′ and antisense: 5′-CAA TCT CCA GAT GGT CAA AGG GAT A -3′ . CD14 sense: 5′- TAC CGA CCA TGG AGC GTG TG-3′ and antisense: 5′-GCC GGT TAC CTC GAG ATT TT-3′ . HPRT sense: 5′- GTT GGA TAC AGG CCA GAC TTT GT-3′ and antisense: 5′- CCA CAG GAC TAG AAC ACC TGC-3′ . Fluorogenic probes for VCAM-1: 5′-6FAM- CTG TGC AGT TGA CAG TGA CAG GTC TCC C XT –PH; CD14: 5′-6FAM –TGT TGC TTC TGG TGC ACG CCT CT –TMR; HPRT: 5′-6FAM-CTC GTA TTT GCA GAT TCA ACT TGC GC XT –PH were used. All primers and probes were obtained from TIB Molbiol, Germany.
Histochemistry and immunohistochemistry
The area of the carotid arteries studied by IVM was stained with Oil red O. Additionally, immunohistochemistry for VCAM-1 and macrophages were done. The carotid arteries isolated from the anesthetized animals were embedded in Tissue-Tek® (Sakura Finetek, NL) and snap-frozen in liquid nitrogen. 5 µm sections were cut and air dried. Sections were stained with Oil red O or fixed in acetone for immunohistochemistry. Immunostaining for macrophage was performed using a mouse macrophage/monocyte monoclonal primary antibody (MOMA-2, Chemicon Int.) and for VCAM-1 using an anti-mouse VCAM-1 antibody (R&D systems). The macrophage and VCAM-1 stainings were visualised using DAB (Vector laboratories). Histomorphometry Photomicrographs of the carotid artery were taken with a Leitz-camera mounted on a light microscope (Carl-Zeiss, Jena, Germany). Pictures were digitalized and transferred to a PC for planimetry using Image Pro Plus (Version 4.1; Media Cybernetics). All images were analysed at 400-fold magnification. Macrophage positive areas and lipid rich areas in the common carotid artery, in an area corresponding to the one used for IVM studies, were measured. Results were expressed as % positively stained plaque area.
Double immunofluorescence
To investigate the cellular compartment of VCAM-1 expression, cryosections of the aortic arch of apoE −/− and apoE −/− /eNOS −/− mice were fixed with acetone. Following blocking procedures, cross reactivity of secondary antibodies with the alternating primary antibodies was ruled out. Expression of VCAM-1 protein in endothelial and smooth muscle cells was examined by double immunofluorescence. Slides were incubated with rat anti-VCAM-1 primary (BD Bioscience, 1∶20) followed by biotinylated rabbit anti-rat secondary antibody (Vector, 1∶50) and subsequently stained with streptavidin-texas red complex. After washing, slides were incubated with the antibodies directed against endothelial cells (rat anti-mouse CD 31, BD Bioscience, 1∶100) or vascular smooth muscle cells (α-actin, Sigma, 1∶60). The latter antibodies were directly labelled with fluoresceinisothiocyanate (FITC, green). Finally, all sections were mounted with 4′,6-diamidino-2-phenylindole (DAPI) mounting media and examined with a confocal microscope (Zeiss). Hemodynamics of the carotid circulation The animals were anesthetized and the common carotid artery was visualized by duplex colour ultrasonography using an ultrasound system with a 15 MHz transducer (NICE, Toshiba Medical Systems, The Netherlands). The resistance index of the common carotid artery was calculated as the difference between the maximum systolic (V sys ) and the end-diastolic flow velocity (V dia ) divided by V sys .
Measurement of vascular
NO production by electron paramagnetic spintrapping Detection of NO in the aorta was performed using colloid iron (II) diethyldithiocarbamate (Fe(DETC) 2 ) according to a method which we adapted for detection of baseline NO production in aortic rings of apoE −/− mice [30] . Briefly, animals were anesthetized with pentobarbital (80 µg/kg i.p.) and the aorta was perfused with 2 ml of Krebs-Hepes Buffer (KHB) through the left ventricle. The aorta was removed rapidly and placed in a petridish containing KHB. Perivascular fatty tissue was removed while the aorta was maintained at 4°C in KHB using a cold plate (Noxygen Science Transfer & Diagnostics, Denzlingen, Germany). The aorta was cut into 2 mm rings and placed in one well of a 24 well plate containing KHB. Subsequently, the aortic rings were incubated in the colloidal Fe-(DETC) 2 spin trap solution for 1 hour. The spin trap was freshly prepared by mixing equal amounts of deoxygenated 1.6 mM FeSO 4 and 3.2 mM DETC solutions. For pharmacological NOS inhibition samples were incubated with the NOS inhibitor, NG-nitro-L-arginine methyl ester (L-NAME) for 30 minutes at 37°C prior to the addition of spin trap. ESR measurements were done using a bench top e-scan ESR spectroscope (Bruker BioSpin GmbH, Germany). The instrumental settings were as follows: Centre field: 3308 G. Sweep width: 80 G. Microwave frequency: 9.495 GHz. Microwave power: 50 mW. Modulation Amplitude: 4.6 G. Modulation frequency: 86 kHz. Time constant: 81.92 ms. Conversion Time: 20.48 ms. Number of scans: 100. The protein content of the samples was quantified using a BCA protein assay kit (Pierce, IL, USA).
Measurement of NO bioavailability in the blood stream
Nitrosyl hemoglobin, a reaction product of deoxygenated hemoglobin with NO is an in vivo marker for NO bioavailability in the circulation [31] and can be detected as a characteristic triplet peak by ESR spectroscopy. Blood samples were prepared according to a published method [32] . Briefly, the venous blood was drawn from the right ventricle. Following centrifugation at 2000 g (Eppendorf AG, Germany) the red cell cast was frozen in syringes and transferred into a finger dewar containing liquid nitrogen. The spectra were acquired using an X-band EMX spectroscope (Bruker BioSpin GmbH, Germany) with the following instrument settings: Centre field: 3340 G. Sweep width: 230 G. Microwave frequency: 9.452 GHz. Microwave power: 47.6 mW. Modulation Amplitude: 4.76 G. Modulation frequency: 86 kHz. Time constant: 40.96 ms. Conversion Time: 10.24 ms. Number of scans: 24. The NO concentration was determined from a calibration curve generated by incubating blood samples with known concentrations of nitrite and sodium dithionite (Na 2 S 2 O 4 ).
Measurement of intracellular superoxide production by HPLC-detection of oxyethidium
Superoxide production was measured by incubating vessel rings in KHB containing 50 µM dihydroethidium for 1 hour at 37°C [33] . Aortic rings were then homogenized in ice cold methanol, filtered and separated by reverse phase High Performance Liquid Chromatography (HPLC) using a C-18 column (Nucleosil 250, 4.5 mm; Sigma-Aldrich) along with an AKTA HPLC system (Amersham Biosciences, GE Healthcare). Oxyethidium, the reaction product of superoxide and dihydroethidium was quantitated with a fluorescence detector (Jasco, UK) at an excitation wavelength of 510 nm and emission wavelength of 595 nm. The amount of oxyethidium formed was normalised to the protein content of the samples.
Measurement of vascular superoxide production by ESR
Production of superoxide was measured in aortic rings according to a previously published protocol [34] using the above mentioned e-scan spectroscope. Superoxide production was assessed by pre incubating aortic rings with PEG-SOD (100 U/ml) parallel to the spin trap 1-hydroxy-3-methoxycarbonyl-2,2,5,5-tetramethylpyrrolidine (CMH) in KHB for 1 hour at 37°C. The conversion of CMH to CM. radical in the PEG-SOD untreated samples was used to determine the total production of reactive oxygen species (ROS). The instrumental settings were as follows: Centre field: 3388 G. Sweep width: 132 G. Microwave frequency: 9.497 GHz. Microwave power: 1.25 mW. Modulation Amplitude: 1.63 G. Modulation frequency: 86 kHz. Time constant: 40.96 ms. Conversion Time: 10.24 ms. Number of scans: 50. The intensity of the ESR signal was normalized to the sample's protein content using a BCA protein assay kit.
Western blot analysis
Aortic protein was isolated using RIPA buffer and western blots were performed using a monoclonal rabbit anti-eNOS, anti-nNOS (BD Biosciences) and a polyclonal anti-iNOS (Santa Cruz Biotechnology, Inc.) antibodies. To confirm equal loading of protein a goat anti-α-actin-antibody (Santa Cruz Biotechnology, Inc.) was used. Blots were analysed densitometrically using Scan Pack software (Biometra, Gottingen, Germany) and the density of protein bands for iNOS and nNOS were normalised to the corresponding α-actin bands of the same blots. Low temperature SDS-PAGE followed by western blot was done as mentioned previously for eNOS dimer/monomer protein detection [35] .
Statistical analyses
All data were expressed as mean±SE. Two way ANOVA was used for repeated measures, followed by Scheffe's F-test (Stat View 4.51, Abacus Concepts, Inc., Berkley, CA, USA). Student's t -test was used for unpaired data. A probability value of p≤0.05 was considered significant.
📊 Figures
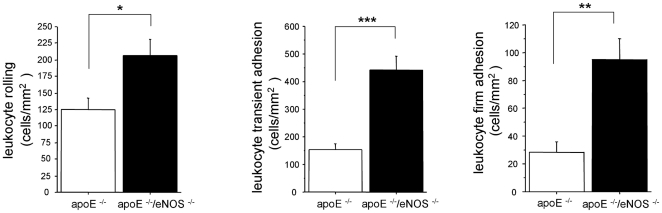
Figure 1
L/E-interactions analysed by intravital microscopy.
The number of rolling, transiently adherent and firmly adherent leukocytes was significantly increased in the common carotid artery of apoE u2212/u2212 /eNOS u2212/u2212 (nu200a=u200a16), vs. apoE u22...
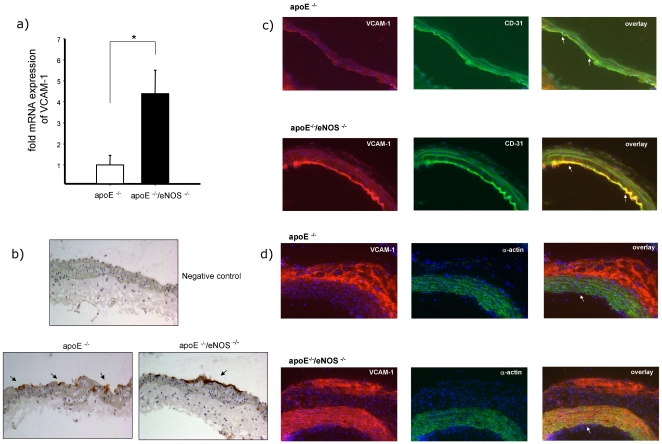
Figure 2
eNOS deletion increases VCAM-1 expression.
a) Real time PCR analysis showed four fold increased expression of VCAM-1 mRNA in apoE u2212/u2212 /eNOS u2212/u2212 (nu200a=u200a9) carotids, compared to apoE u2212/u2212 (nu200a=u200a20, *p<0.01)...
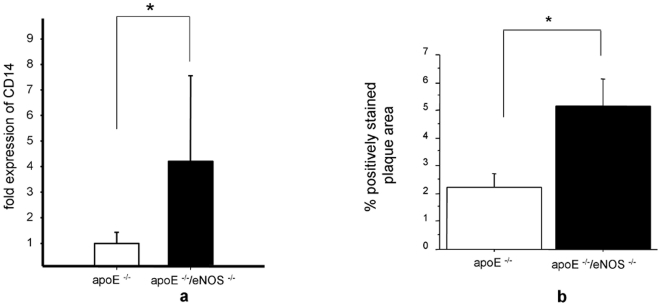
Figure 3
NO from eNOS influences macrophage infiltration in the vascular wall.
a) Real time PCR analysis of CD14 showed significantly increased expression of CD14 mRNA in apoE u2212/u2212 /eNOS u2212/u2212 (nu200a=u200a12) carotids, compared to apoE u2212/u2212 (nu200a=u200a17, ...
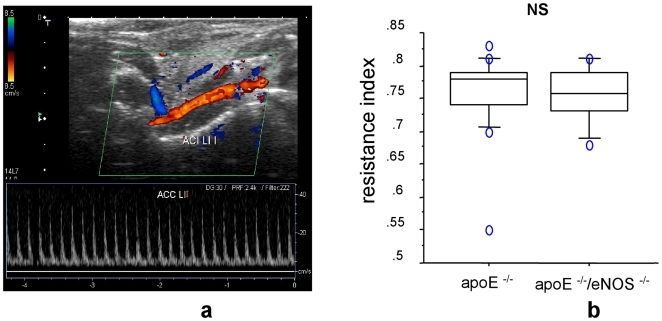
Figure 4
Unaltered vascular resistance index in eNOS deficiency.
a) Representative picture of duplex ultrasonography in carotid arteries. b) Equal resistance index of carotid arteries from apoE u2212/u2212 , nu200a=u200a17, vs. apoE u2212/u2212 /eNOS u2212/u2212 , ...
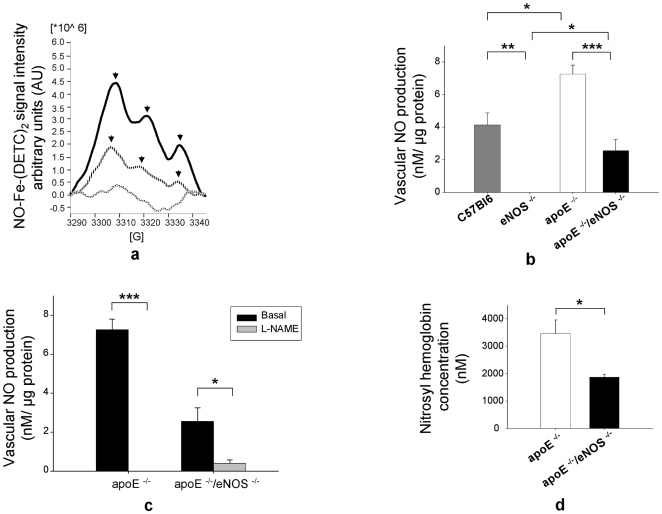
Figure 5
eNOS is a significant source of vascular wall NO production and circulating NO.
a) ESR spectrum of NO-Fe-(DETC) 2 in aortas of apoE u2212/u2212 and apoE u2212/u2212 /eNOS u2212/u2212 . Bold lines indicate apoE u2212/u2212 , stripped lines apoE u2212/u2212 /eNOS u2212/u2212 and pa...
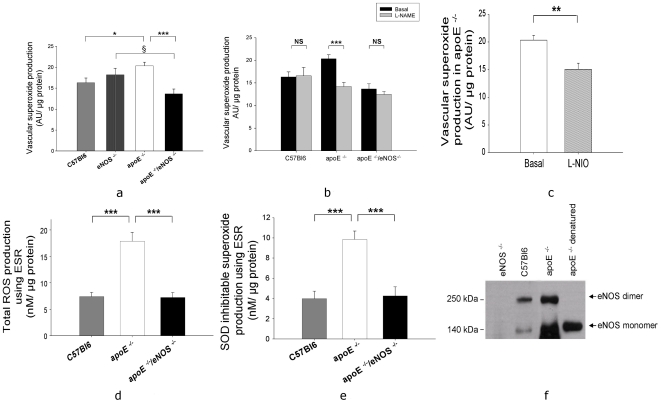
Figure 6
eNOS is uncoupled and contributes to vascular production of superoxide in apoE u2212/u2212 mice.
a) HPLC measurements showed lower levels of superoxide production in apoE u2212/u2212 /eNOS u2212/u2212 (nu200a=u200a13) vs. apoE u2212/u2212 (nu200a=u200a23). Superoxide levels were higher in apoE u2...
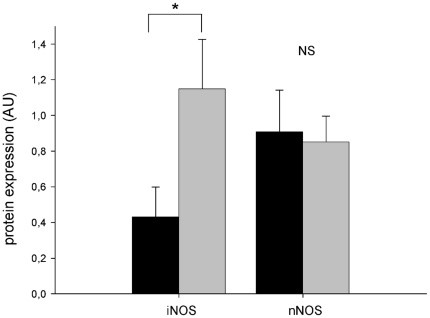
Figure 7
Vascular expression of NOS isoforms.
Significantly increased expression of iNOS protein in the aorta of apoE u2212/u2212 /eNOS u2212/u2212 (nu200a=u200a10) compared to apoE u2212/u2212 mice (nu200a=u200a10). The protein levels of nNOS di...
Figure images are served from the NIH/NLM PubMed Central Open Access Subset or Europe PMC; copyright remains with the publishers and authors.
💬 Discussion
0 commentsNo comments yet. Be the first to start a discussion!
Leave a Comment