Abstract
Prangos ferulacea plant is very popular in Iran due to its unique properties in treating diseases and its special flavor. To check the characteristics of this plant, first, its extract was extracted using the maceration method. Its chemical composition was investigated using high-performance liquid chromatography (HPLC) that p-coumaric was identified as its main compound, and Fourier-transform infrared spectroscopy (FTIR) showed the presence of functional groups related to phenolic, flavonoid, tannins, and carboxylic acids such as caffeic acid and coumaric acid composition. Total phenol content (TPC), total flavonoid content (TFC), and beta-carotene were equal to 202.04 ± 5.46 mg gallic acid equivalent (GAE)/g dry weight, 1,909.46 ± 13 μg quercetin (QE)/g of dry weight, and 2.91 mg/100 g. The antioxidant property of the extract was evaluated using 2,2-Diphenyl-1-picrylhydrazyl (DPPH) and 2,2'-azino-bis (3-ethylbenzothiazoline-6-sulphonic acid (ABTS) free radical scavenging and ferric reducing antioxidant power assay (FRAP). According to the IC50 obtained for DDPH (274 ± 7.2 μg/mL) and ABTS (120.45 ± 9.6 μg/mL) and FRAP values [1.92 ± 0.05 μg ascorbic acid equivalent (AAE)/g of extract], this extract had high antioxidant properties. Cytotoxicity was evaluated against the survival of HT 29 cells that IC50 was 82.15 ± 0.02 μg/mL. The antimicrobial property of the extract was calculated using disk diffusion agar (DDA), well diffusion agar (WDA), minimum inhibitory concentration (MIC), and minimum bactericidal concentration (MBC). Listeria monocytogenes has the highest sensitivity to this extract and inhibition zone based on DDA and WDA method and with an MIC and MBC equal to 16 and 128 mg/mL has the least resistance. The morphology change of L. monocytogenes strain was proved through scanning electron microscope (SEM) and confocal laser scanning microscopy (CLSM). The extract caused a significant reduction in the transcription of genes involved in the film formation ability of L. monocytogenes. The obtained results fully prove the very practical and pragmatic characteristics of P. ferulacea.
🔬 Techniques
🧬 Organisms
🧪 Sample Preparation
🔬 Cell Lines
🏭 Microscope Brands
🧪 Reagent Suppliers
💻 Software Details
🏛️ Research Organizations (ROR)
Affiliated research institutions:
📋 Methods
2.1. Culture medium, strains, and growth conditions Mueller Hinton agar (MHA), Mueller Hinton broth (MHB), and tryptic soy broth (TSB) were prepared from Difco Laboratories, Detroit, MI, USA. All the strains used in this study were prepared as lyophilized from the National Center for Biological and Genetic Resources of Iran and were, respectively, subcultured in MHB for 24 h at 37°C under sterile conditions. To prepare a fresh microbial suspension, the obtained stock culture was subcultured in slant nutrient agar and washed several times with a sterile ringer solution. A microbial suspension with a 0.5 McFarland standard (1.5 × 10 8 CFU/mL) was produced by adjusting the suspension's optical density at 630 nm. L. monocytogenes strains were cultured in TSB at 37°C for 24 h. 2.2. Isolation of P. ferulacea extract The P. ferulacea plant used in this project has been identified by the herbarium of Khuzestan University of Agricultural Sciences and Natural Resources. The extract was prepared through the maceration method performed by Behbahani et al. ( 2017 ). First, the collected plant from the southern region of Iran was separated from its flowers and soil and washed completely using distilled water. Then, it was kept at 37°C until completely dry, after that, was crushed using a laboratory mill (Moulinex, Germany). In a beaker, the dry plant was mixed with distilled water at a ratio of 1 to 10 (w/v) and the sample was placed on a stirrer at ambient temperature for 24 h with stirring. Then, the sample was filtered using filter paper (Whatman No. 2) and immediately centrifuged. Finally, the evaporation operation was performed using a rotary, and the obtained sample was stored in the refrigerator for later use (Behbahani et al., 2017 ). 2.3. Identification of the chemical structure of the extract 2.3.1. HPLC The phenolic acid, flavonol, and flavonoid components of plant crude extract were identified and quantified by obtained retention time and standard cure of internal standard (0.1–10 mg/L) through HPLC with the following specifications: a binary pump (G1312A; Agilent 1100); an autosampler (G1330B); a mass spectrometer with an electrospray ionizer source (MS; ESI-; Micromass Quattro Micro; Waters, Milford, MA, USA); reversed phase, a Kinetex C18 column (100 × 2.00 mm; 2.6 μm); capillary voltage, 3.0 kV; cone voltage, 20 V; extractor, 2 V; source temperature of 100°C; desolvation temperature of 350°C; cone gas flow of 30 L/h; desolvation gas flow of 350 L/h; mobile phase [0.1% formic acid (A) and acetonitrile (B)] with a gradient of 0–2 min, 10% B; 2–20 min, 10–60% B; 20–21 min, 60–80% B; 21–25 min, 80% B; 25–26 min, 80–10% B; 26–30 min, 10% B (injection volume of 10 μL and flow rate of 0.300 mL/min) (Terpinc et al., 2016 ). 2.3.2.
Show full methods section
2.1. Culture medium, strains, and growth conditions Mueller Hinton agar (MHA), Mueller Hinton broth (MHB), and tryptic soy broth (TSB) were prepared from Difco Laboratories, Detroit, MI, USA. All the strains used in this study were prepared as lyophilized from the National Center for Biological and Genetic Resources of Iran and were, respectively, subcultured in MHB for 24 h at 37°C under sterile conditions. To prepare a fresh microbial suspension, the obtained stock culture was subcultured in slant nutrient agar and washed several times with a sterile ringer solution. A microbial suspension with a 0.5 McFarland standard (1.5 × 10 8 CFU/mL) was produced by adjusting the suspension's optical density at 630 nm. L. monocytogenes strains were cultured in TSB at 37°C for 24 h. 2.2. Isolation of P. ferulacea extract The P. ferulacea plant used in this project has been identified by the herbarium of Khuzestan University of Agricultural Sciences and Natural Resources. The extract was prepared through the maceration method performed by Behbahani et al. ( 2017 ). First, the collected plant from the southern region of Iran was separated from its flowers and soil and washed completely using distilled water. Then, it was kept at 37°C until completely dry, after that, was crushed using a laboratory mill (Moulinex, Germany). In a beaker, the dry plant was mixed with distilled water at a ratio of 1 to 10 (w/v) and the sample was placed on a stirrer at ambient temperature for 24 h with stirring. Then, the sample was filtered using filter paper (Whatman No. 2) and immediately centrifuged. Finally, the evaporation operation was performed using a rotary, and the obtained sample was stored in the refrigerator for later use (Behbahani et al., 2017 ). 2.3. Identification of the chemical structure of the extract 2.3.1. HPLC The phenolic acid, flavonol, and flavonoid components of plant crude extract were identified and quantified by obtained retention time and standard cure of internal standard (0.1–10 mg/L) through HPLC with the following specifications: a binary pump (G1312A; Agilent 1100); an autosampler (G1330B); a mass spectrometer with an electrospray ionizer source (MS; ESI-; Micromass Quattro Micro; Waters, Milford, MA, USA); reversed phase, a Kinetex C18 column (100 × 2.00 mm; 2.6 μm); capillary voltage, 3.0 kV; cone voltage, 20 V; extractor, 2 V; source temperature of 100°C; desolvation temperature of 350°C; cone gas flow of 30 L/h; desolvation gas flow of 350 L/h; mobile phase [0.1% formic acid (A) and acetonitrile (B)] with a gradient of 0–2 min, 10% B; 2–20 min, 10–60% B; 20–21 min, 60–80% B; 21–25 min, 80% B; 25–26 min, 80–10% B; 26–30 min, 10% B (injection volume of 10 μL and flow rate of 0.300 mL/min) (Terpinc et al., 2016 ). 2.3.2.
FTIR test
In this analysis, the extract was mixed with potassium bromide and then compressed into a suitable tablet form. Then, the FTIR spectrum of the extract was recorded using an FTIR spectrophotometer (Perkin Elmer, USA) in the range of 400–4,000 cm −1 wave number with a resolution of 4 cm −1 (Behbahani et al., 2019 ). 2.4.
Measurement of TPC and TFC
Behbahani et al. ( 2017 ) procedures were used to evaluate TPC and TFC. For TPC, first, a concentration of 1% of P. ferulacea extract was prepared and mixed with 2 mL distillated water, and 10 μL of this extract was combined with 50 μL of Folin–Ciocalteu reagent and stirred for 3 min. After adding 300 μL of sodium bicarbonate, the solution was shaken for 2 h and the absorption value of the solutions was obtained at a wavelength of 765 nm through a spectrophotometer (Sigma3–30k). Gallic acid solutions (concentrations of 0, 25, 75, 50, 100, 150, 125, 175, and 200 mg of gallic acid/L) were used as a standard. Through the calibration curve of the gallic acid solution and the absorbances obtained from the P. ferulacea extract, the TPC value was obtained in terms of mg of GAE/g of extract. For TFC, the response was calculated as mg quercetin equivalence/g of extract, and the aluminum chloride method was used to calculate TFC (Behbahani et al., 2017 ). 2.5.
Beta-carotene measurement
The method of Zengru and Tongming ( 1998 ) was used based on HPLC {Knauer, Germany, a C18 column [4.6 mm ID × 150 mm (5 μm)], with a UV detector (at 350 nm)} for beta-carotene measurement (Zengru and Tongming, 1998 ). 2.6. Antioxidant property assessment 2.6.1.
DPPH assay
DPPH was used to calculate the antioxidant activity through the inhibitory effect of P. ferulacea extract against free radicals. First, the 500 to 10 μg/mL concentrations of extracts were prepared in methanol and 1 mL of DPPH solution (0.2 mM, methanolic solution) was added to it and placed in the dark for 30 min at a temperature of 24°C. A wavelength of 517 nm was used to obtain the absorbance of the sample (A sample), and the sample without extract was used as a control (A blank). Finally, antioxidant activity was measured using the following equation: I% = ( A blank – A sample / A blank ) × 100. The obtained number was reported as IC50, which indicates the concentration of the extract that can inhibit 50% of DPPH radicals. The positive control used in this method was vitamin C and TBHQ (Yeganegi et al., 2018 ). 2.6.2.
ABTS inhibition method
ABTS radical scavenging activity was measured according to Labiad et al. ( 2017 ) method as follows: preparation of stock solutions of 7 mM ABTS and 2.4 mM potassium persulfate in a 1:1 ratio, kept in the dark at 24°C for 14 h, diluting the solution with ethanol until absorbance of 0.700 ± 0.02 at 734 nm, mixing 2 mL of the resulting inhibitor solution with 200 mL of plant extracts (different concentrations), keeping at room temperature for 30 min to perform the reaction, and stirring the sample and absorbance read at 734 nm. At the same time, the above steps were performed for ascorbic acid (oxo-3-golofuranolactone acid) and TBHQ with different concentrations (1–100 μg/mL) as positive controls. The obtained number was reported in terms of IC50 (Labiad et al., 2017 ). 2.6.3. The ferric ion (Fe3+) reducing antioxidant power This procedure is based on the effect of the extract in reducing the ferricyanide complex to ferrous form. First, solutions including extract solution (different nutrients), 2.5 mL of phosphate buffer (0.2 M, pH 6.6), and 2.5 mL of potassium ferricyanide (1% w/v and 2) were prepared, and the incubation process was carried out at 50°C for 20 min. In the step after adding 2.5 mL of trichloroacetic acid (10% w/v), the centrifuge was directed at 1,000 g for 10 min. Absorbance of a solution containing 5 mL of supernatant with 5 mL of deionized water and 1 mL of ferric chloride (0.1%, w/v) was calculated at 700 nm during the reaction time of 30 min. The reducing power of the extracts was expressed as mg ascorbic acid (AA) equivalent per g of dry weight extract (AA/g). All steps mentioned for the extract were performed separately for ascorbic acid as a standard (Labiad et al., 2017 ). 2.7.
Cytotoxicity by MTT assay
Cytotoxicity against HT29 cell line (IBRC cell number C10097 , National Center for Genetic Resources and Bioscience of Iran) was evaluated through MTT protocol (3-(4,5-dimethylthiazol-2-yl)-2,5-diphenyltetrazolium bromide). The cells were cultured in DMEM 2 (Dulbecco's Modified Eagle Medium) containing 10% fetal bovine serum and penicillin/streptomycin. The solution was incubated in an incubator with a temperature of 37°C, 95% humidity, and 5% carbon dioxide. Approximately 100,000 cells per one of the wells of 96 houses was added and, also, in the DMEM culture medium, 200 μL of fetal bovine serum and different doses of plant extract (0, 10, 25, 50, 100, and 200 mg/mL) was added to each of the wells. After 24 h of incubation, for cell proliferation measurement, 30 μL of MTT solution (concentration of 5 mg/mL) was added to each of the wells and the plates were placed in a carbon dioxide incubator for 3 h. In the next step, the medium was isolated, 200 μL of dimethyl sulfoxide (DMSO) was added to each of the wells, and the absorbance at a wavelength of 570 nm was recorded using an ELISA reader (ELX 808, Bio Tek Instruments, USA). Cell survival curves were drawn using control cells (Samani et al., 2022 ). 2.8. Microbial assay 2.8.1.
Disk diffusion agar method
The strains of L. monocytogenes, Bacillus cereus, Salmonella enterica serovar Typhimurium, Staphylococcus aureus, Escherichia coli, Shigella dysentery , and Staphylococcus epidermidis were investigated as pathogens. One of the common methods to evaluate the antimicrobial activity of plant extracts is DDA. First, concentrations of 20, 40, 60, and 80 mg/mL of P. ferulacea plant extracts were prepared, and then, a 0.22 μm syringe microfilter was used for their sterilization. In the next steps, the disks were placed in these solutions for 15 min to be completely soaked in the extract. The prepared microbial suspension equivalent to 1.5 × 10 8 CFU/mL (corresponding to 0.5 McFarland standard) was used to smear a sterile swab during the inoculation step. The plates were then rotated by 60°, and culturing was carried out again to ensure that the medium surface was thoroughly smeared with the respective microorganisms. Then, the disks that had previously been submerged in particular concentrations of the extract became immobile on the medium's surface. Incubation of the culture medium at 37°C was done for 24 h, and the inhibition zone (IZ) (mm) unit was used to express the antimicrobial effect. Ciprofloxacin antibiotic was used as a positive control (Behbahani et al., 2017 ). 2.8.2. Well diffusion agar To measure the diameter of the IZ created by the plant extract, the MHA culture medium was prepared and poured into a petri dish; then, some microbial suspension was spread on the MHA medium using an L-shaped spreader. In the next step, several wells with a diameter of 6 mm were created on the surface of the culture medium, and 20 μL of extract with concentrations of 20, 40, 60, and 80 mg/mL were poured into the wells. The cultures were kept in the incubator for 24 h at 37°C, and the diameter of the IZs around the well was measured and expressed in mm (Behbahani et al., 2017 ). 2.8.3. Determination of minimum inhibitory/bactericidal concentration by broth microdilution method The MIC measurement was done as follows: preparation of a culture with a number of 1.5 × 10 8 CFU/mL (equivalent to 0.5 McFarland standard) of bacteria, preparation of extract solution in DMSO solution (1 mg/mL), successive dilution of the solution with MHB, adding 125 μL of microbial suspension to each well of the plate (96-well plate) (equivalent to 0.5 McFarland standard), keeping in an incubator at 37°C for 24 h, and adding 25 μL of reagent solution of triphenyltetrazolium chloride (5 mg/mL). In the wells where the microbe had grown, a deep red or amethystine color appeared in less than half an hour. As a result, the lowest concentration in which no microbial growth was observed and no color change was observed was considered MIC. To determine the MBC value, 100 μL of the media from each well (absence of red color in the plate) were cultured on MHA and incubated at 37°C for 24 h. The minimum dilution that caused whole prevention of growth was considered MBC (Behbahani et al., 2017 ). 2.9. Morphology assessment 2.9.1. SEM First, a microbial strain of L. monocytogenes was separated by centrifuging the microbial suspension (5,000 × g for 5 min), and then washing with 0.1 M sodium phosphate buffer (pH 7) and filtration with a polycarbonate filter were done. The concentration of 2.5% (v/v) glutaraldehyde solution was used for stabilization, and the incubation of the dissolved microbial sample was done at refrigerator temperature for 2 h. Distilled water and ethanol were used for the final dehydration and washing, respectively. After drying the sample in a vacuum, it was covered with a layer of gold and examined SEM (LEO 1450 VP model, Germany) (Alizadeh Behbahani et al., 2020 ). 2.9.2. CLSM The method of Bandara et al. ( 2013 ) was used to evaluate the effect of the extract on the biofilm creation of L. monocytogenes . For this test, biofilm was prepared using pre-sterilized flat bottom six-well plates (Iwaki) and pre-sterilized plastic coverslips (Thermanox plastic coverslips; Nalge Nunc International, Rochester, NY, USA). The L. monocytogenes suspension was added to the first plate (pre-sterilized coupons (stainless steel, Ø 12.7 mm) were placed in the wells of three different six-well plates) and incubated for 24 h in an orbital shaker (75 rpm) at 37°C. The pre-washed coupons were stained with live and dead spots and examined (Bandara et al., 2013 ). 2.10. Investigating the effect of the extract on the gene expression of biofilm formation by L. monocytogenes 2.10.1. RNA isolation and cDNA synthesis First, L. monocytogenes bacteria were cultured in TSB medium at 37°C, and to achieve a bacterial count of 10 8 CFU/mL, 2 mL of the culture was added to 40 mL of fresh TSB by measuring through a spectrophotometer and achieving an OD of 600 nm. It was diluted equal to 0.3. The 4.8 mL aliquot of the bacterial sample was mixed with 200 μL of pennibacterin solution (adding PBS for dilution) to prepare dilutions of 1.7, 3.4, and 6.8 μg/mL (diluted culture mixture with PBS as a positive control). Then, the obtained compounds were kept in an incubator at a temperature of 37°C for 4 h with stirring. After centrifugation, washing the obtained sample with PBS, extracting the total RNA from the washed sample using a commercial kit (RNAiso Plus kit; TaKaRa Dalian Biotechnology, Dalian, China) was done. Then, RNA was analyzed using agarose gel electrophoresis (DYY-8C, Beijing Liuyi Biotechnology, Beijing, China), and RNA purity was analyzed by spectrophotometer (MD2000D, Biofuture, Cambridge, UK) (Li et al., 2018 ). For cDNA synthesis, first purification and removal of residual DNA with RNase-Free DNase (RQ1; Promega Biotech, Wisconsin, USA) were performed. Then, the following steps were carried out in order: Incubation of 10 μL of the mixture including 1 μL 10 × reaction buffer, 1 μL DNase, 7 μL RNase-Free H 2 O, and 1 μL extracted RNA at 37°C for half an hour, stopping the reaction with 1 μL of DNase stop solution, incubation of the mixture at 65°C for 10 min, using a commercial reaction kit (PrimeScript™ RT reagent Kit; TaKaRa Dalian Biotechnology, Dalian, China) for cDNA synthesis, incubation of 20 μL of a mixture consisting of 1 μL reverse transcriptase (RT) mix, 2 μL RT primer mix, 4 μL 5 × buffer, 2 μL RNase-Free dH 2 O, and 11 μL DNA-free RNA mix at 37°C for 15 min, heating the mixture for 5 s in 85°C to inactivate the enzyme (Li et al., 2018 ). 2.10.2. Real-time polymerase chain reaction The results of RT-PCR were calculated using the 2 −Δ ΔCq method described by Kim et al. ( 2021 ). RT-PCR was applied to appraise the expression of biofilm-related and reference genes (Miao et al., 2019 ). Table 1 contains a list of the RT-PCR primer sequences. RT-PCR was performed in a 25-μL system using SYBR ® Premix Ex Taq™ II (TakaRa). One cycle of 95°C for 30 s, 40 cycles of 95°C for 5 s and 60°C for 30 s, and dissociation steps of 95°C for 15 s and 60°C for 30 s were all included in the cycling conditions. Table 1 Genes used in this study. Gene Primer sigB Forward GATGATGGATTTGAACGTGTGAA Reverse CGCTCATCTAAAACAGGGAGAAC agrA Forward ATGAAGCAAGCGGAAGAAC Reverse TACGACCTGTGACAACGATAAA prfA Forward CGGGAAGCTTGGCTCTATTTG Reverse GCTAACAGCTGAGCTATGTGC hly Forward AACCAGATGTTCTCCCTGTA Reverse CACTGTAAGCCATTTCGTCA plcB Forward CAGGCTACCACTGTGCATATGAA Reverse CCATGTCTTCYGTTGCTTGATAATTG flaA Forward CTGGTATGAGTCGCCTTAG Reverse CATTTGCGGTGTTTGGTTTG inlB Forward AAGCAMGATTTCATGGGAGAGT Reverse TTACCGTTCCATCAACATCATAACTT 2.11.
Statistical analysis
Experiments were repeated three times, and data were analyzed by using a one-way analysis of variance (ANOVA) (SPSS, version 17, SPSS Inc., Chicago, IL). Means were further classified using the Tukey as a post-test. P -values of 5% were considered significant.
2.6.2.
ABTS inhibition method
ABTS radical scavenging activity was measured according to Labiad et al. ( 2017 ) method as follows: preparation of stock solutions of 7 mM ABTS and 2.4 mM potassium persulfate in a 1:1 ratio, kept in the dark at 24°C for 14 h, diluting the solution with ethanol until absorbance of 0.700 ± 0.02 at 734 nm, mixing 2 mL of the resulting inhibitor solution with 200 mL of plant extracts (different concentrations), keeping at room temperature for 30 min to perform the reaction, and stirring the sample and absorbance read at 734 nm. At the same time, the above steps were performed for ascorbic acid (oxo-3-golofuranolactone acid) and TBHQ with different concentrations (1–100 μg/mL) as positive controls. The obtained number was reported in terms of IC50 (Labiad et al., 2017 ).
2.8.1.
Disk diffusion agar method
The strains of L. monocytogenes, Bacillus cereus, Salmonella enterica serovar Typhimurium, Staphylococcus aureus, Escherichia coli, Shigella dysentery , and Staphylococcus epidermidis were investigated as pathogens. One of the common methods to evaluate the antimicrobial activity of plant extracts is DDA. First, concentrations of 20, 40, 60, and 80 mg/mL of P. ferulacea plant extracts were prepared, and then, a 0.22 μm syringe microfilter was used for their sterilization. In the next steps, the disks were placed in these solutions for 15 min to be completely soaked in the extract. The prepared microbial suspension equivalent to 1.5 × 10 8 CFU/mL (corresponding to 0.5 McFarland standard) was used to smear a sterile swab during the inoculation step. The plates were then rotated by 60°, and culturing was carried out again to ensure that the medium surface was thoroughly smeared with the respective microorganisms. Then, the disks that had previously been submerged in particular concentrations of the extract became immobile on the medium's surface. Incubation of the culture medium at 37°C was done for 24 h, and the inhibition zone (IZ) (mm) unit was used to express the antimicrobial effect. Ciprofloxacin antibiotic was used as a positive control (Behbahani et al., 2017 ).
2.8.3. Determination of minimum inhibitory/bactericidal concentration by broth microdilution method The MIC measurement was done as follows: preparation of a culture with a number of 1.5 × 10 8 CFU/mL (equivalent to 0.5 McFarland standard) of bacteria, preparation of extract solution in DMSO solution (1 mg/mL), successive dilution of the solution with MHB, adding 125 μL of microbial suspension to each well of the plate (96-well plate) (equivalent to 0.5 McFarland standard), keeping in an incubator at 37°C for 24 h, and adding 25 μL of reagent solution of triphenyltetrazolium chloride (5 mg/mL). In the wells where the microbe had grown, a deep red or amethystine color appeared in less than half an hour. As a result, the lowest concentration in which no microbial growth was observed and no color change was observed was considered MIC. To determine the MBC value, 100 μL of the media from each well (absence of red color in the plate) were cultured on MHA and incubated at 37°C for 24 h. The minimum dilution that caused whole prevention of growth was considered MBC (Behbahani et al., 2017 ).
📊 Figures
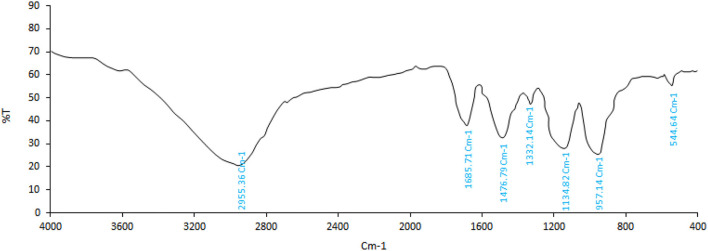
Figure 1
FTIR spectrum of Prangos ferulacea extract .
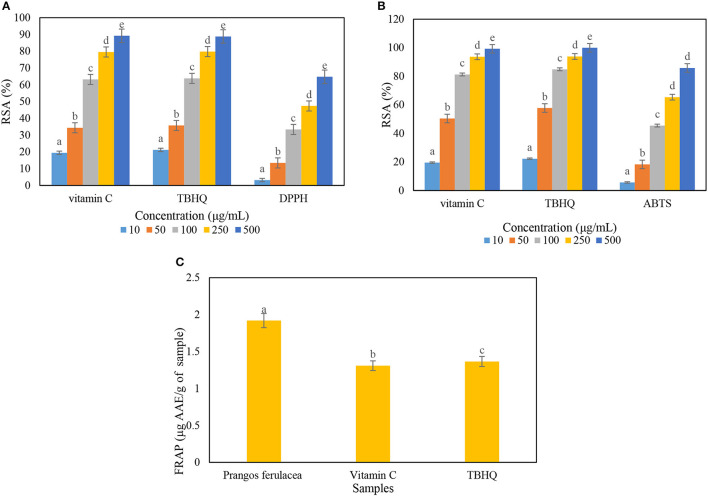
Figure 2
Determination of radical scavenging activity (RSA) percentage of Prangos ferulacea extract on (A) DPPH, (B) ABTS, and (C) FRAP radicals. Letters au2013e in the (A, B) indicate the difference between d...
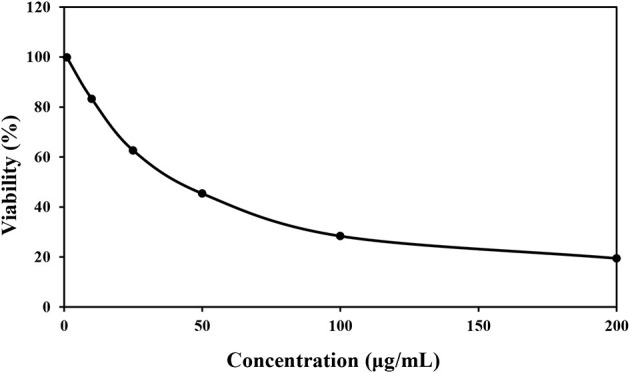
Figure 3
Cytotoxic effect of various concentrations of Prangos ferulacea extract on survival of HT29 cell line.
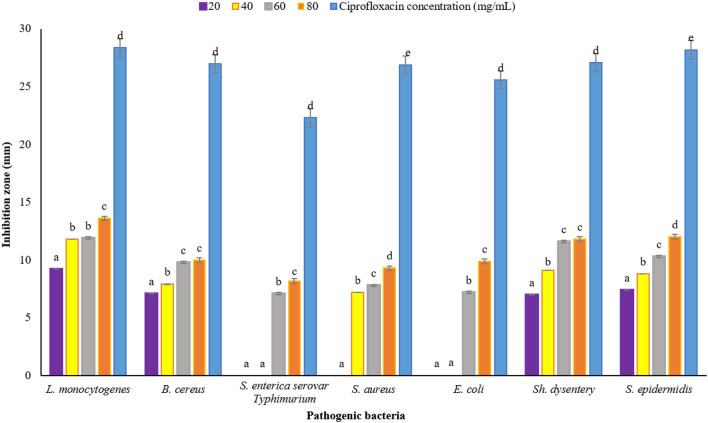
Figure 4
Average IZ (mm) of Prangos ferulacea aqueous extract against pathogenic bacteria, based on DDA method [Different letters (au2013e) in each strain show significant difference at p < 0.05]. Different...
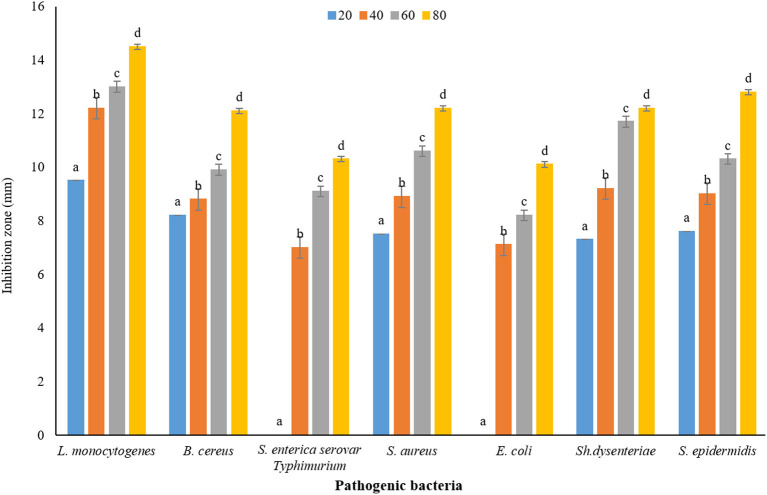
Figure 5
Average IZ (mm) of Prangos ferulacea aqueous extract against pathogenic bacteria, based on WDA method [Different letters (au2013d) in each strain show significant difference at p < 0.05]. Different...
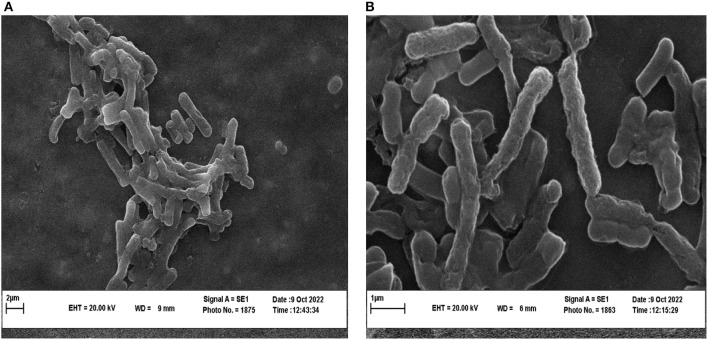
Figure 6
SEM images of L. monocytogenes control (A) and L. monocytogenes treated with extract (B) .
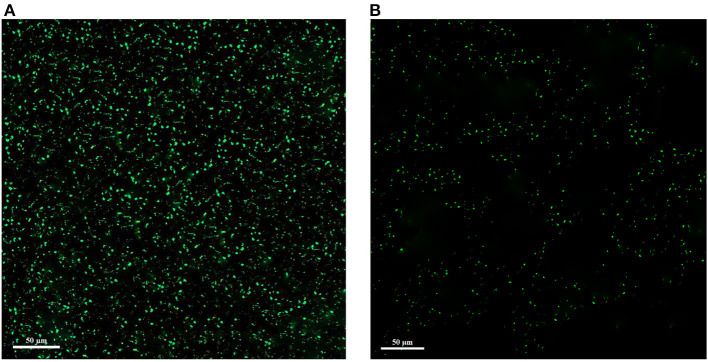
Figure 7
Confocal laser scanning microscopy (CLSM) images of L. monocytogenes control (A) and L. monocytogenes treated with extract (B) .
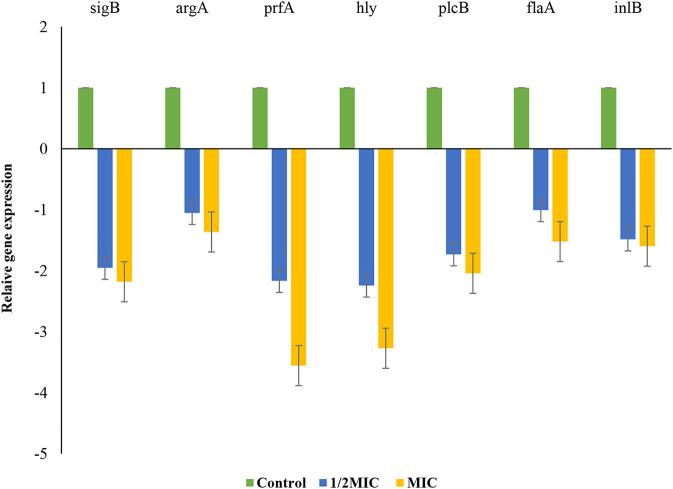
Figure 8
Effects of extract on the transcription of L. monocytogenes biofilm- and virulence-associated genes. Bars represent the standard deviation ( n = 3).
Figure images are served from the NIH/NLM PubMed Central Open Access Subset or Europe PMC; copyright remains with the publishers and authors.
💬 Discussion
0 commentsNo comments yet. Be the first to start a discussion!
Leave a Comment