Abstract
AbstractSoft connective tissues such as skin, tendon or cornea are made of about 90% of extracellular matrix proteins, fibrillar collagens being the major components. Decreased or aberrant collagen synthesis generally results in defective tissue mechanical properties as the classic form of Elhers-Danlos syndrome (cEDS). This connective tissue disorder is caused by mutations in collagen V genes and is mainly characterized by skin hyperextensibility. To investigate the relationship between the microstructure of normal and diseased skins and their macroscopic mechanical properties, we imaged and quantified the microstructure of dermis of ex vivo murine skin biopsies during uniaxial mechanical assay using multiphoton microscopy. We used two genetically-modified mouse lines for collagen V: a mouse model for cEDS harboring a Col5a2 deletion (a.k.a. pN allele) and the transgenic K14-COL5A1 mice which overexpress the human COL5A1 gene in skin. We showed that in normal skin, the collagen fibers continuously align with stretch, generating the observed increase in mechanical stress. Moreover, dermis from both transgenic lines exhibited altered collagen reorganization upon traction, which could be linked to microstructural modifications. These findings show that our multiscale approach provides new crucial information on the biomechanics of dermis that can be extended to all collagen-rich soft tissues.
🔬 Techniques
🧪 Sample Preparation
🧪 Reagent Suppliers
💻 Software Details
🏛️ Research Organizations (ROR)
Affiliated research institutions:
📋 Methods
Mice models Genotypes
Two different mice models were used in this study. The first one is the transgenic K14-COL5A1 mouse line overexpressing the human proα1(V) chain in the epidermis under the control of the K14 promoter 56 that was created and characterized previously 50 . The second one is the Col5a2 pN/ + line (deletion of exon 6 in Col5a2 gene) which is a mouse model for cEDS 4 5 . All animal experiments were performed under animal care procedures and conducted in accordance with the guidelines set by the European Community Council Directives (86/609/EEC). All experimental procedures were approved by the Direction of the Veterinary Service of Rhone Department (DDSV, Lyon, France). 52 mice were used: 9 K14-COL5A1 , 18 Col5a2 pN/ + and 25 WT (obtained from the same litters) (see Supplementary Tables S1–S6 ). Wild-type specimens referred as WT hereafter were obtained from 129sv mice, or by crossing transgenic mice K14-COL5A1 (K14-COL5A1 WT ) or Col5a2 pN/ + heterozygous mice ( Col5a2 + / + ).
Skin samples
Mice were sacrificed at one month by cervical dislocation and the skin of the back was shaved with an electric shaver. Depilatory cream was applied during 15 minutes and hairs were removed with a scraper. The skin of the back was collected and the right foreleg was spotted with black ink to identify the head-tail axis. In order to separate epidermis from dermis and facilitate dermis imaging (preventing light absorption by melanin in the epidermal cells and reducing the skin thickness to image deeper into the dermis), skin was then incubated 30 minutes at room temperature, with 3.8% ammonium thiocyanate 57 . Skin samples were stored in culture medium (Dulbecco’s Modified Eagle’s Medium, Sigma-Aldrich) without phenol red, supplemented with 50 μg/mL penicillin/streptomycin (Sigma) at 6°C and used within five days for the biomechanical experiments. Ear biopsies were systematically collected for genotyping analysis. Genotyping of Col5a2 pN/ + and K14-COL5A1 mice was then performed by PCR as described 4 50 . Measurements and mice genotyping were performed in a double-blind fashion. Histological analysis See Supplementary Material .
Show full methods section
Mice models Genotypes
Two different mice models were used in this study. The first one is the transgenic K14-COL5A1 mouse line overexpressing the human proα1(V) chain in the epidermis under the control of the K14 promoter 56 that was created and characterized previously 50 . The second one is the Col5a2 pN/ + line (deletion of exon 6 in Col5a2 gene) which is a mouse model for cEDS 4 5 . All animal experiments were performed under animal care procedures and conducted in accordance with the guidelines set by the European Community Council Directives (86/609/EEC). All experimental procedures were approved by the Direction of the Veterinary Service of Rhone Department (DDSV, Lyon, France). 52 mice were used: 9 K14-COL5A1 , 18 Col5a2 pN/ + and 25 WT (obtained from the same litters) (see Supplementary Tables S1–S6 ). Wild-type specimens referred as WT hereafter were obtained from 129sv mice, or by crossing transgenic mice K14-COL5A1 (K14-COL5A1 WT ) or Col5a2 pN/ + heterozygous mice ( Col5a2 + / + ).
Skin samples
Mice were sacrificed at one month by cervical dislocation and the skin of the back was shaved with an electric shaver. Depilatory cream was applied during 15 minutes and hairs were removed with a scraper. The skin of the back was collected and the right foreleg was spotted with black ink to identify the head-tail axis. In order to separate epidermis from dermis and facilitate dermis imaging (preventing light absorption by melanin in the epidermal cells and reducing the skin thickness to image deeper into the dermis), skin was then incubated 30 minutes at room temperature, with 3.8% ammonium thiocyanate 57 . Skin samples were stored in culture medium (Dulbecco’s Modified Eagle’s Medium, Sigma-Aldrich) without phenol red, supplemented with 50 μg/mL penicillin/streptomycin (Sigma) at 6°C and used within five days for the biomechanical experiments. Ear biopsies were systematically collected for genotyping analysis. Genotyping of Col5a2 pN/ + and K14-COL5A1 mice was then performed by PCR as described 4 50 . Measurements and mice genotyping were performed in a double-blind fashion. Histological analysis See Supplementary Material .
Combination of multiphoton imaging and mechanical assays
Traction device Mechanical assays were performed using a custom-built uniaxial traction device, inserted in place of the microscope stage. This device is composed of two motors (drl42pa2g-04; Oriental Motor, Tokyo, Japan) and two force sensors (LPM200, 2lb, Futek, USA) on each side of the sample. Displacement of the motors was imposed and the resulting force recorded every second. The traction was symmetric to enable semi-continuous imaging of the same region of interest (ROI) ( Fig. 1a,b ). Samples were cut into a dog-bone shape to ensure homogeneous uniaxial tensile load in the central testing portion ( Supplementary Fig. S2 ). The traction was applied in the head-tail direction, with the papillary dermis up facing the objective lens ( Supplementary Fig. S2 ). A drop of immersion gel (Lacrygel, Europhta) ensured optical contact with the objective lens and prevented skin dehydration during experiments.
Multiphoton microscopy
Multiphoton imaging was performed using a custom-built laser scanning microscope as previously described 12 20 ( Fig. 1a and Supplementary Material ). Signals were collected using 100 kHz pixel rate with 0.5 μm pixel size, 2 μm axial steps and 30 mW typical laser power at focus. Image stacks were typically 480 × 480 × 50 μm 3 (5 minutes recording time). No degradation of the skin samples was usually observed under these conditions.
Mechanical assays under multiphoton microscope
The reference dimensions of each sample (length l 0 , width w 0 and thickness e 0 ) were quantified using a digital caliper (see Supplementary Material for definition of reference position). Typical size of the sample was 20 × 8 × 1 mm 3 , with about 0.1 mm accuracy (see Supplementary Fig. S2 ). The tensile test was then performed at a fixed strain rate, chosen deliberately slow at 10 −4 s −1 (typically 2 μm.s −1 ) to enable monitoring of the same ROI. SHG imaging was not possible during traction because of skin movements during the ≈5 minutes of imaging. The loading path was thus chosen incremental: we stretched the sample by a step of 0.05 stretch ratio, recorded a SHG/2PEF images z-stack while keeping the deformation constant, and carried on with stretching the sample. We checked that we always imaged the same ROI by looking at characteristic patterns from hair follicles. When necessary, we slightly adjusted the lateral and axial positions of the skin sample by moving the whole traction device by means of micrometer stages. We carried on this way until breakage of the sample, usually around a stretch ratio of 1.5, after approximately 3 hours experiment. Mechanical assays without multiphoton imaging See Supplementary Material .
Mechanical data processing
The motor displacement and resulting force were measured continuously during the whole experiments ( Fig. 1c ). The global stretch ratio was obtained as: where l is the length between the jaws and l 0 the reference length. Note that because of the uncertainty in the reference length, the absolute stretch is not precisely defined; nevertheless, the differences in stretch ratio are accurately determined. The nominal stress was obtained as the measured force divided by the initial skin section (w 0 × e 0 ). Also because of the uncertainty in the skin section measurements, the absolute stress is not precisely measured, while the variations of stress are accurately determined. To quantify the mechanical properties of the sample, we used four parameters ( Fig. 5 and Supplementary Tables S5–S6 ). First, the tangent modulus characterized the stiffness of the sample. It corresponds to the slope of the linear part of the stress/stretch curve. The linear part was defined manually for each sample. The fit was carried out on the linear part leaving out the pauses made for imaging, from the beginning of the pause until stress reaches again the value it had before pausing. Second, the length of the heel region corresponds to the non-linear response of the material, classically attributed to the alignment of the collagen fibers. The noise was initially measured for each test at very small stretch ratio (a few percent). The start of the heel region was defined by the first point at which the stress stayed over twice the noise value for at least 10 seconds. We defined the end of the heel region as the point at which the stress got close enough to the linear part regression, i.e . when the difference became inferior to twice the noise. Third, we quantified the resistance to rupture with the failure stretch ratio and ultimate tensile strength. We considered the maximum stress to be the “ultimate tensile strength”, and the stretch ratio for which that stress value was obtained the “failure stretch ratio”.
SHG image processing
SHG images showed fibrillar structures corresponding to collagen, interrupted by round structures with no SHG signal and corresponding to the hair follicles ( Supplementary Fig. S2 ). Three types of information were then obtained: the local stretch in the ROI (~300 × 300 μm 2 ), the skin porosity, and the local organization of fibrillar collagen. To that end, specific image processing was developed using a custom-written MATLAB script (The MathWorks, Natick, USA). Local stretch The centers of all follicles were identified and labelled (see Supplementary Material ) to define a network at each deformation step and calculate the local deformation tensor. To that end, we performed a Delaunay triangulation and calculated for each triangle ( Supplementary Fig. S3 ) the deformation tensor relative to the initial triangle in the non-stretched state. This deformation tensor exhibited three independent components λ xx , λ yy and the sliding angle ω representing respectively the stretch ratios in x and y direction and the shear in the ROI. Thus, at each deformation step, we obtained three maps of deformation ( Supplementary Fig. S3 ). Finally, the averages of each tensor component provided a measure of the local deformation in the ROI, which was compared to the global stretch ratio applied to the skin sample ( Fig. 3a–c and Supplementary Tables S3 and S4 ). Skin porosity Fiber orientation Independently, we extracted fibers orientations from SHG image stacks using morphological filtering by a rotating linear structuring element as previously reported 40 (see Supplementary Material ). To quantify the degree of organization of the tissue, we used three parameters as previously described 55 : (i) the main orientation θ max in the ROI, which corresponds to the maximum of the orientation histogram, (ii) the orientation index (OI) in the main orientation: and (iii) the statistical entropy: where is the probability to find a fiber in the direction θ which is directly given by the orientation histogram.
Statistics
All the skin samples were included in the statistical analysis, unless experimental data were not available for the following reasons: technical problem in the mechanical data acquisition (sensor error…) or in SHG image recording (air bubbles…) or too short linear part in the OI or S variation. Error bars correspond to Standard Error of the Mean. Statistical tests were performed with R (R development core team, R foundation for statistical computing). We verified both the normality of the distribution and the equality of variances using respectively the Shapiro-Wilk test and the Fisher test. Therefore, the significance of the mean differences was determined using sided two-sample t-test. All tests were performed using an alpha level of 5%.
📊 Figures
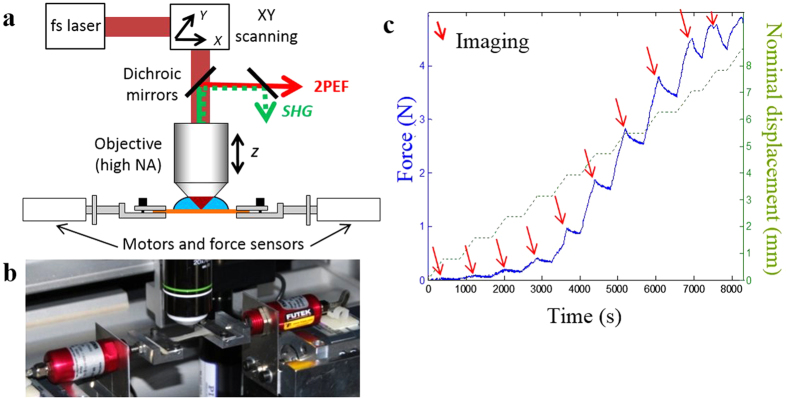
Figure 1
Experimental setup and protocol.
( a ) Scheme of the combined multiphoton microscope and traction device. 2PEF and SHG are detected in the backward direction; ( b ) View of the skin sample maintained under the microscope objective by...
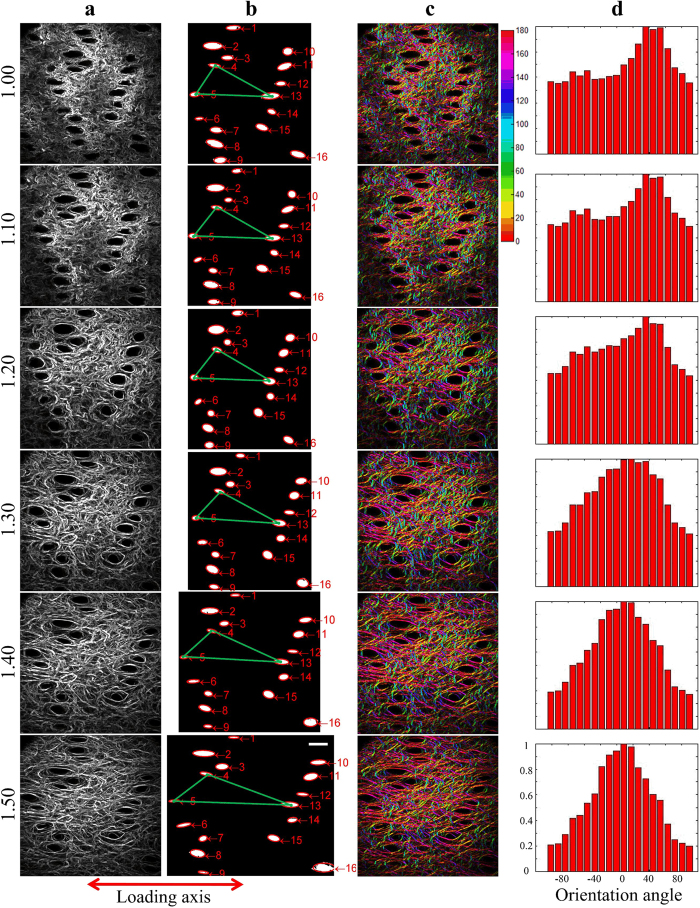
Figure 2
SHG imaging and processing of ex vivo stretched skin sample from K14-COL5A1 mouse.
( a ) Raw SHG image of the dermis as a function of increased skin global deformation (top to bottom). Image size: 480u2009u00d7u2009480u2009u03bcm 2 . ( b ) Hair follicle segmentation revealing skin l...
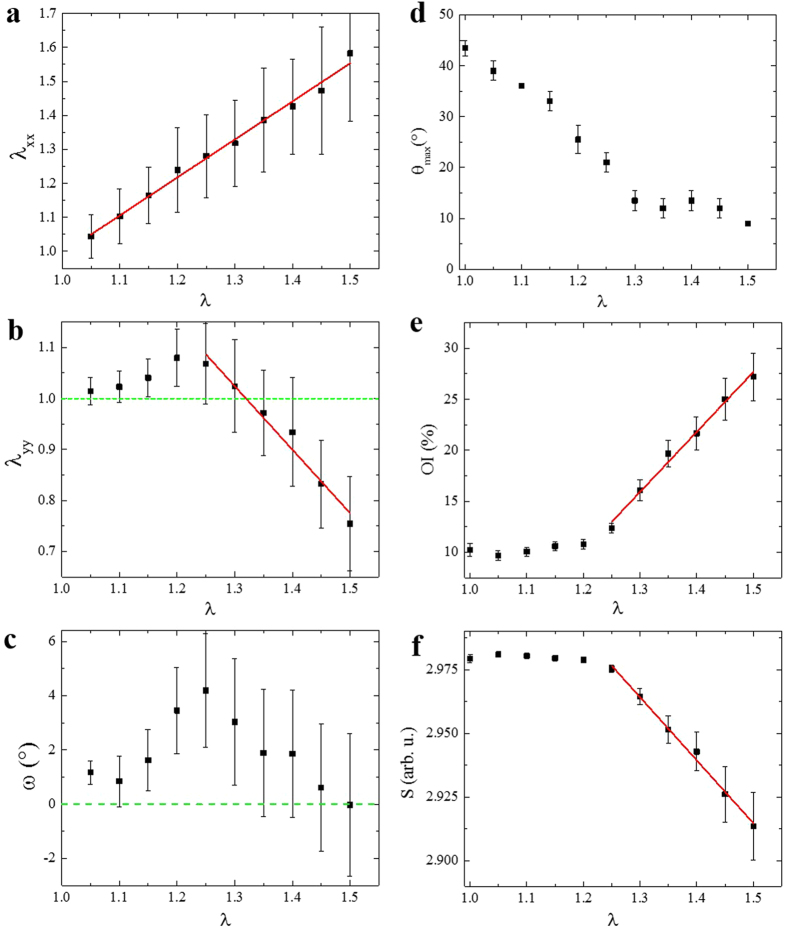
Figure 3
Local deformation and microstructural remodeling of skin sample from K14-COL5A1 mouse (same mouse as Fig. 2 ).
( a ) u03bb xx , ( b ) u03bb yy and ( c ) u03c9 components of the local deformation tensor measured from hair follicle segmentation in the SHG image, x corresponding to the traction direction. Data po...
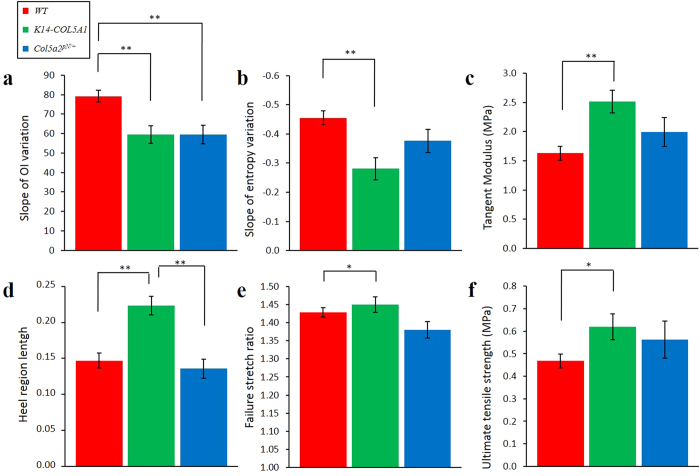
Figure 4
Multiscale biomechanical response of WT , K14-COL5A1 , and Col5a2 pN/ + murine skin.
( a ) Slope of OI variation upon stretching of skin samples from WT , K14-COL5A1 , and Col5a2 pN/ + mice; ( b ) Same with entropy; ( c ) Same with tangent modulus; ( d ) Same with heel region length; ...
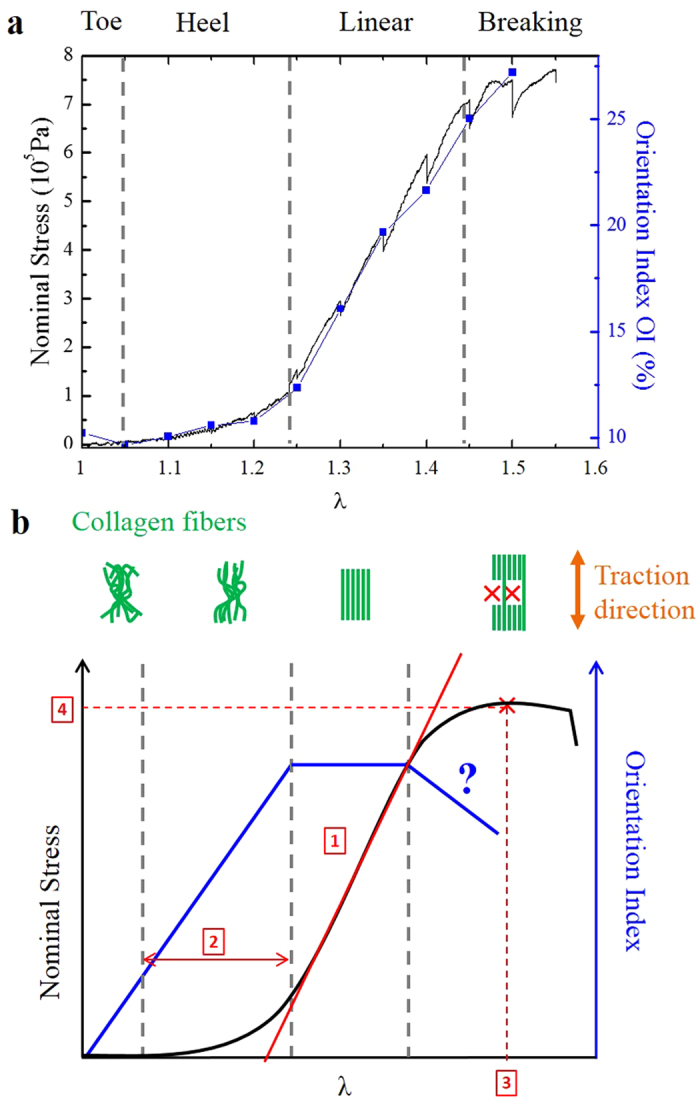
Figure 5
Multiscale biomechanical response of murine skin as compared to model tissue.
Nominal stress (black) and Orientation Index (blue) variations as a function of the global stretch applied to skin sample from the same K14-COL5A1 mouse as in Figs 2 and 3 ( a ) and to a model connect...
Figure images are served from the NIH/NLM PubMed Central Open Access Subset or Europe PMC; copyright remains with the publishers and authors.
💬 Discussion
0 commentsNo comments yet. Be the first to start a discussion!
Leave a Comment