Abstract
Intravital microscopy provides dynamic understanding of multiple cell biological processes, but its limited resolution has so far precluded structural analysis. Because it is difficult to capture rare and transient events, only a few attempts have been made to observe specific developmental and pathological processes in animal models using electron microscopy. The multimodal correlative approach that we propose here combines intravital microscopy, microscopic X-ray computed tomography and three-dimensional electron microscopy. It enables a rapid (c.a. 2 weeks) and accurate (<5 µm) correlation of functional imaging to ultrastructural analysis of single cells in a relevant context. We demonstrate the power of our approach by capturing single tumor cells in the vasculature of the cerebral cortex and in subcutaneous tumors, providing unique insights into metastatic events. Providing a significantly improved throughput, our workflow enables multiple sampling, a prerequisite for making correlative imaging a relevant tool to study cell biology in vivo. Owing to the versatility of this workflow, we envision broad applications in various fields of biological research, such as cancer or developmental biology.
🔬 Techniques
🧬 Organisms
💻 Software
✨ Fluorophores
🧪 Sample Preparation
🔬 Cell Lines
🏭 Microscope Brands
🧪 Reagent Suppliers
🔴 Lasers
📷 Detectors
💻 Software Details
🏛️ Research Organizations (ROR)
Affiliated research institutions:
📋 Methods
Mouse handling
Mounting the cranial window, intracardiac injection of tumor cells and anesthesia To perform intravital imaging of the cerebral cortex, a cranial window was grafted onto an 8–10-week-old immunodeficient female mouse ( Mus musculus ) (NU/NU nude mouse, Charles River Laboratories International, Sulzfeld, Germany), as previously described. After a 3-week healing period, the mouse received a 100 µl solution of cytoplasmic GFP-expressing JIMT1 cells (1×10 7 cells/ml in PBS) through intracardiac injection through the left ventricle. Intravital imaging was performed immediately following injection, and on the second and third day post-injection. For imaging, the mouse was anesthetized by using isoflurane. To visualize the blood vessels, 100 µl of TRITC–dextran (500 kDa, Sigma-Aldrich) was administered to the mouse through injection into the tail vein. The mouse was placed on a custom-made holder (Deutsches Krebsforschungszentrum, Heidelberg, Germany) and remained anesthetized by using an isoflurane gas anesthesia system. All animal experiments were conducted in agreement with the regulations for animal experimentation dictated by the state Baden-Württemberg (Germany), and were approved by the state authorities.
Subcutaneous injection of tumor cells
An immunodeficient adult 8- to 10-week-old mouse (Rj:NMRI-Foxn1nu/Fox1nu, Janvier labs, Saint-Berthevin, France) was injected with the D2A1 Lifeact-YPet cell line, as previously described ( Karreman et al., 2014 ).
Two-photon excitation IVM and NIRB
IVM and NIRB through the cranial window The mouse was mounted on an upright confocal microscope (Zeiss LSM 7, controlled by the software Zen 2012, Carl Zeiss Microscopy GmbH, Jena, Germany) and kept at a steady temperature of 32°C by means of a heating pad. The holder kept the mouse head immobile and allowed analysis of the same imaging area over days by keeping track of the x , y coordinates of the microscope stage. IVM was performed at an excitation wavelength of 850 nm (680–1080 nm Chameleon Ultra II laser, Coherent, Santa Clara, CA) using a ×20 Zeiss W Plan Apochromat N.A. 1 objective (Carl Zeiss Microscopy GmbH). The GFP and TRITC emission wavelengths (510 and 573 nm, respectively) were collected by two hybrid non-descanned detectors. As the perfusion fixation leads to a wash out of the TRITC–dextran, fluorescent lectin from Lycopersicon esculentum (Sigma-Aldrich Chemie GmbH, Munich, Germany) was injected into the mouse tail vein in order to record the 3D organization of the blood vessels after fixation. The mouse was perfusion-fixed through intracardiac injection with 2.5% glutaraldehyde (Electron Microscopy Sciences, Hatfield, PA) and 2% formaldehyde (Electron Microscopy Sciences) in 0.1 M PHEM buffer (comprising 60 mM PIPES, 25 mM HEPES, 10 mM EGTA and 2 mM MgCl, pH adjusted to 6.9). Following fixation, the ROI was imaged again based on the stored stage x , y -coordinates. NIRB was performed with the same laser that had been used for IVM, tuned to a 750 nm wavelength. Above the ROIs, at the level of the brain surface, a 150×150 µm 2 area was scanned in a single focal plane until the NIRB square became clearly visible through emission of autofluorescence in the green channel. Around the ROI, three bigger 300×300 µm 2 NIRB squares were drawn in non-symmetric positions to facilitate orientation and retrieval of the ROI upon dissection ( Fig. 2 ). The brain was removed from the skull and post-fixed by immersion in the same fixative at 4°C overnight. The following day, the fixative was replaced with 0.1 M PHEM buffer, and the brain was stored at 4°C until further processing. IVM and NIRB analysis of subcutaneous tumors in the mouse ear IVM and NIRB were performed as previously described ( Karreman et al., 2014 ) on the anesthetized mouse. After the IVM data acquisition, the mouse was fixed through intracardiac perfusion of 2.5% glutaraldehyde and 2% formaldehyde in 0.1 M PHEM buffer. The ear was dissected and immersed in the same fixative at 4°C overnight. The next day, the ear biopsy was transferred to 0.1 M PHEM buffer and stored at 4°C until further processing.
Show full methods section
Mouse handling
Mounting the cranial window, intracardiac injection of tumor cells and anesthesia To perform intravital imaging of the cerebral cortex, a cranial window was grafted onto an 8–10-week-old immunodeficient female mouse ( Mus musculus ) (NU/NU nude mouse, Charles River Laboratories International, Sulzfeld, Germany), as previously described. After a 3-week healing period, the mouse received a 100 µl solution of cytoplasmic GFP-expressing JIMT1 cells (1×10 7 cells/ml in PBS) through intracardiac injection through the left ventricle. Intravital imaging was performed immediately following injection, and on the second and third day post-injection. For imaging, the mouse was anesthetized by using isoflurane. To visualize the blood vessels, 100 µl of TRITC–dextran (500 kDa, Sigma-Aldrich) was administered to the mouse through injection into the tail vein. The mouse was placed on a custom-made holder (Deutsches Krebsforschungszentrum, Heidelberg, Germany) and remained anesthetized by using an isoflurane gas anesthesia system. All animal experiments were conducted in agreement with the regulations for animal experimentation dictated by the state Baden-Württemberg (Germany), and were approved by the state authorities.
Subcutaneous injection of tumor cells
An immunodeficient adult 8- to 10-week-old mouse (Rj:NMRI-Foxn1nu/Fox1nu, Janvier labs, Saint-Berthevin, France) was injected with the D2A1 Lifeact-YPet cell line, as previously described ( Karreman et al., 2014 ).
Two-photon excitation IVM and NIRB
IVM and NIRB through the cranial window The mouse was mounted on an upright confocal microscope (Zeiss LSM 7, controlled by the software Zen 2012, Carl Zeiss Microscopy GmbH, Jena, Germany) and kept at a steady temperature of 32°C by means of a heating pad. The holder kept the mouse head immobile and allowed analysis of the same imaging area over days by keeping track of the x , y coordinates of the microscope stage. IVM was performed at an excitation wavelength of 850 nm (680–1080 nm Chameleon Ultra II laser, Coherent, Santa Clara, CA) using a ×20 Zeiss W Plan Apochromat N.A. 1 objective (Carl Zeiss Microscopy GmbH). The GFP and TRITC emission wavelengths (510 and 573 nm, respectively) were collected by two hybrid non-descanned detectors. As the perfusion fixation leads to a wash out of the TRITC–dextran, fluorescent lectin from Lycopersicon esculentum (Sigma-Aldrich Chemie GmbH, Munich, Germany) was injected into the mouse tail vein in order to record the 3D organization of the blood vessels after fixation. The mouse was perfusion-fixed through intracardiac injection with 2.5% glutaraldehyde (Electron Microscopy Sciences, Hatfield, PA) and 2% formaldehyde (Electron Microscopy Sciences) in 0.1 M PHEM buffer (comprising 60 mM PIPES, 25 mM HEPES, 10 mM EGTA and 2 mM MgCl, pH adjusted to 6.9). Following fixation, the ROI was imaged again based on the stored stage x , y -coordinates. NIRB was performed with the same laser that had been used for IVM, tuned to a 750 nm wavelength. Above the ROIs, at the level of the brain surface, a 150×150 µm 2 area was scanned in a single focal plane until the NIRB square became clearly visible through emission of autofluorescence in the green channel. Around the ROI, three bigger 300×300 µm 2 NIRB squares were drawn in non-symmetric positions to facilitate orientation and retrieval of the ROI upon dissection ( Fig. 2 ). The brain was removed from the skull and post-fixed by immersion in the same fixative at 4°C overnight. The following day, the fixative was replaced with 0.1 M PHEM buffer, and the brain was stored at 4°C until further processing. IVM and NIRB analysis of subcutaneous tumors in the mouse ear IVM and NIRB were performed as previously described ( Karreman et al., 2014 ) on the anesthetized mouse. After the IVM data acquisition, the mouse was fixed through intracardiac perfusion of 2.5% glutaraldehyde and 2% formaldehyde in 0.1 M PHEM buffer. The ear was dissected and immersed in the same fixative at 4°C overnight. The next day, the ear biopsy was transferred to 0.1 M PHEM buffer and stored at 4°C until further processing.
Processing for electron microscopy
To improve the penetration of the chemicals during processing, small samples (
📊 Figures
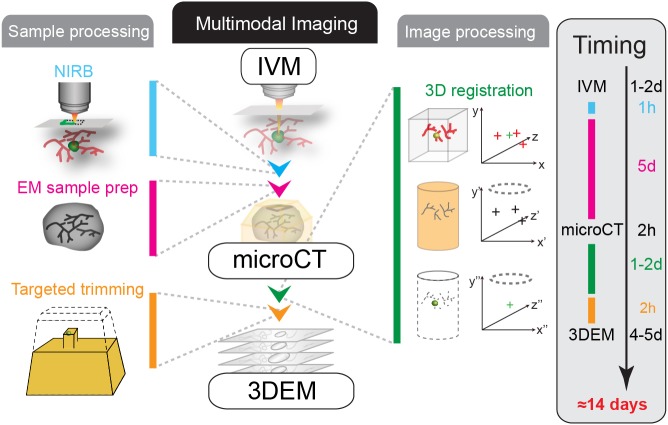
Fig. 1.
Workflow for multimodal correlative microscopy. Multimodal imaging of metastatic events observed in vivo requires specific sample and image processing methods. First, the event of interest is captured...
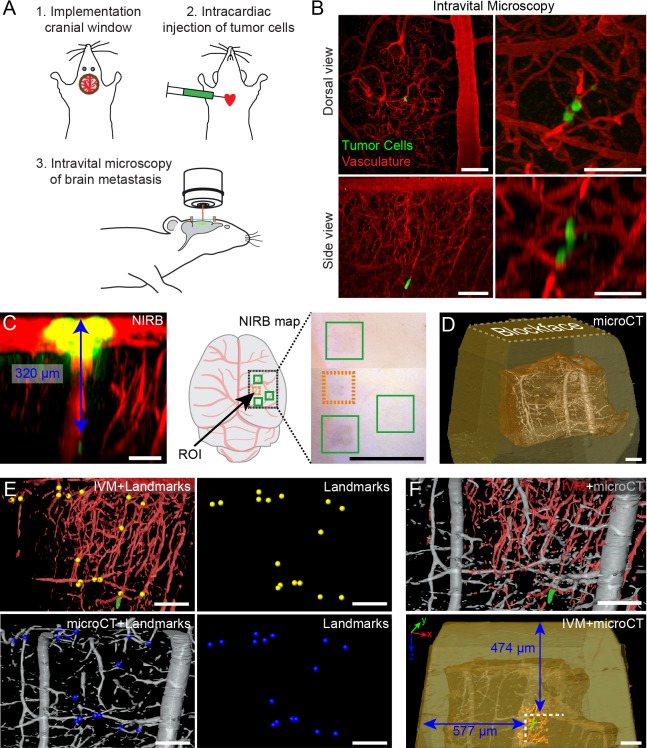
Fig. 2.
IVM and microCT imaging of tumor cells in the mouse brain cortex, followed by 3D registration of both datasets. (A) A chronic cranial window is implanted 3u2005weeks before intravital imaging is perfo...
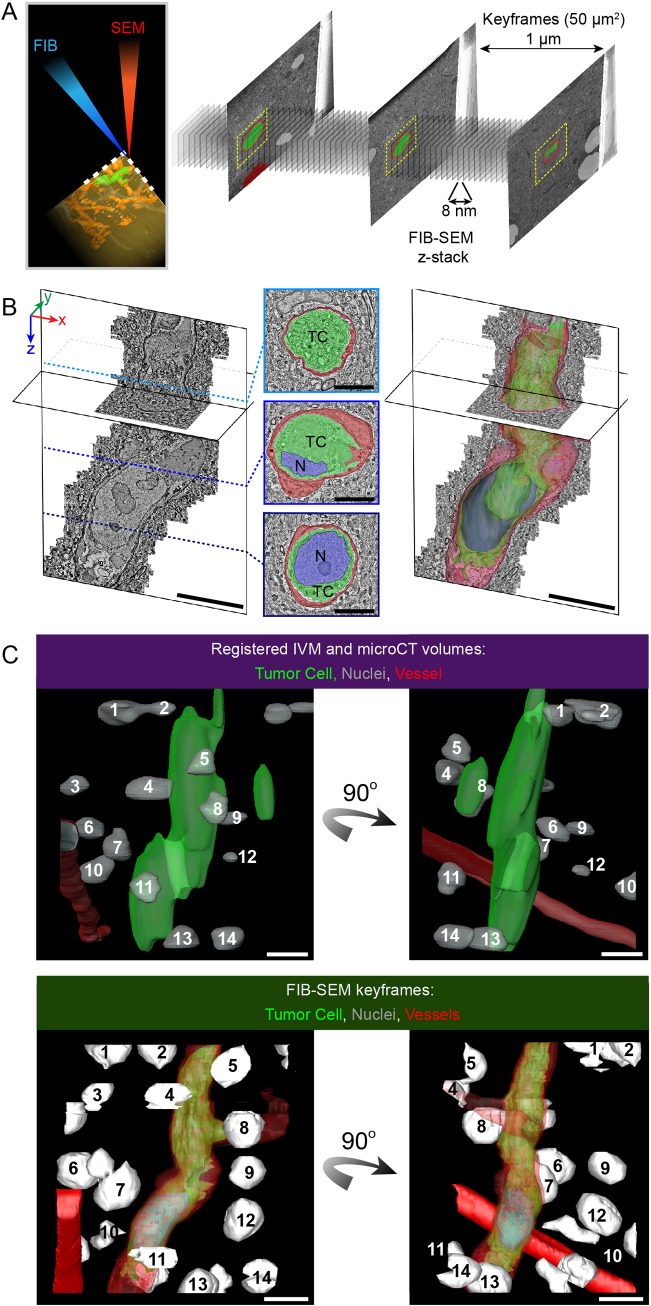
Fig. 3.
FIB-SEM imaging of a tumor cell arrested in the vasculature of the brain. (A) Automated 3DEM. The resin block was precisely trimmed to expose the tumor cell for acquisition of data using FIB-SEM. Duri...
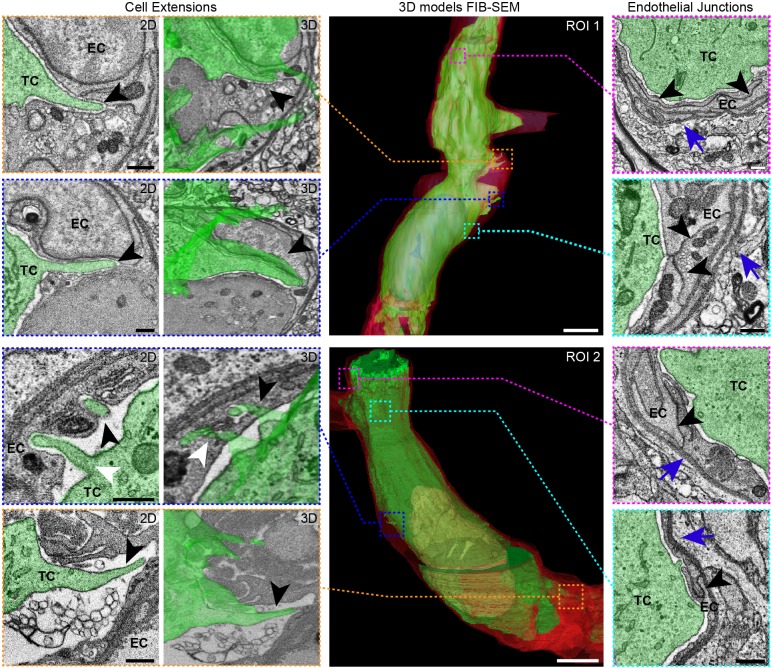
Fig. 4.
3DEM imaging of an arrested tumor cell in brain capillaries. 3DEM analysis reveals tumor cell (TC) extensions pointing towards and into the endothelial cell layer (EC) (first and second columns from t...
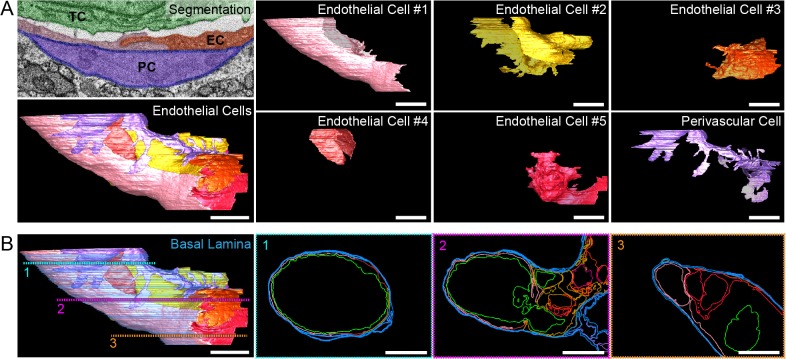
Fig. 5.
3DEM imaging allows dissection of the complex structural organization of the vessel containing an arrested tumor cell. (A) Each individual cell lining the tumor-cell-containing vessel, as well as the ...
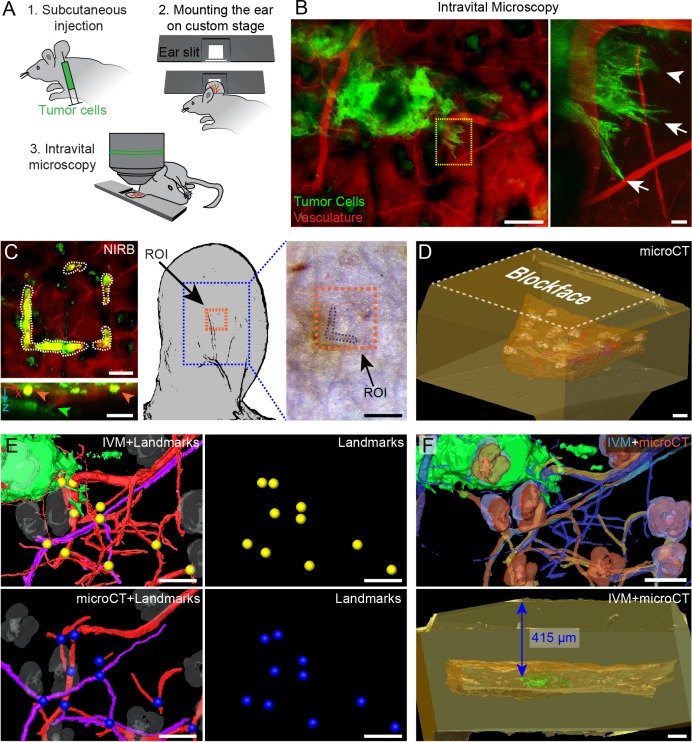
Fig. 6.
IVM imaging of tumor cell protrusions of subcutaneous xenografts. (A) D2A1 LifeAct-YPet-expressing cells were injected subcutaneously into the mouse ear. After 2u2005weeks of tumor growth, the mouse w...
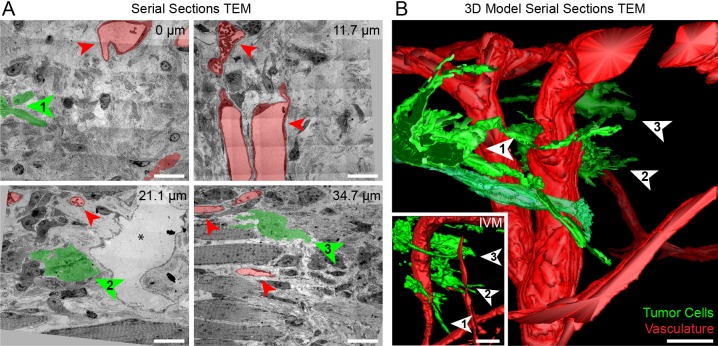
Fig. 7.
Serial TEM imaging and correlation of tumor cell protrusions in skin tissue. (A) Large fields of view comprising stitched TEM micrographs from 130-nm thick sections of the volume of interest shown in ...
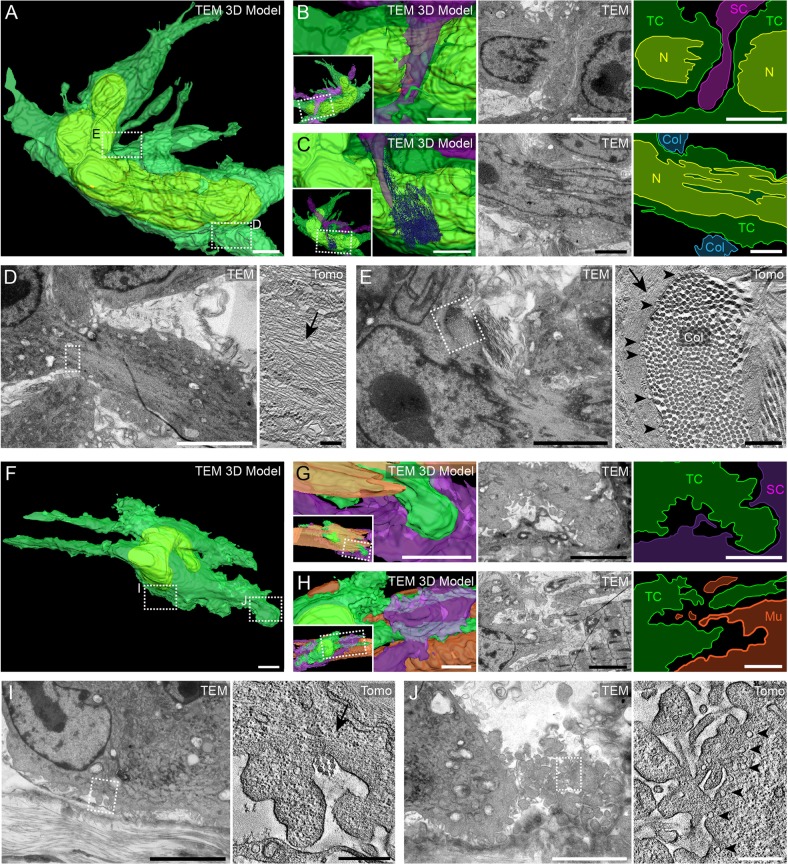
Fig. 8.
Serial TEM and electron tomography analysis of tumor cell protrusions from subcutaneous xenografts. (A) 3D model obtained from serial TEM imaging of the cell body of the tumor cell 1 highlighted in Fi...
Figure images are served from the NIH/NLM PubMed Central Open Access Subset or Europe PMC; copyright remains with the publishers and authors.
💬 Discussion
0 commentsNo comments yet. Be the first to start a discussion!
Leave a Comment