Abstract
Aggregation of the peptide hormone amylin into amyloid deposits is a pathological hallmark of type-2 diabetes (T2D). While no causal link between T2D and amyloid has been established, the S20G mutation in amylin is associated with early-onset T2D. Here we report cryo-EM structures of amyloid fibrils of wild-type human amylin and its S20G variant. The wild-type fibril structure, solved to 3.6-Å resolution, contains two protofilaments, each built from S-shaped subunits. S20G fibrils, by contrast, contain two major polymorphs. Their structures, solved at 3.9-Å and 4.0-Å resolution, respectively, share a common two-protofilament core that is distinct from the wild-type structure. Remarkably, one polymorph contains a third subunit with another, distinct, cross-β conformation. The presence of two different backbone conformations within the same fibril may explain the increased aggregation propensity of S20G, and illustrates a potential structural basis for surface-templated fibril assembly.
🔬 Techniques
🧬 Organisms
🧪 Sample Preparation
🏭 Microscope Brands
🧪 Reagent Suppliers
💻 Software Details
💾 Data Repositories
🏛️ Research Organizations (ROR)
Affiliated research institutions:
📋 Methods
Preparation of wild-type and S20G amylin peptide
Wild-type and S20G amylin were synthesized using a Liberty Blue automated microwave peptide synthesizer (CEM Microwave Technology) on a 0.1-mmol scale, as reported previously 64 , 65 . We used 9-fluorenylmethyloxycarbonyl (Fmoc)-protected amino acids and PAL-NovaSyn TG resin (Merck), allowing the generation of amylin with an amidated C terminus. Three pseudo proline dipeptides (Fmoc-Ala-Thr(psiMe,MePro)-OH, Fmoc-Ser(tBu)-Ser(psiMe,MePro)-OH and Fmoc-Leu-Ser(psiMe,Mepro)-OH, Merck) were used for the insertions of Ala-8 and Thr-9, Ser-19 and Ser-20, and Leu-27 and Ser-28. All residues and the three pseudo proline dipeptides were double coupled. The peptides were cleaved from the resin in a cleavage cocktail of trifluoroacetic acid (TFA, 9.4 ml), 3,6-dioxa-1,8-octanedithiol (250 μl), H 2 O (250 μl) and triisopropylsilane (100 μl). The mixture was stirred at room temperature for 3.5 h and then concentrated under a nitrogen stream. Subsequently the crude peptide was precipitated in cold diethyl ether, followed by three washes with the same solvent. The peptide was then dissolved in a 50% acetonitrile aqueous solution containing 0.1% TFA, and lyophilized. The peptide was then dissolved in 50% DMSO aqueous solution to promote formation of the internal disulfide bond between Cys-2 and Cys-7. The oxidized peptides were then purified by reverse-phase HPLC using a Kinetex EVO C18 column (Phenomenex). The buffers used in the HPLC purification were acetonitrile with 0.1% formic acid and H 2 O with 0.1% formic acid. The masses of the purified peptides were confirmed by ESI–MS as 3,902.9 for wild-type amylin (expected, 3,903.3) and 3,872.9 for amylin-S20G (expected, 3,873.3). The purity of the two peptides was assessed by analytical HPLC and was >95%. After purification, peptides were again lyophilized and stored at −20 °C until use. Fibril growth Lyophilized peptides were monomerized by dissolution into hexafluoroisopropanol (Sigma) at a final concentration of 1 mg ml –1 . Samples were incubated for 15 min at room temperature with occasional agitation to allow complete monomerization. Monomerized samples where then aliquoted in 1.5-ml glass vials containing 50 μg of peptide per vial. The solvent was evaporated to dryness by gently blowing a stream of nitrogen gas while swirling the vial around to generate a film of peptide around the walls of the vial. Vials containing dried peptide films were stored at −20 °C until use. At the point of use, peptide vials were allowed to reach room temperature before opening and then an aliquot of ice-cold aggregation buffer (freshly prepared 20 mM ammonium acetate, pH 6.8 filtrated through a 0.2-μm polyvinylidene difluoride filter immediately before use) was added to obtain stock concentrations no higher than 100 μM of peptide. The concentration of the stock was estimated by absorbance at 280 nm using the calculated molar extinction coefficient of 1,615 M −1 cm −1 . The concentration of the stocks was adjusted to 30 μM by addition of aggregation buffer, and samples were incubated quiescently at room temperature to allow the formation of amyloid fibrils as confirmed by negative staining transmission electron microscopy and thioflavin T fluorescence. Typically, amyloid fibrils were observed within 24–48 h. After the observation of fibrils, samples where maintained at 4 °C until their use for cryo-EM sample preparation and were used within 2 weeks of that.
Show full methods section
Preparation of wild-type and S20G amylin peptide
Wild-type and S20G amylin were synthesized using a Liberty Blue automated microwave peptide synthesizer (CEM Microwave Technology) on a 0.1-mmol scale, as reported previously 64 , 65 . We used 9-fluorenylmethyloxycarbonyl (Fmoc)-protected amino acids and PAL-NovaSyn TG resin (Merck), allowing the generation of amylin with an amidated C terminus. Three pseudo proline dipeptides (Fmoc-Ala-Thr(psiMe,MePro)-OH, Fmoc-Ser(tBu)-Ser(psiMe,MePro)-OH and Fmoc-Leu-Ser(psiMe,Mepro)-OH, Merck) were used for the insertions of Ala-8 and Thr-9, Ser-19 and Ser-20, and Leu-27 and Ser-28. All residues and the three pseudo proline dipeptides were double coupled. The peptides were cleaved from the resin in a cleavage cocktail of trifluoroacetic acid (TFA, 9.4 ml), 3,6-dioxa-1,8-octanedithiol (250 μl), H 2 O (250 μl) and triisopropylsilane (100 μl). The mixture was stirred at room temperature for 3.5 h and then concentrated under a nitrogen stream. Subsequently the crude peptide was precipitated in cold diethyl ether, followed by three washes with the same solvent. The peptide was then dissolved in a 50% acetonitrile aqueous solution containing 0.1% TFA, and lyophilized. The peptide was then dissolved in 50% DMSO aqueous solution to promote formation of the internal disulfide bond between Cys-2 and Cys-7. The oxidized peptides were then purified by reverse-phase HPLC using a Kinetex EVO C18 column (Phenomenex). The buffers used in the HPLC purification were acetonitrile with 0.1% formic acid and H 2 O with 0.1% formic acid. The masses of the purified peptides were confirmed by ESI–MS as 3,902.9 for wild-type amylin (expected, 3,903.3) and 3,872.9 for amylin-S20G (expected, 3,873.3). The purity of the two peptides was assessed by analytical HPLC and was >95%. After purification, peptides were again lyophilized and stored at −20 °C until use. Fibril growth Lyophilized peptides were monomerized by dissolution into hexafluoroisopropanol (Sigma) at a final concentration of 1 mg ml –1 . Samples were incubated for 15 min at room temperature with occasional agitation to allow complete monomerization. Monomerized samples where then aliquoted in 1.5-ml glass vials containing 50 μg of peptide per vial. The solvent was evaporated to dryness by gently blowing a stream of nitrogen gas while swirling the vial around to generate a film of peptide around the walls of the vial. Vials containing dried peptide films were stored at −20 °C until use. At the point of use, peptide vials were allowed to reach room temperature before opening and then an aliquot of ice-cold aggregation buffer (freshly prepared 20 mM ammonium acetate, pH 6.8 filtrated through a 0.2-μm polyvinylidene difluoride filter immediately before use) was added to obtain stock concentrations no higher than 100 μM of peptide. The concentration of the stock was estimated by absorbance at 280 nm using the calculated molar extinction coefficient of 1,615 M −1 cm −1 . The concentration of the stocks was adjusted to 30 μM by addition of aggregation buffer, and samples were incubated quiescently at room temperature to allow the formation of amyloid fibrils as confirmed by negative staining transmission electron microscopy and thioflavin T fluorescence. Typically, amyloid fibrils were observed within 24–48 h. After the observation of fibrils, samples where maintained at 4 °C until their use for cryo-EM sample preparation and were used within 2 weeks of that.
AFM sample preparation and imaging
The handedness of fibrils was unambiguously determined using AFM. A sample volume of 40 μl of either wild-type (at 30 μM) or S20G (at 15 μM) amylin fibrils was deposited onto freshly cleaved mica and allowed to incubate for 4 min. The mica surface was then rinsed with buffer (50 mM NaPO 4 , 300 mM KCl, pH 7.5) via fluid exchange, maintaining the fibrils in a liquid environment. AFM observations were performed in tapping mode using a Dimension FastScan Bio with FastScan-D-SS probes (Bruker) in the same buffer. The force applied by the tip on the sample was minimized by maximizing the set point whilst maintaining tracking of the surface.
Cryo-EM imaging
Amylin fibrils (either wild type or S20G) at a concentration of 30 μM monomer equivalent were diluted 1:1 with 300 mM NaCl, to achieve a final concentration of 15 µM monomer equivalent of the peptides. A 300-mesh copper EM grid with lacey carbon film (Agar Scientific) was cleaned in a Tergeo-EM plasma cleaner (Pie Scientific) for 1 min at power 40 mA. Four microlitres of the sample was applied to the grid, which was then blotted with Whatman no. 40 filter paper and plunge-frozen in liquid ethane using a Vitrobot mark IV (Thermo Fisher). Electron microscopy images were collected using a Titan Krios (Thermo Fisher) electron microscope operating at 300 keV, and recorded on an energy-filtered K2 direct detector (Gatan), with a pixel size of 1.06 Å per pixel. For the wild-type sample, a set of 800 micrographs was recorded with a defocus range between −1.3 and −2.9 μm every 0.2 μm, and total electron doses of 50.7 e − /Å 2 . The dose was fractionated into 50 frames for a per-frame dose of 1.01 e − /Å 2 . For the S20G sample a set of 684 micrographs was recorded with a defocus range between −0.6 and −2.8 μm every 0.2 μm, and total electron doses of 54.7 e − /Å 2 . The dose was fractionated into 52 frames for a per-frame dose of 1.05 e − /Å 2 . Frames 3–50 of wild-type micrograph movies, and 3–52 of S20G micrograph movies, were motion corrected, dose weighted and merged using motioncor2 (ref. 66 ). The contrast transfer function (CTF) for each micrograph was determined using gCTF 67 on motion-corrected, but non-dose-weighted, micrographs.
Helical reconstruction
Helical reconstruction 68 was performed using Relion 3.0 (ref. 69 ) except for initial model generation, which was performed in Relion 3.1 (ref. 70 ). The data were assessed visually, and start and end points for fibrils that appeared to be composed of a single set of protofilaments were interactively selected by hand. For the S20G dataset, the fibrils were segmented into 300 × 300 pixel boxes (corresponding to 319.5 × 319.5 Å), with an overlap of 90% (an offset of 30 pixels, 31.95 Å). For the wild-type dataset the fibrils were segmented into 200 × 200 pixel boxes (corresponding to 213.0 × 213.0 Å), with an overlap of 90% (an offset of 20 pixels, 21.3 Å). For the wild-type dataset the initial 117,316 extracted segments were subjected to multiple rounds of 2D classification; classes showing an obvious ~4.8-Å repeating feature were taken forward into the next classification. The 84,597 segments ultimately taken forward from this iterative 2D classification process were then subjected to iterative rounds of 3D classification using a de novo starting model generated with Relion 3.1. The same procedure was followed for the S20G dataset, where 64,274 segments were extracted initially and, after multiple rounds of 2D classification where only those classes showing an obvious ~4.8-Å repeating feature were taken forward into the next classification iteration, this yielded a final set of 25,137 segments that were taken forward to iterative rounds of 3D classification using a de novo starting model generated with Relion 3.1. The initial 3D classification rounds were performed with searching of helical rise and twist around values estimated from crossover lengths measured from 2D class averages. In these classification steps the wild-type and S20G datasets were separated into three classes each. After the first round of classification, the initial model was updated to that showing the best separation of density stacks along the fibril axis. For the wild type, after several rounds of update of the initial model a final 3D classification was performed with fixed values of 178.23° helical twist and 2.43-Å helical rise. For S20G the initial 3D classification with a search of helical rise and twist yielded two distinct polymorphs that contained either two or three protofilaments. We followed the 3D classification strategy employed for the wild-type dataset using the three-protofilament model obtained as the initial model for the next 3D classification round. This allowed us to separate particles contributing to the three-protofilament structure from those contributing to the two-protofilament structure. The class of particles belonging to the three-protofilament structure was further 3D classified with searches of helical symmetry. These symmetry searches converged to values for a rise and twist of 4.81 Å and 358.1°, respectively. The class showing the best separation of stacks of density along the helical axis was used as the initial model for a new 3D classification round, with fixed helical parameters found in the precedent step. The resulting model was employed as the initial model for 3D classification against the original mixed dataset, into two- and three-protofilament and ambiguous classes. This step generated a class containing 6,447 for the 3PF reconstruction. Particles contributing to the 2PF structure were 3D classified using the 2PF map as starting model. The symmetry searches converged to values for rise and twist of 2.41 Å and 179.05°, respectively. A final 3D classification with the resulting model and fixed helical parameters against the 2PF particles resulted in a class containing 11,901 particles. Each of the resulting 3D classes was subjected to 3D refinement using their respective 3D maps as reference maps, a t- value of 50 and fixed helical parameters. After refinement, all models were masked (wild type, 15% of Z length; S20G, 10% of Z length) and postprocessed in Relion. Fourier shell correlation plots for wild type, S20G 2PF and S20G 3PF are shown in Supplementary Fig. 3 .
Model building and refinement
Atomic models of single layers for each of the fibril reconstruction maps were built de novo in COOT 71 . The initial model of S20G 2PF was used to guide the model building of 3PF. For each of the models, six copies of the single-layer models were fit into the respective cryo-EM maps using Chimera 72 to preserve nearest neighbor interactions during subsequent refinement steps. The stack of six layers was then subjected to multiple rounds of real-space refinement in Phenix 73 , alternated with real-space refinement in COOT. The refinements in Phenix were restrained by defining noncrystallographic symmetry restraint groups for each of the protofilaments. Side chain clashes were detected using MOLPROBITY 74 and corrected by iterative cycles of real-space refinement in both COOT and Phenix. All refinements were performed using information relating to 3.6-Å resolution for wild type, 3.9-Å resolution for S20G 2PF and 4.0-Å resolution for S20G 3PF. Reporting Summary Further information on experimental design is available in the Nature Research Reporting Summary linked to this article.
📊 Figures

Extended Data Fig. 1
Negative-stain TEM and AFM characterization of wild-type and S20G amylin fibrils.
a , Wild-type (WT) amylin fibrils as observed by negative-stain TeM. The proportion of all fibrils in the dominant polymorph determined here (~80%) are indicated by the pie chart in row ( a ). b , As ...

Extended Data Fig. 2
2D-classification and class average details of wild-type amylin data-set.
a , 2D classification of the initial cryoeM data-set. Shown are selected classes ranked on class distribution from higher to lower (left to right and then top to bottom). b , representative 2D class s...

Extended Data Fig. 3
Inter-protofilament interactions that stabilised the wild-type amylin fibril and secondary structure assignments.
a , Monomer u201ciu201d in red, and apposing monomer u201cju201d in brown have 10u00ba tilt angle respect to the main fibril axis, which generates an effective 20u00ba tilt between monomers in opposin...

Extended Data Fig. 4
2D-classification and class average details of the S20G amylin data-set.
a , 2D classification of the initial cryo-EM data-set. Shown are selected classes ranked on class distribution (from left to right and then top to bottom). b , Representative 2D class showing a cross-...

Extended Data Fig. 5
Inter-protofilament interactions in the 2PF and 3PF polymorphs of S20G amylin.
a , Monomer u201ciu201d in red, and apposing monomer u201cj-1u201d in brown have 1u00ba tilt angle respect to the main fibril axis, which generates an effective 2u00ba tilt between monomers in opposin...

Extended Data Fig. 6
Monomer superposition from amyloid fibrils form by wild-type and S20G amylin, and dependency of fibril stability on number of molecular layers for amylin fibrils.
a , Global superposition of the Cu03b1 trace of the wild-type fibril monomer (blue) on the Cu03b1 trace of S20G 2PF fibril monomer (red). b , The same structures superposed in the segment 31 NVGSNT 36...

Extended Data Fig. 7
Comparison of recently published structures of wild-type and sumoylated amylin fibrils.
Structural superposition of a molecular layer of a , S-shaped monomers of wild-type amylin from a right-handed fibril (blue, PDB code 6Y1A 39 ) onto S-shaped monomers of wild-type amylin determined in...

Extended Data Fig. 8
Previously proposed structure and model for wild-type amylin, and superposition of X-ray structures from fragments onto cryo-EM structure of wild-type amylin.
a , Structural model for the striated ribbon polymorph studied by Luca and co-workers 43 where two amylin monomers are represented as ribbons coloured from N-terminal yellow to C-terminal blue. b , St...
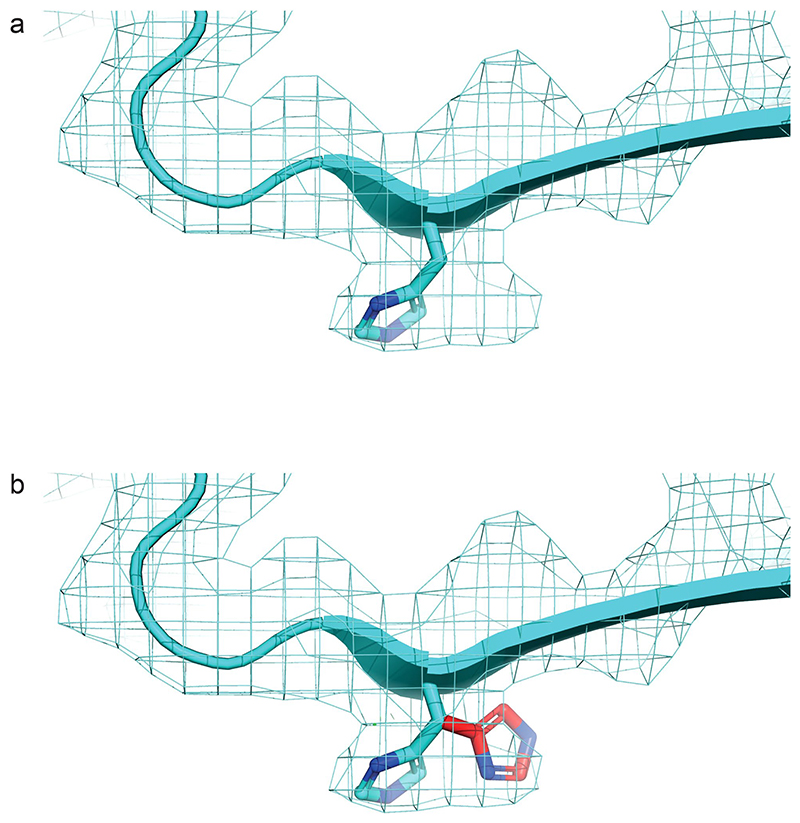
Extended Data Fig. 9
The electron potential map around His18 in the wild-type amylin fibril structure is difficult to interpret.
The density could accommodate two distinct His rotamers (shown in panels a and b ). It is possible that both rotomers are present in the structure, or that the dataset contains two polymorphs that dif...

Extended Data Fig. 10
The S-shaped fold of wild-type amylin is similar to the fold of A u03b2 42 fibril fold.
a , Sequence alignment of human amylin and Au03b2 42 . The highest sequence similarity region (56%) is highlighted by a black box. The aggregation prone region with highest similarity between amylin (...

Fig. 1
Morphology of amylin fibrils.
a , b , raw cryo-eM images of wild-type ( a ) and S20G ( b ) amylin fibrils. Overt crossover lengths of 25 nm (wild type) and 50 nm (S20G) are indicated by arrows. All fibrils have a left-handed twist...
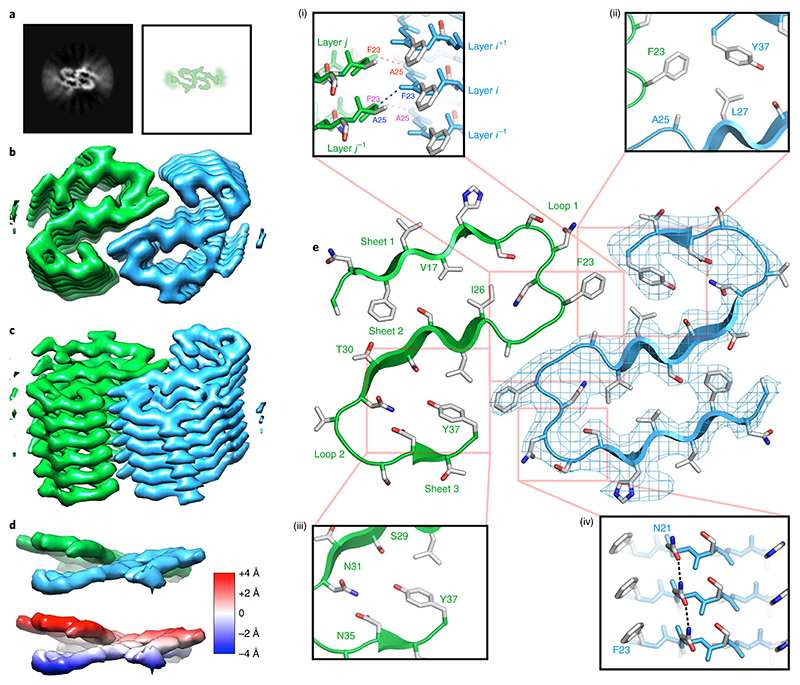
Fig. 2
Structure of protofilaments and near-atomic resolution model for the wild-type amylin fibril.
a , Cross-sections through unsharpened 3D reconstructions for the wild type and its schematic representation, showing an ordered core composed of two protofilaments surrounded by diffuse density for m...

Fig. 3
Conformation of 2PF fibrils and details of its molecular structure.
a , Cross-sections through unsharpened 3D reconstructions for S20G 2PF fibrils and their schematic representation, showing two protofilaments in an ordered core surrounded by diffuse density for more ...

Fig. 4
Conformation of S20G 3PF fibrils and details of their molecular structure.
a , Cross-sections through unsharpened 3D reconstructions for S20G 3PF fibrils and their schematic representation, showing three protofilaments in an ordered core surrounded by diffuse density for mor...

Fig. 5
Schematic views of backbone fold and interprotofilament interactions in the structures of wild-type, S20G 2PF and S20G 3PF amylin fibrils.
a u2013 c , The amylin backbone is represented as a tube and colored like a rainbow from the N-terminal (N) to the C-terminal (C) residues observed in the structure (residues 14u201337) for wild-type ...
Figure images are served from the NIH/NLM PubMed Central Open Access Subset or Europe PMC; copyright remains with the publishers and authors.
💬 Discussion
0 commentsNo comments yet. Be the first to start a discussion!
Leave a Comment