Abstract
The future of nanomedicines in oncology requires leveraging more than just the passive drug accumulation in tumors through the enhanced permeability and retention effect. Promising results combining mild hyperthermia (HT) with lyso-thermosensitive liposomal doxorubicin (LTSL-DOX) has led to improved drug delivery and potent antitumor effects in pre-clinical studies. The ultimate patient benefit from these treatments can only be realized when robust methods of HT can be achieved clinically. One of the most promising methods of non-invasive HT is the use of focused ultrasound (FUS) with MRI thermometry for anatomical targeting and feedback. MRI-guided focused ultrasound (MRgFUS) is limited by respiratory motion and large blood vessel cooling. In order to translate exciting pre-clinical results to the clinic, novel heating approaches capable of overcoming the limitations on clinical MRgFUS+HT must be tested and evaluated on their ability to locally release drug from LTSL-DOX. Methods: In this work, a new system is described to integrate focused ultrasound (FUS) into a two-photon microscopy (2PM) setting to image the release of drug from LTSL-DOX in real-time during FUS+HT in vivo. A candidate scheme for overcoming the limitations of respiratory motion and large blood vessel cooling during MRgFUS+HT involves applying FUS+HT to 42°C in short ~30s bursts. The spatiotemporal drug release pattern from LTSL-DOX as a result is quantified using 2PM and compared against continuous (3.5min and 20min at 42°C) FUS+HT schemes and unheated controls. Results: It was observed for the first time in vivo that these short duration temperature elevations could produce substantial drug release from LTSL-DOX. Ten 30s bursts of FUS+HT was able to achieve almost half of the interstitial drug concentration as 20min of continuous FUS+HT. There was no significant difference between the intravascular area under the concentration-time curve for ten 30s bursts of FUS+HT and 3.5min of continuous FUS+HT. Conclusion: We have successfully combined 2PM with FUS+HT for imaging the release of DOX from LTSL-DOX in vivo in real-time, which will permit the investigation of FUS+HT heating schemes to improve drug delivery from LTSL-DOX. We have evaluated the ability to release DOX in short 30s FUS+HT bursts to 42°C as a method to overcome limitations on clinical MRgFUS+HT and have found that such exposures are capable of releasing measurable amounts of drug. Such an exposure has the potential to overcome limitations that hamper conventional MRgFUS+HT treatments in targets that are associated with substantial tissue motion.
🔬 Techniques
🔭 Microscopes
✨ Fluorophores
🧪 Sample Preparation
🏭 Microscope Brands
🧪 Reagent Suppliers
🔎 Objectives
💻 Software Details
🏛️ Research Organizations (ROR)
Affiliated research institutions:
📋 Methods
Tumor cell line and cell culture Human FaDu squamous cell carcinoma cells expressing green fluorescent protein (FaDu-GFP, AntiCancer Inc., San Diego, CA) were cultured at 37°C in 5% CO 2 /95% air. For in vitro cultures, cells were propagated in RPMI 1640 with L-glutamine (MultiCell), supplemented with 10% FBS, penicillin (100 U/mL) and streptomycin (100 µg/mL). Cells were trypsinized before reaching confluency and harvested.
Animal Preparation and in vivo Tumor Model Six-eight week old
BALB/c nu/nu mice were purchased from Charles River, sterile rodent food and water were given ad libitum . All animal procedures were approved by the Animal Care Committee at Sunnybrook Research Institute, Toronto, Canada. FaDu-GFP cells were routinely cultured as described above. Tumor cells (2x10 6 ) suspended in 30µL of media were injected in the fascia of a dorsal skin flap placed in a window chamber in mice 48 . Following tumor inoculation mice carrying window chambers were housed individually. Imaging studies were performed 9-12 days after inoculation when tumors were visually perfused. On the imaging day, mice with tumor-bearing DSWCs were anesthetized with isoflurane. The tail veins were cannulated for the injection of fluorescent dextran (2MDa FITC, 33mg/kg, dissolved in PBS; ThermoFisher Scientific) and LTSL-DOX (ThermoDox®, 10mg/kg of doxorubicin, in equal parts of 5% dextrose solution). The doxorubicin dose prescribed here was chosen to correspond to a human equivalent dose of approximately 30mg/m 2 49 . This is similar to that used in rats (30mg/m 2 50 ), rabbits (30mg/m 2 51 ) and on the low end of what has been administered in clinical trials (20-60mg/m 2 52 ) with ThermoDox®. The animals were placed on a heating pad atop a removable microscope stage which used feedback from a rectal thermistor to maintain the animal core body temperature at 37°C during the experiment (TC-1000, CWE Inc., Ardmore, PA). The glass coverslip of the DSWC was then removed to allow the insertion of two bare-junction type-T thermocouples into the DSWC adjacent to the tumor to provide temperature feedback. The thermocouples were fabricated by soldering the tips of a copper and a constantan wire (diameter 0.05mm) in a twisted pair (California Fine Wire Company, Grover Beach, CA). Thermocouples were inserted such that they did not puncture large vessels in the DSWC, but were able to bracket the tumor, i.e. one inferior and one superior, and to be close to the center of the DSWC. Thermocouples were not placed directly in the center of the DSWC because this would cause a large viscous heating artifact from the focus of the ring transducer making temperature measurements inaccurate 53 . Following thermocouple insertion, a new 12mm diameter 150µm thick coverslip with the transducer attached to the top surface with cyanoacrylate adhesive was placed in the DSWC with an internal retaining ring. The underside of the DSWC was coupled to a reservoir of degassed water with ultrasound gel to minimize acoustic reflections. The reservoir was heated with a circulating water heater (T/Pump Model TP-500, Gaymar, Orchard Park, NY) to maintain the temperature of the DSWC tissue at 36-37°C for the duration of the imaging study. Once the preparation was complete the removable microscope stage was transferred to the microscope for concurrent FUS+HT and 2PM imaging. An overview of the experimental apparatus and an example 2PM image is shown in Figure 1 . FUS Parameters for HT A PZT-4 cylindrical transducer (diameter = 10mm, thickness = 1.5mm, height = 1.1mm) was used for sonication. Four physically identical transducers were used in this study to expedite experiment throughput with a driving frequency of 1.189 ± 0.015MHz (mean ± SD) in the thickness mode. A full characterization of the transducer design is presented here 54 . The normalized acoustic intensity profile can be seen in Figure 1 C. Each transducer was driven by a function generator (33210A, Agilent, Palo Alto, CA) and a 53dB RF power amplifier (NP Technologies Inc., Newbury Park, CA). The applied forward and reflected electrical power was monitored using an RF power meter (E4419B, Agilent, Palo Alto, CA) and each transducer had its own custom impedance matching circuit to minimize the reflected power along the transmission line. Temperature monitoring of DSWC tissue was performed using a thermocouple data acquisition system (DT9828, Data Translation Inc., Marlboro, MA). Temperature Feedback Control The temperature elevation in the DSWC was controlled by adjusting the applied electrical power to the transducer based on the temperature feedback from implanted thermocouples at a rate of 1 Hz using a PID control algorithm with empirically determined gain constants (K P = 0.09, K I = 0.001, K D = 0.5). The output power was given by: P i+1 = P i + ΔP i ≤ P max (1) ΔP i = ( K P ·e i ) + ( K I ·Σe j ) + ( K D ·(e i - e i-1 ) ) e i = T g - T i The integral summation index (index j ) was initialized to zero when FUS was turned on and only operated when the measured temperature (T i ) was within ±1°C of the desired temperature (T g ). To reduce the initial accumulation of error, the desired temperature rise was prescribed as an exponential ramp instead of a step function 55 . Four HT exposure schemes were investigated in this study; three groups used FUS+HT to a target temperature of 42°C and the fourth served as an unheated control. As has been investigated in previous literature 38 , 42 , the first group measured the drug release and penetration following 20min of sustained FUS+HT. In this group the exponential ramp was 6min in duration and the maximum electrical power was 1.5W. The second group used a novel short duration HT format of 10x 30s heating 'bursts' separated by 5min to allow the tissue to return to baseline temperature and quantitative 2PM imaging to be performed. In this case the exponential ramp was 15s in duration. The third heating group involved a continuous temperature elevation, 3.5min duration, with the same exponential ramp as the short duration bursts. The purpose of this group was to expose the DSWC tissue to the same accumulated duration above 41.3°C (the ideal release temperature from the LTSL-DOX formulation 47 ) as the short duration bursts over the course of 60min. In the two previously mentioned heating schemes the P max value from equation (1) during sonication was determined based on threshold criteria as follows. P max began at 4W until either thermocouple read above 41°C and below 42°C at which point P max was dropped to 2W. Then when either thermocouple read above 42°C for the first time, P max was dropped again to its final value of 1W. During a pilot thermocouple pullback experiment, a third thermocouple was placed in the center of the DSWC such that it could provide a temperature reading from the focus of the transducer during a fixed power exposure. In this experiment it was found that the temperature reading at the focus was +0.25°C warmer than the reading from the other two thermocouples, following subtraction of the +0.28°C viscous heating artifact 56 . This difference became +0.21°C when the middle thermocouple was translated ±1mm from the focus providing an indication of the temperature uniformity within the imaging field-of-view (FOV). 2PM Imaging of DOX Release On the experiment day, the DSWC was placed under a water immersion 40× 0.80NA objective lens with a working distance of 3.3mm and a FOV of 318µm×318µm (LUMPLFLN 40XW, Olympus, Tokyo, Japan). Laser scanning was performed using a multiphoton microscope (FV1000MPE, Olympus, Tokyo, Japan) and a Mai-Tai mode-locked Titanium Sapphire tunable laser (690-1040nm; Newport Corp., Irvine, CA) was used to excite the FaDu-GFP cells and collagen at 900nm, as well as to excite the FITC-labelled vasculature and doxorubicin at 810nm. An external photomultiplier tube (Hamamatsu, Hamamatsu City, Japan) collected the fluorescent emissions following bandpass filtering of 420/460nm for collagen, 495/540nm for FITC and FaDu-GFP and 575/630nm for doxorubicin. To visualize the tumor vasculature 2MDa dextran-conjugated FITC was injected as a bolus through the tail vein. Tumor vessels were confirmed by imaging the tissue at 900nm in order to excite the FaDu-GFP as well as the FITC dextran. Tumor vessels near the surface of the DSWC and the center of the ring transducer were selected to maintain high SNR and close proximity to the acoustic focus of the transducer. Once a vessel bed was selected a baseline XYZ volume stack was acquired at 810nm to create a 3D vascular map of the tumor vessels. Lateral images of 512×512 pixels (0.602µm/pixel, 8µs/pixel, Kalman 2× line filter) were acquired below the coverslip surface to 200µm depth in 5µm increments for an acquisition time of 235.04s for each volume stack. These volumes were acquired in an XYZT order every 6min. In the 2min between stacks, a single plane XYT acquisition was taken. For each animal, the XY plane of the time series scan was selected to be between 35µm-100µm in depth where tumor vessels could be visualized with good SNR. Single plane acquisitions were acquired with the same lateral resolution as the depth scans but with a greater temporal resolution of 0.902Hz (512×512 pixels, 0.602µm/pixel, 2µs/pixel, no Kalman filter). Time scans of 50 frames were acquired between each depth stack for an imaging duration of 55.44s per scan, with the exception of the first time scan in the 3.5min of FUS+HT group, in which 275 frames were acquired in 5min to cover the duration of FUS. A timing diagram of the 2PM imaging paradigm is shown in Figure 2 .
Show full methods section
Tumor cell line and cell culture Human FaDu squamous cell carcinoma cells expressing green fluorescent protein (FaDu-GFP, AntiCancer Inc., San Diego, CA) were cultured at 37°C in 5% CO 2 /95% air. For in vitro cultures, cells were propagated in RPMI 1640 with L-glutamine (MultiCell), supplemented with 10% FBS, penicillin (100 U/mL) and streptomycin (100 µg/mL). Cells were trypsinized before reaching confluency and harvested.
Animal Preparation and in vivo Tumor Model Six-eight week old
BALB/c nu/nu mice were purchased from Charles River, sterile rodent food and water were given ad libitum . All animal procedures were approved by the Animal Care Committee at Sunnybrook Research Institute, Toronto, Canada. FaDu-GFP cells were routinely cultured as described above. Tumor cells (2x10 6 ) suspended in 30µL of media were injected in the fascia of a dorsal skin flap placed in a window chamber in mice 48 . Following tumor inoculation mice carrying window chambers were housed individually. Imaging studies were performed 9-12 days after inoculation when tumors were visually perfused. On the imaging day, mice with tumor-bearing DSWCs were anesthetized with isoflurane. The tail veins were cannulated for the injection of fluorescent dextran (2MDa FITC, 33mg/kg, dissolved in PBS; ThermoFisher Scientific) and LTSL-DOX (ThermoDox®, 10mg/kg of doxorubicin, in equal parts of 5% dextrose solution). The doxorubicin dose prescribed here was chosen to correspond to a human equivalent dose of approximately 30mg/m 2 49 . This is similar to that used in rats (30mg/m 2 50 ), rabbits (30mg/m 2 51 ) and on the low end of what has been administered in clinical trials (20-60mg/m 2 52 ) with ThermoDox®. The animals were placed on a heating pad atop a removable microscope stage which used feedback from a rectal thermistor to maintain the animal core body temperature at 37°C during the experiment (TC-1000, CWE Inc., Ardmore, PA). The glass coverslip of the DSWC was then removed to allow the insertion of two bare-junction type-T thermocouples into the DSWC adjacent to the tumor to provide temperature feedback. The thermocouples were fabricated by soldering the tips of a copper and a constantan wire (diameter 0.05mm) in a twisted pair (California Fine Wire Company, Grover Beach, CA). Thermocouples were inserted such that they did not puncture large vessels in the DSWC, but were able to bracket the tumor, i.e. one inferior and one superior, and to be close to the center of the DSWC. Thermocouples were not placed directly in the center of the DSWC because this would cause a large viscous heating artifact from the focus of the ring transducer making temperature measurements inaccurate 53 . Following thermocouple insertion, a new 12mm diameter 150µm thick coverslip with the transducer attached to the top surface with cyanoacrylate adhesive was placed in the DSWC with an internal retaining ring. The underside of the DSWC was coupled to a reservoir of degassed water with ultrasound gel to minimize acoustic reflections. The reservoir was heated with a circulating water heater (T/Pump Model TP-500, Gaymar, Orchard Park, NY) to maintain the temperature of the DSWC tissue at 36-37°C for the duration of the imaging study. Once the preparation was complete the removable microscope stage was transferred to the microscope for concurrent FUS+HT and 2PM imaging. An overview of the experimental apparatus and an example 2PM image is shown in Figure 1 . FUS Parameters for HT A PZT-4 cylindrical transducer (diameter = 10mm, thickness = 1.5mm, height = 1.1mm) was used for sonication. Four physically identical transducers were used in this study to expedite experiment throughput with a driving frequency of 1.189 ± 0.015MHz (mean ± SD) in the thickness mode. A full characterization of the transducer design is presented here 54 . The normalized acoustic intensity profile can be seen in Figure 1 C. Each transducer was driven by a function generator (33210A, Agilent, Palo Alto, CA) and a 53dB RF power amplifier (NP Technologies Inc., Newbury Park, CA). The applied forward and reflected electrical power was monitored using an RF power meter (E4419B, Agilent, Palo Alto, CA) and each transducer had its own custom impedance matching circuit to minimize the reflected power along the transmission line. Temperature monitoring of DSWC tissue was performed using a thermocouple data acquisition system (DT9828, Data Translation Inc., Marlboro, MA). Temperature Feedback Control The temperature elevation in the DSWC was controlled by adjusting the applied electrical power to the transducer based on the temperature feedback from implanted thermocouples at a rate of 1 Hz using a PID control algorithm with empirically determined gain constants (K P = 0.09, K I = 0.001, K D = 0.5). The output power was given by: P i+1 = P i + ΔP i ≤ P max (1) ΔP i = ( K P ·e i ) + ( K I ·Σe j ) + ( K D ·(e i - e i-1 ) ) e i = T g - T i The integral summation index (index j ) was initialized to zero when FUS was turned on and only operated when the measured temperature (T i ) was within ±1°C of the desired temperature (T g ). To reduce the initial accumulation of error, the desired temperature rise was prescribed as an exponential ramp instead of a step function 55 . Four HT exposure schemes were investigated in this study; three groups used FUS+HT to a target temperature of 42°C and the fourth served as an unheated control. As has been investigated in previous literature 38 , 42 , the first group measured the drug release and penetration following 20min of sustained FUS+HT. In this group the exponential ramp was 6min in duration and the maximum electrical power was 1.5W. The second group used a novel short duration HT format of 10x 30s heating 'bursts' separated by 5min to allow the tissue to return to baseline temperature and quantitative 2PM imaging to be performed. In this case the exponential ramp was 15s in duration. The third heating group involved a continuous temperature elevation, 3.5min duration, with the same exponential ramp as the short duration bursts. The purpose of this group was to expose the DSWC tissue to the same accumulated duration above 41.3°C (the ideal release temperature from the LTSL-DOX formulation 47 ) as the short duration bursts over the course of 60min. In the two previously mentioned heating schemes the P max value from equation (1) during sonication was determined based on threshold criteria as follows. P max began at 4W until either thermocouple read above 41°C and below 42°C at which point P max was dropped to 2W. Then when either thermocouple read above 42°C for the first time, P max was dropped again to its final value of 1W. During a pilot thermocouple pullback experiment, a third thermocouple was placed in the center of the DSWC such that it could provide a temperature reading from the focus of the transducer during a fixed power exposure. In this experiment it was found that the temperature reading at the focus was +0.25°C warmer than the reading from the other two thermocouples, following subtraction of the +0.28°C viscous heating artifact 56 . This difference became +0.21°C when the middle thermocouple was translated ±1mm from the focus providing an indication of the temperature uniformity within the imaging field-of-view (FOV). 2PM Imaging of DOX Release On the experiment day, the DSWC was placed under a water immersion 40× 0.80NA objective lens with a working distance of 3.3mm and a FOV of 318µm×318µm (LUMPLFLN 40XW, Olympus, Tokyo, Japan). Laser scanning was performed using a multiphoton microscope (FV1000MPE, Olympus, Tokyo, Japan) and a Mai-Tai mode-locked Titanium Sapphire tunable laser (690-1040nm; Newport Corp., Irvine, CA) was used to excite the FaDu-GFP cells and collagen at 900nm, as well as to excite the FITC-labelled vasculature and doxorubicin at 810nm. An external photomultiplier tube (Hamamatsu, Hamamatsu City, Japan) collected the fluorescent emissions following bandpass filtering of 420/460nm for collagen, 495/540nm for FITC and FaDu-GFP and 575/630nm for doxorubicin. To visualize the tumor vasculature 2MDa dextran-conjugated FITC was injected as a bolus through the tail vein. Tumor vessels were confirmed by imaging the tissue at 900nm in order to excite the FaDu-GFP as well as the FITC dextran. Tumor vessels near the surface of the DSWC and the center of the ring transducer were selected to maintain high SNR and close proximity to the acoustic focus of the transducer. Once a vessel bed was selected a baseline XYZ volume stack was acquired at 810nm to create a 3D vascular map of the tumor vessels. Lateral images of 512×512 pixels (0.602µm/pixel, 8µs/pixel, Kalman 2× line filter) were acquired below the coverslip surface to 200µm depth in 5µm increments for an acquisition time of 235.04s for each volume stack. These volumes were acquired in an XYZT order every 6min. In the 2min between stacks, a single plane XYT acquisition was taken. For each animal, the XY plane of the time series scan was selected to be between 35µm-100µm in depth where tumor vessels could be visualized with good SNR. Single plane acquisitions were acquired with the same lateral resolution as the depth scans but with a greater temporal resolution of 0.902Hz (512×512 pixels, 0.602µm/pixel, 2µs/pixel, no Kalman filter). Time scans of 50 frames were acquired between each depth stack for an imaging duration of 55.44s per scan, with the exception of the first time scan in the 3.5min of FUS+HT group, in which 275 frames were acquired in 5min to cover the duration of FUS. A timing diagram of the 2PM imaging paradigm is shown in Figure 2 .
Analysis of 2PM Data
All of the 2PM image data was processed in Matlab (2016b, The MathWorks, Natick, MA) to segment the intravascular and extravascular spaces as described in 42 . DOX fluorescence is proportional to its concentration in tissue. Drug release as a function of time was reported from the analysis of the XYT scan data. The DOX fluorescence at time t (denoted as I t ) was corrected for FITC bleed-through and normalized with respect to the baseline fluorescent signal (I 0 ) in each compartment (intravascular and extravascular). It was expressed in terms of percentage increase (%I 0 ) using the following relationship. %I 0 = (I t - I 0 )/I 0 × 100% (2) First, 2D vascular masks were created and the baseline fluorescent signal (I 0 ) was calculated from the average of the first 5 frames (spanning 5.5s) in each XYT acquisition prior to the start of FUS in each short duration and continuous 3.5min FUS+HT exposures, and similarly in unheated controls. For a given exposure (i.e. every 6min in the case of short duration bursts - see Figure 2 ) this permitted an examination of the release as a function of time within the exposure time scale. It was also of interest to estimate the average release for each exposure in both compartments which was calculated relative to the baseline immediately preceding a FUS exposure (i.e. mean of %I 0 ). This provided a metric for the incremental drug release and uptake associated with a particular exposure (either short duration of 3.5min continuous). The area under the concentration-time curve (AUC) was calculated by trapezoidal integration of the percent increase from the baseline signal level ( ) as a function of time. The AUC provides a measure of the amount of drug present in the tissue over time, which is a frequently employed metric of bioavailability 42 . This data is reported for all groups except the 20min of FUS+HT group, where the entire duration of FUS was not recorded in real-time. Drug penetration depth was measured for the XYZT data by performing a Euclidean distance transform of the segmented 3D vascular mask to create a distance map from each extravascular pixel to the nearest vascular structure. The baseline fluorescent signal in this case was measured prior to the first XYZT acquisition. Boundary effects were removed by truncating the dataset by 50 pixels on all sides in the XY plane. The mean fluorescent signal for pixels at each distance from the nearest vessel were reported up to 17.5µm. This penetration depth was the furthest distance that was reliably discernable across all DSWC due to the heterogeneity of tumor vessel spacing between animals.
Statistical Analysis
Data comparison of DOX release and penetration among heating groups was performed using one-way analysis of variance (ANOVA) followed by a multiple comparison test in Matlab. For all analyses, a value of p < 0.05 was considered statistically significant.
📊 Figures
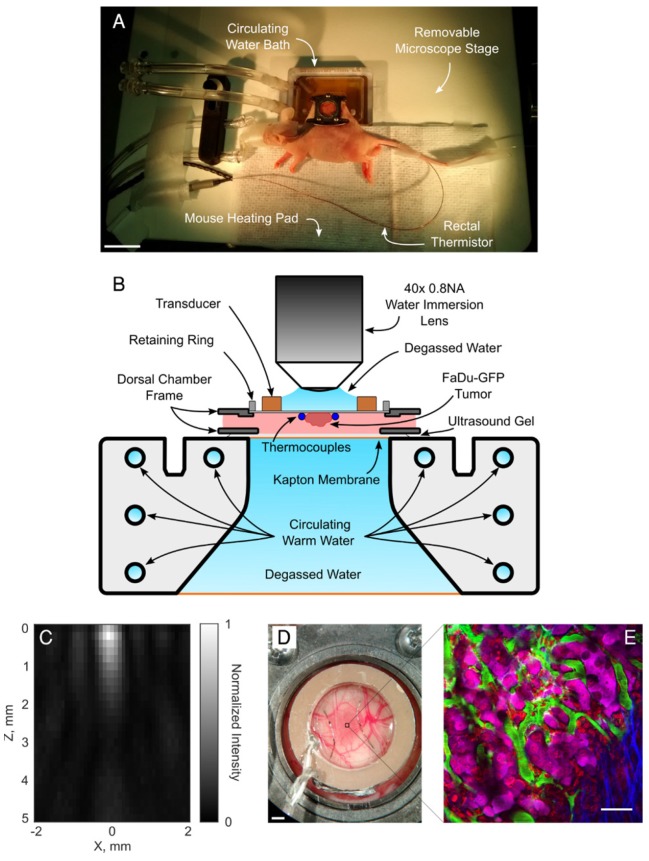
Figure 1
A , Removable microscope stage with a DSWC-bearing nude mouse in position for 2PM imaging, scale bar = 2cm. B , DSWC mount for use during 2PM for imaging drug release from LTSL-DOX during FUS+HT, miss...
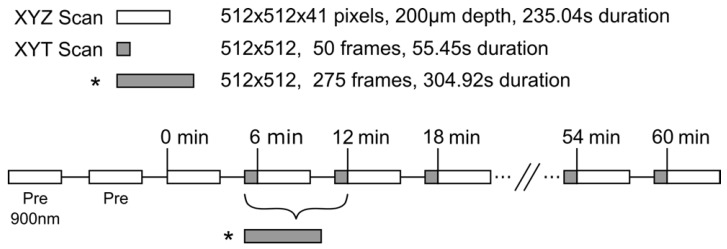
Figure 2
Experimental timing diagram describing the 2PM imaging paradigm used to image the release of DOX from LTSL-DOX during FUS+HT to 42u00b0C. The asterisk (*) indicates a longer time series which replaces...
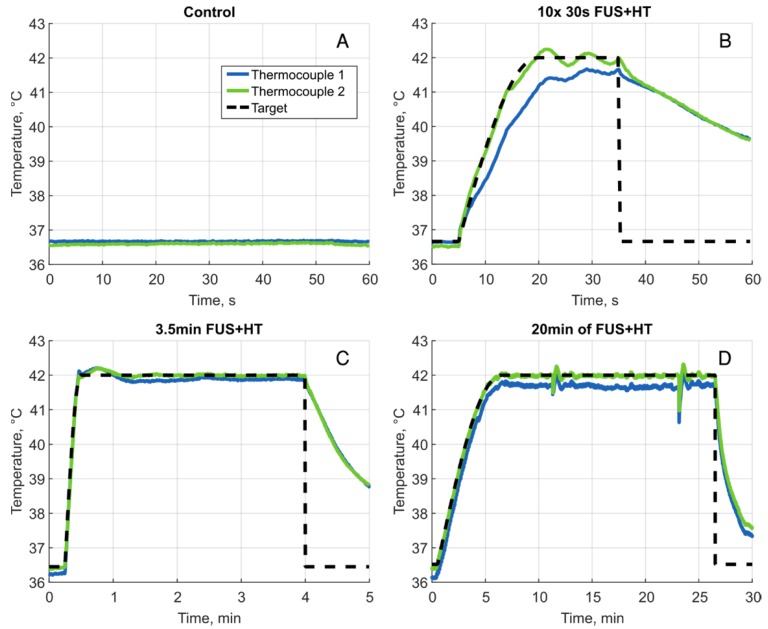
Figure 3
Sample heating curves for all 4 heating groups. A , Unheated control, B , one example of a 30s FUS+HT burst to 42u00b0C, there were 10 bursts in total for each mouse in this group separated by 5 minut...
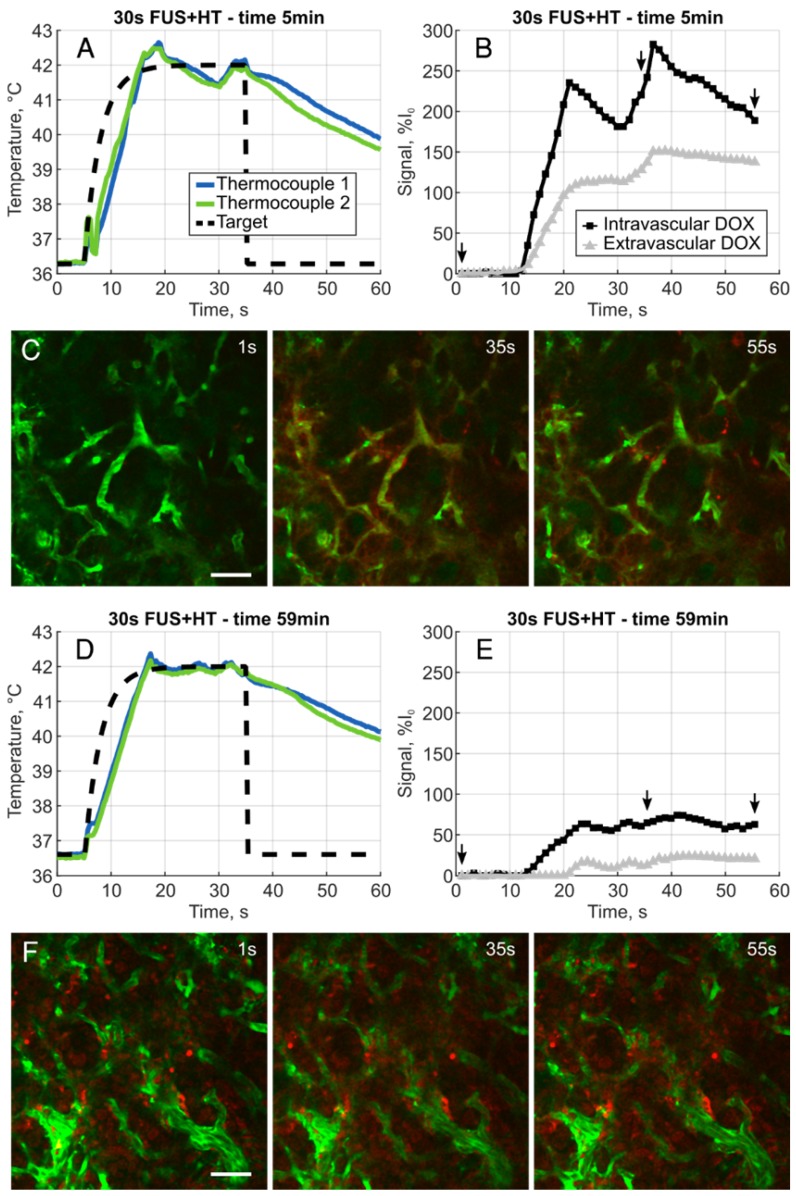
Figure 4
A , Example heating curve during the first 30s burst of FUS+HT at the 5 minute time point immediately following the infusion of drug. B , Clear evidence of the release of DOX is seen from the measured...
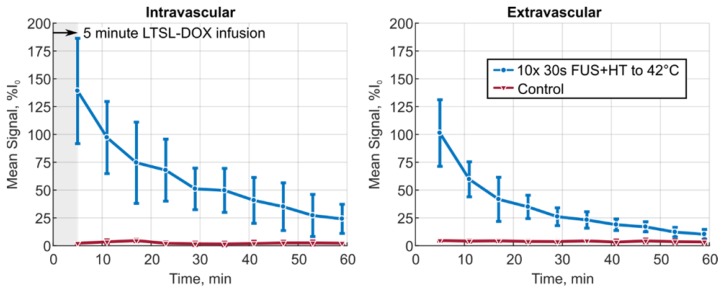
Figure 5
The mean signal amplitude measured during each of the 10 XYT scans for the 30s of FUS+HT to 42u00b0C group versus the unheated control group in both the intra- and extravascular compartments. Data are...
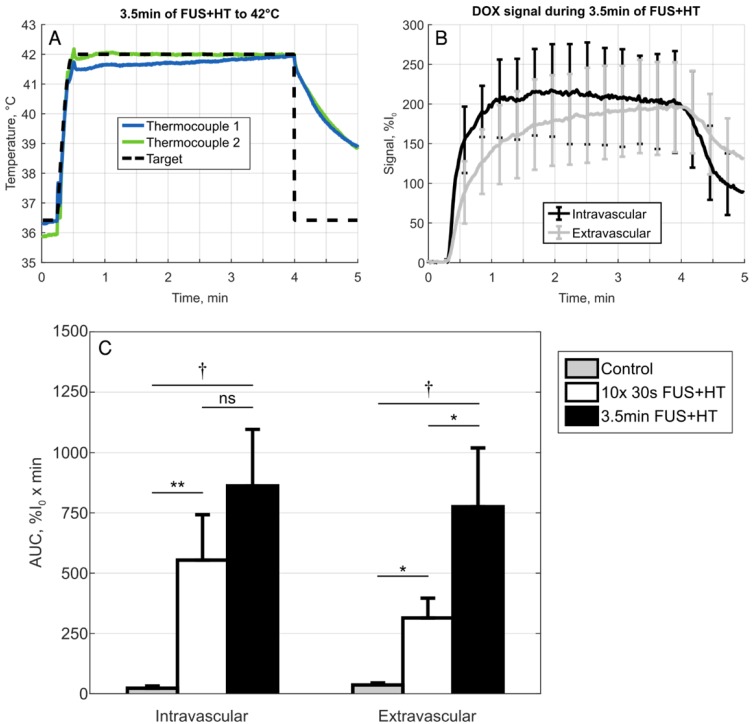
Figure 6
A , Temperature profile of a 3.5min continuous FUS+HT to 42u00b0C group and B , the subsequent release of DOX (n=3). C , A comparison of the sum of each discrete AUC measurement in the 10x 30s of FUS+...
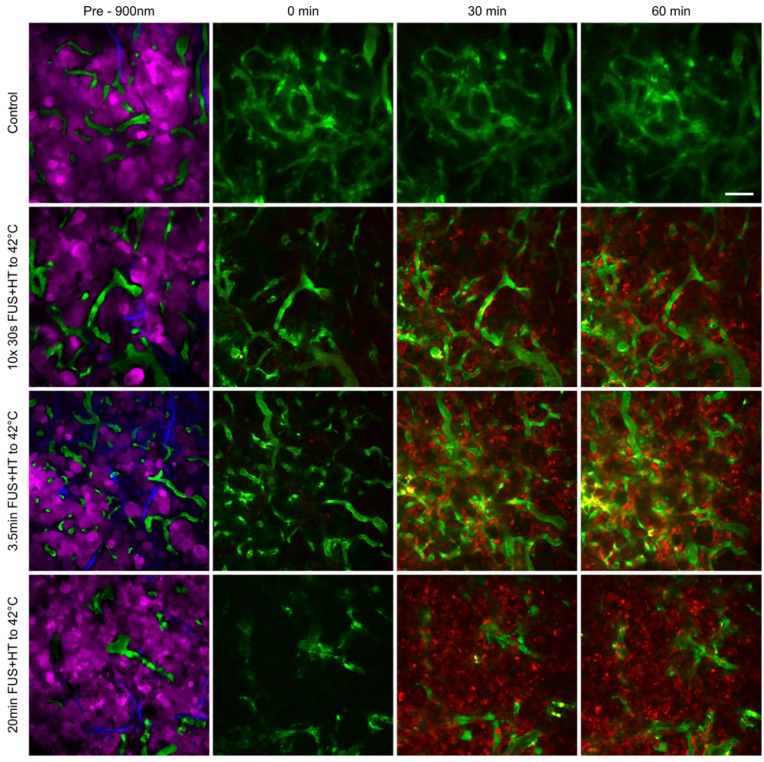
Figure 7
Tumor cell localization and uptake of DOX at serial time points following FUS+HT to 42u00b0C and in an unheated control. In the top row we see that no appreciable drug is taken up by the tumor cells a...
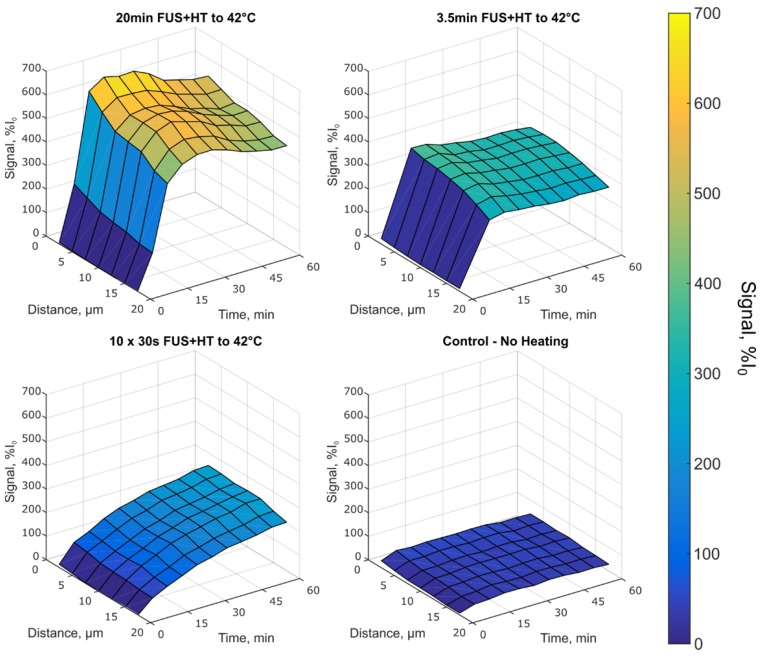
Figure 8
Depth penetration of DOX up to 17.5u00b5m in tumor tissue in each heating group. The 10x 30s FUS+HT group shows an increase in the drug signal following each hyperthermia burst, whereas in the case of...
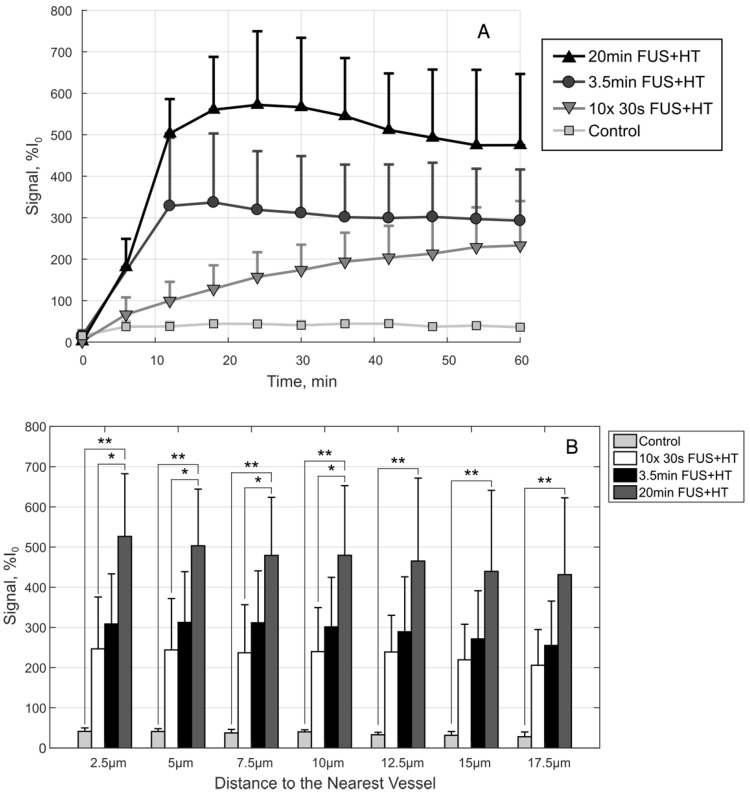
Figure 9
A , The drug penetration averaged along the depth direction to give an indication of the average drug signal in each group as a function of time. B , A comparison of the drug penetration as a function...
Figure images are served from the NIH/NLM PubMed Central Open Access Subset or Europe PMC; copyright remains with the publishers and authors.
💬 Discussion
0 commentsNo comments yet. Be the first to start a discussion!
Leave a Comment