Abstract
Abstract Advanced microscopy methods allow obtaining information on (dynamic) conformational changes in biomolecules via measuring a single molecular distance in the structure. It is, however, extremely challenging to capture the full depth of a three-dimensional biochemical state, binding-related structural changes or conformational cross-talk in multi-protein complexes using one-dimensional assays. In this paper we address this fundamental problem by extending the standard molecular ruler based on Förster resonance energy transfer (FRET) into a two-dimensional assay via its combination with protein-induced fluorescence enhancement (PIFE). We show that donor brightness ( via PIFE) and energy transfer efficiency ( via FRET) can simultaneously report on e.g., the conformational state of double stranded DNA (dsDNA) following its interaction with unlabelled proteins ( Bam HI, Eco RV, and T7 DNA polymerase gp5/trx). The PIFE-FRET assay uses established labelling protocols and single molecule fluorescence detection schemes (alternating-laser excitation, ALEX). Besides quantitative studies of PIFE and FRET ruler characteristics, we outline possible applications of ALEX-based PIFE-FRET for single-molecule studies with diffusing and immobilized molecules. Finally, we study transcription initiation and scrunching of E. coli RNA-polymerase with PIFE-FRET and provide direct evidence for the physical presence and vicinity of the polymerase that causes structural changes and scrunching of the transcriptional DNA bubble.
🔬 Techniques
🧬 Organisms
✨ Fluorophores
🏭 Microscope Brands
🧪 Reagent Suppliers
🔎 Objectives
💻 Software Details
💾 Data Repositories
🏛️ Research Organizations (ROR)
Affiliated research institutions:
📋 Methods
DNA, Proteins and Reagents Unless otherwise stated, reagents of luminescent grade were used as received. Amino-modified and fluorophore-labelled oligonucleotides were used as received (IBA, Germany). DNA single strands were annealed using the following protocol: A 5–50 μL of a 1 μM solution of two complementary single-stranded DNAs (ssDNA) was heated to 98 °C for 4 minutes and cooled down to 4 °C with a rate of 1 °C/min in annealing buffer (500 mM sodium chloride, 20 mM TRIS-HCl, and 1 mM EDTA at pH = 8). Different sets of complementary DNA-oligonucleotides were used ( Fig. S4 ). Set 1 : The first scaffold uses two complementary 45-mers carrying the donors (Cy3, Cy3B, TMR or Alexa555) at the 5′-end of the top-strand ( Fig. S4A ). The acceptor (ATTO647N or Cy5) was attached in 8, 13, 18, 23, 28 or 33 bp separations to the donor fluorophore. The DNAs are referred to as e.g., 33bp-Cy3/ATTO647N for a sample with 33 bp separation between Cy3 on the top-strand and ATTO647N on the bottom-strand ( Fig. S4A ). Non-specific binding of T7 DNA polymerase gp5/thioredoxin via PIFE was investigated using 18/23/28/33bp-Cy3/ATTO647N as well as 33bp-(Cy3/Cy3b/AF555/TMR)/ATTO647N and 33bp-TMR/Cy5. T7 DNA polymerase gp5 was expressed and purified in a 1:1 complex with thioredoxin in E. coli 107 . These samples were provided by the labs of van Oijen and Richardson 107 . Set 2 : To study the distance dependence of PIFE in absence of FRET we used DNAs comprising of 40-mers carrying Cy3(B) and ATTO647N ( Fig. S4B ). These DNAs separate both dyes by 40 bp which prohibits FRET-interactions due to large separation >10 nm. The DNAs carry palindromic sequences for two different restriction enzymes Bam HI and Eco RV at 1, 2, 3, 5 and 7 bp distance with respect to Cy3(B) and are termed 1bp-Cy3(B)- (#bp) - Bam HI-40-ATTO647N for a dsDNA with 40 bp separation in FRET and #bp separation between the donor and Bam HI inducing PIFE.
Show full methods section
DNA, Proteins and Reagents Unless otherwise stated, reagents of luminescent grade were used as received. Amino-modified and fluorophore-labelled oligonucleotides were used as received (IBA, Germany). DNA single strands were annealed using the following protocol: A 5–50 μL of a 1 μM solution of two complementary single-stranded DNAs (ssDNA) was heated to 98 °C for 4 minutes and cooled down to 4 °C with a rate of 1 °C/min in annealing buffer (500 mM sodium chloride, 20 mM TRIS-HCl, and 1 mM EDTA at pH = 8). Different sets of complementary DNA-oligonucleotides were used ( Fig. S4 ). Set 1 : The first scaffold uses two complementary 45-mers carrying the donors (Cy3, Cy3B, TMR or Alexa555) at the 5′-end of the top-strand ( Fig. S4A ). The acceptor (ATTO647N or Cy5) was attached in 8, 13, 18, 23, 28 or 33 bp separations to the donor fluorophore. The DNAs are referred to as e.g., 33bp-Cy3/ATTO647N for a sample with 33 bp separation between Cy3 on the top-strand and ATTO647N on the bottom-strand ( Fig. S4A ). Non-specific binding of T7 DNA polymerase gp5/thioredoxin via PIFE was investigated using 18/23/28/33bp-Cy3/ATTO647N as well as 33bp-(Cy3/Cy3b/AF555/TMR)/ATTO647N and 33bp-TMR/Cy5. T7 DNA polymerase gp5 was expressed and purified in a 1:1 complex with thioredoxin in E. coli 107 . These samples were provided by the labs of van Oijen and Richardson 107 . Set 2 : To study the distance dependence of PIFE in absence of FRET we used DNAs comprising of 40-mers carrying Cy3(B) and ATTO647N ( Fig. S4B ). These DNAs separate both dyes by 40 bp which prohibits FRET-interactions due to large separation >10 nm. The DNAs carry palindromic sequences for two different restriction enzymes Bam HI and Eco RV at 1, 2, 3, 5 and 7 bp distance with respect to Cy3(B) and are termed 1bp-Cy3(B)- (#bp) - Bam HI-40-ATTO647N for a dsDNA with 40 bp separation in FRET and #bp separation between the donor and Bam HI inducing PIFE.
DNA sequences and positioning of Bam
HI binding sites were adapted from ref. 16 ; those for Eco RV were derived from 1 bp-PIFE- Bam HI-DNA 16 . Set 3 : To study the distance dependence of PIFE in presence of FRET, complementary 40-mer oligonucleotides carrying the donors (Cy3 and Cy3B) at the 5′-end of the top-strand and palindromic binding sequence for Bam HI and Eco RV in 1bp distance from the donor were employed ( Fig. S4C ). The acceptor (ATTO647N) was attached in 13, 18, 23 and 40 bp ( Bam HI) respectively in 18, 23, 28 and 40 bp ( Eco RV) distance to the donor fluorophore. The DNAs are termed (analogue to Set3) 1bp-Cy3(B)-1 bp- Bam HI-(#bp)-ATTO647N for a dsDNA with 1 bp separation in PIFE and #bp separation between the donor and the acceptor.
DNA sequences and positioning for Bam HI and Eco
RV were derived from 1 bp-PIFE- Bam HI-DNA 16 . Set 4 : To check the influence of internal and external labelling ( Fig. S7 ) we attached Cy3 to the 3 rd base pair in the top strand of 5bp-PIFE- Bam HI-DNA and ATTO647N at the 5′end of the bottom strand ( Fig. S4D ). We termed it 3 bp-Cy3(B)-1 bp- Bam HI-40-ATTO647N. Bam HI and Eco RV were used as received (NEB/Bioké, The Netherlands). Set 5 : PIFE-FRET was employed to study the interaction between E. coli RNA polymerase and promoter dsDNA during transcription initiation. In these experiments Oligos ( Fig. S4E,F ) had the lacCONS+20A sequence 108 . The template and nontemplate strands, were labeled with ATTO647N and Cy3(B) at different promoter registers as indicated in Fig. S4 . RNAP holoenzyme was supplied by NEB, Ipswich, MA, USA, M0551S. High-purity ribonucleotide triphosphates (NTPs) (GE Healthcare, Little Chalfont, Buckinghamshire, UK) as well as Adenylyl(3′–5′) adenosine (ApA; Ribomed, Carlsbad, CA, USA) were used in all transcription reactions at 100 μM each. ALEX-experiments were carried out at 25–50 pM of dsDNA at room temperature (22 °C). For experiments on dsDNA only ( Fig. S4A ) or in combination with gp5/trx, an imaging buffer based on 50 mM TRIS-HCl, 200 mM potassium chloride at pH 7.4 was applied. 1 mM Trolox 109 110 and 10 mM MEA were added to the buffer for photostabilization as reported in ref. 111 . Experiments with Bam HI were carried out in 50 mM TRIS-HCl, 100 mM sodium chloride, 10 mM CaCl2 and 0.1 mM EDTA at pH 7.4 in the presence of 143 mM bME. Experiments with Eco RV were carried out in 50 mM TRIS-HCl, 100 mM sodium chloride, 10mM CaCl2 and 0.1 mM EDTA at pH 7.4. All binding experiments with Bam HI and Eco RV were performed in the presence of calcium chloride, to prevent enzymatic activity 86 87 88 and the formation of aggregates 89 . RNA polymerase transcription assays 10 μl of pre-solutions were prepared by 180 nM RNA Polymerase (RNAP) holoenzyme in TB buffer (50 mM Tris-HCl, pH 8, 100 mM KCl, 10 mM MgCl2, 1 mM DTT, 100 μg/ml BSA, and 5% glycerol). Solutions were incubated 20 min at 30 °C, then 0.6μl of 1μM promoter DNA was added, and samples were further incubated 30 min at 37 °C. 1 μl of 100 mg/ml Heparin-Sepharose suspension (GE Healthcare, Inc.) was added with 20 μl of KG7 buffer (40 mM HEPES-NaOH, pH 7, 10 mM MgCl 2 , 1 mM DTT, 1 mM MEA, and 100 μg/ml BSA). The mixture was incubated 1 min at 37 °C, to eliminate free RNAPs as well as RNAP binding promoter non-specifically. After 1 min incubation, samples were centrifuged using a table top centrifuge, and 15 μl of supernatants were transferred to tubes containing 15 μl of KG7 buffer incubate 30 min at 37 °C to make RP O solutions. In order to make each transcription initial complexes, 4 μl of RP O solutions are transferred into 16 μl of solutions containing 0.625 mM A p A (for RP ITC=2 ), 0.625 mM A p A + 0.625 mM UTP (for RP ITC≤4 ), 0.625 mM A p A + 0.625mM UTP + 0.625 mM GTP (for RP ITC≤7 ), 0.625 mM ATP + 0.625 mM UTP + 0.625 mM GTP (for RD E=11 ) 108 , or 0.625 mM of all NTPs (for Run-off) 108 , in KG7 buffer, then incubate 30 min at 37 °C.
Steady-state fluorescence and anisotropy measurements
Fluorescence spectra and anisotropy 112 values r were derived on a standard scanning spectrofluorometer (Jasco FP-8300; 20nm exc. and em. Bandwidth; 8 sec integration time) and calculated at the emission maxima of the fluorophores (for Cy3B, λ ex = 532 nm and λ em = 570 nm; for ATTO647N, λ ex = 640 nm and λ em = 660 nm), according to the relationship r = (I VV − GI VH )/(I VV + 2GI VH ). I VV and I VH describe the emission components relative to the vertical (V) or horizontal (H) orientation of the excitation and emission polarizer. The sensitivity of the spectrometer for different polarizations was corrected using horizontal excitation to obtain G = I HV /I HH .
Time-resolved fluorescence measurements
Fluorescence lifetimes were determined using time-correlated single-photon counting with a home-built confocal microscope described in ref. 113 . Fitting of the decay functions was done with a mono- (Cy3B, ATTO647N) or double-exponential function (Cy3) taking the instrumental response into account. Values reported in this section and Supplementary Table 1 are given with an error of 5%. The data was processed via a custom data evaluation program 114 written in MATLAB (2013b, MathWorks Inc., Natick, MA). The procedure yielded a bi-exponential decay of 1.6 and 0.4 ns for Cy3, and mono-exponential decays of 2.29 ns for Cy3B and 4.24 ns for ATTO647N on a 40-mer dsDNA. The presence of Bam HI alters the lifetimes to 1.75 ns and 0.4 ns on average (Cy3), 2.22 ns (Cy3B) and 4.29 ns (ATTO647N). On a 45-mer DNA lifetimes of Cy3 (1.18 ns, bi-exponential average), Cy3B (2.30 ns), TMR (3.23 ns), Alexa555 (1.64 ns), ATTO647N (4.17 ns) and Cy5 (1.38 ns) were determined. Addition and non-specific binding of gp5/trx alters their lifetimes as follows: Cy3 (1.69 ns, bi-exponential average), Cy3B (2.5 ns), TMR (2.98 ns), ATTO647N (4.23 ns) and Cy5 (1.70 ns).
ALEX-Spectroscopy and data analysis
For single-molecule experiments custom-built confocal microscopes for μs-ALEX described in 115 116 were used as schematically shown in Fig. S2 . Shortly, the alternation period was set to 50 μs, and the excitation intensity to 60 μW at 532 nm and 25 μW at 640 nm. A 60x objective with NA = 1.35 (Olympus, UPLSAPO 60XO) was used. Laser excitation was focused to a diffraction limited spot 20 μm into the solution. Fluorescence emission was collected, filtered against background (using a 50-μm pinhole and bandpass filters) and detected with two avalanche photodiode detectors (τ-spad, Picoquant, Germany). After data acquisition, fluorescence photons arriving at the two detection channels (donor detection channel: D em ; acceptor detection channel: A em ) were assigned to either donor- or acceptor-based excitation on their photon arrival time as described previously 66 81 . From this, three photon streams were extracted from the data corresponding to donor-based donor emission F(DD), donor-based acceptor emission F(DA) and acceptor-based acceptor emission F(AA; Fig. S2A ). During diffusion ( Fig. S2B ), fluorophore stoichiometries S and apparent FRET efficiencies E* were calculated for each fluorescent burst above a certain threshold yielding a two-dimensional histogram 66 81 . Uncorrected FRET efficiency E* is calculated according to: S is defined as the ratio between the overall green fluorescence intensity over the stotal green and red fluorescence intensity and describes the ratio of donor-to-acceptor fluorophores in the sample S: Using published procedures to identify bursts corresponding to single molecules 117 , we obtained bursts characterized by three parameters (M, T, and L). A fluorescent signal is considered a burst provided it meets the following criteria: a total of L photons, having M neighbouring photons within a time interval of T microseconds. For all data presented in this study, a dual colour burst search 117 118 using parameters M = 15, T = 500 μs and L = 25 was applied; additional thresholding removed spurious changes in fluorescence intensity and selected for intense single-molecule bursts (all photons >100 photons unless otherwise mentioned). Binning the detected bursts into a 2D E*/S histogram where sub-populations are separated according to their S-values. E*- and S-distributions were fitted using a Gaussian function, yielding the mean values μ i of the distribution and an associated standard deviations w i . Experimental values for E* and S were corrected for background, spectral crosstalk (proximity ratio E PR ) and gamma factor resulting in histograms of accurate FRET E and corrected S according to published procedures 48 . Data analysis to retrieve distance R 1 (PIFE-ruler) All data were corrected against background and spectral crosstalk to yield E PR and S(E PR ). To determine the induced enhancement introduced by the change in Cy3 cis/trans isomerization monility either by viscosity (glycerol; Fig. 3 ) or by steric hindrance (caused by a binding protein close-by), the mean value of stoichiometry S(E Pr ) of the free DNA was determined via 2D-Gaussian fitting of the 2D E Pr -S(E Pr )-histogram. DNA in the presence of a DNA-binding protein was fitted with two independent 2D Gaussian population, where one population – the unbound species – was approximated with constant values obtained for the free DNA species before. The observed PIFE enhancement was represented as difference in Stoichiometry S(E Pr ). The PIFE enhancement factor ρ that reports on the PIFE effect decoupled from S changes caused by pure E changes (without PIFE) was retrieved from an advanced model as described in ref. 51 . In brief, this model allows for the retrieval of the amount by which the excited-state trans / cis isomerization of Cy3 is slowed down (the fold decrease in cis / trans isomerization mobility). Data analysis to retrieve distance R 2 (FRET-ruler) in the presence of PIFE All data was corrected against background and spectral crosstalk. At first the γ Cy3(B) for all free DNAs was determined and free DNA’s data was corrected until accurate FRET E. For this, all data needs to be corrected against background and spectral crosstalk. For both FRET pairs the individual gamma factors, γ Cy3(B) were determined, and each population was corrected with it obtaining accurate FRET E. In a second step, the gamma factor for the protein bound species γ Cy3(B)/protein is determined, and each population within the data set is corrected with its own individual γ Cy3(B)/protein and γ Cy3(B)/free. This is achieved by assigning each burst of the uncorrected data at the beginning to either the free or bound DNA subpopulation (see next paragraph). This is followed by a selective accurate FRET correction for each subpopulation. After this correction step all determined R 0 -corrected FRET values for the free and bound Cy3-dsDNA are converted onto the R 0 -axis of the environmentally insensitive Cy3B by applying Eq. 2 burst-wise. The mean R 0 -corrected FRET value E R0 is determined by 2D-Gaussian fitting of the E R0 -S-histogram. FRET values of converted-Cy3 and Cy3B should be identical within errors at this correction stage. As convention, we transformed all presented R 0 -corrected FRET values onto the unaltered R 0 -axis of the free Cy3B-labeled DNA in this manuscript. Population assignment In order to correct individual populations with different correction factors, as gamma factors, within one 2D ALEX histogram, every burst needs to be assigned to a particular population. This can be achieved via cluster analysis methods or probability distribution analysis 119 . In our implementation, every population in the uncorrected 2D histogram is first fitted with a covariant bivariate Gaussian function where the population is described by an amplitude A , its mean values μ i and standard deviations w i in FRET E* and Stoichiometry S. ρ denotes the correlation coefficient between E* and S. We express the probability that a given burst in the 2D histogram belongs to population by For every bin in the 2D histogram, the algorithm calculates the number of bursts belonging to population i by , where n is the number of burst in one bin. E and S are taken to be the bin centre. The corresponding bursts are assigned to a particular population i and kept through out the data analysis process.
📊 Figures
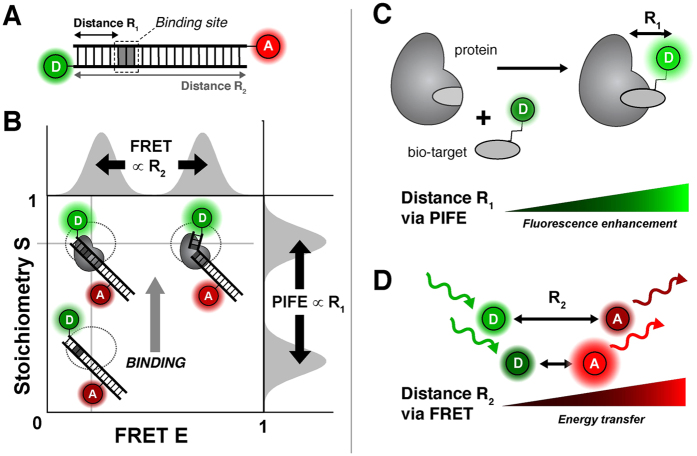
Figure 1
Working principle of ALEX-based PIFE-FRET.
(A) Possible labelling scheme for PIFE-FRET experiments: a dsDNA template is labelled with FRET donor D and acceptor A and contains a binding site for a protein. (B) Read out of PIFE and FRET distance...
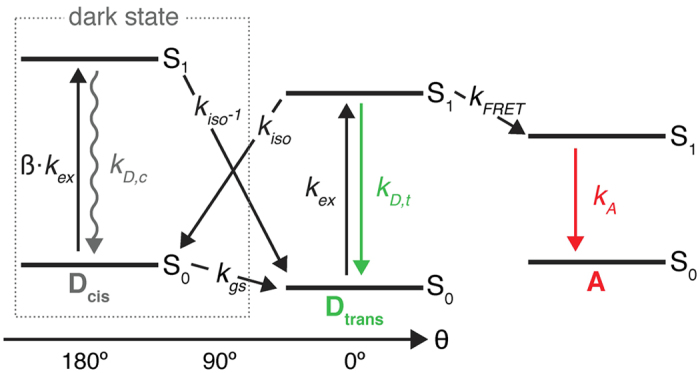
Figure 2
Jablonski diagram of Cy3 in the presence of a FRET acceptor.
After excitation ( k ex ) to the excited trans isomer (D trans ), three competing pathways deplete the excited state S 1 : (a) k D , T which is the sum of radiative and non-radiative decay rates from ...
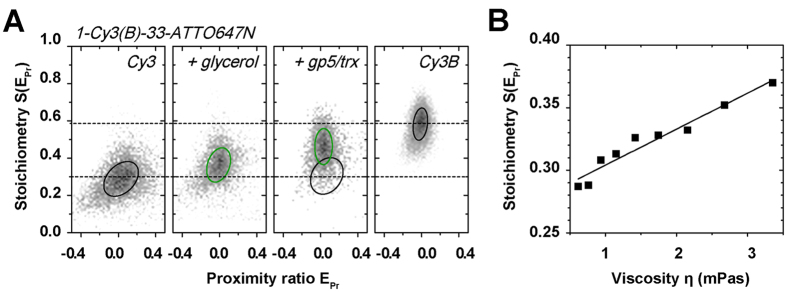
Figure 3
Observing the PIFE effect in ALEX histograms.
(A) Cy3-ATTO647N, Cy3-ATTO647N with 40% glycerol, Cy3-ATTO647N in the presence of 30 nM T7 polymerase gp5/trx and Cy3B-ATTO647N. 2D Gaussian fitting was applied to characterize the observed population...
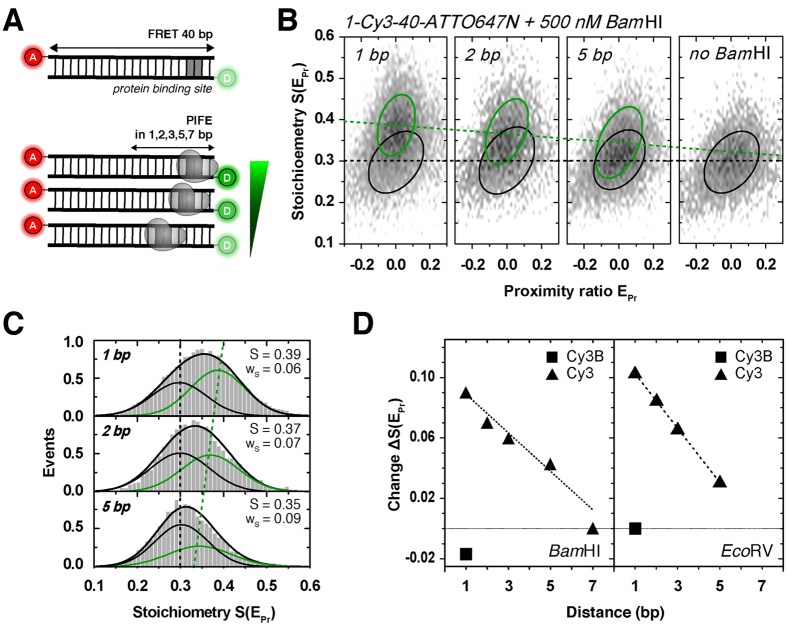
Figure 4
The PIFE ruler in ALEX.
(A) Schematic of a dsDNA template containing a protein binding site of the restriction enzymes Bam HI and Eco RV positioned in R 1 =u20091, 2, 3, 5 and 7u2009bp distance from donor fluorophore Cy3. Th...
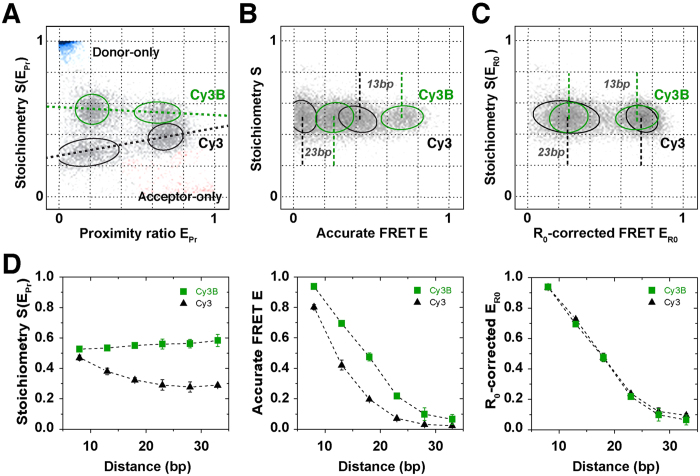
Figure 5
Validation of the PIFE-FRET correction procedure in ALEX ( A ) Data correction process, to obtain R 0 -corrected 2D-histograms. Four dsDNAs with identical sequence ( Fig. S4A ) are labelled with two d...
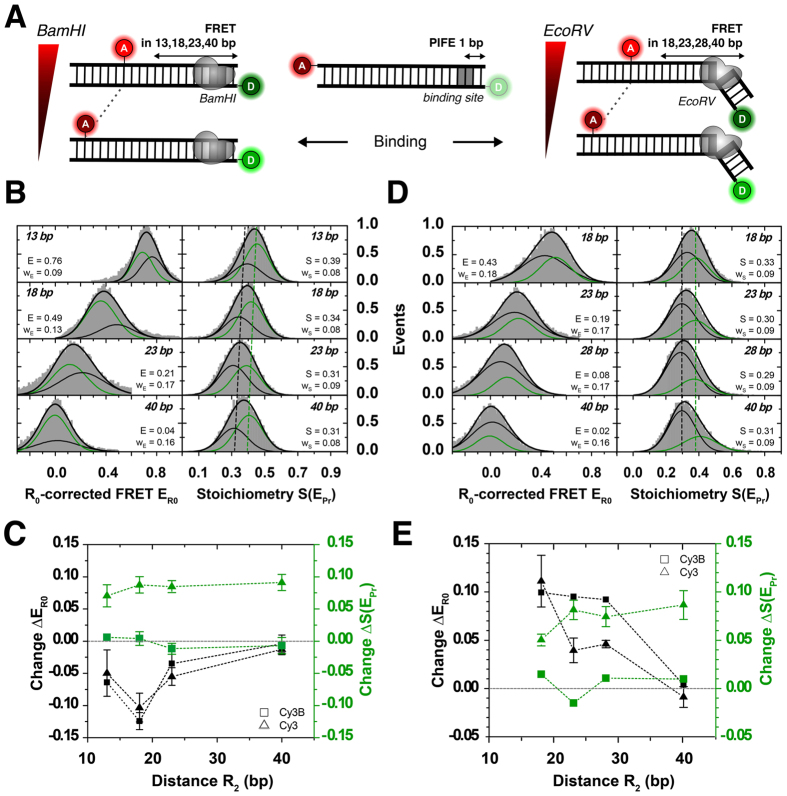
Figure 6
Distance changes determined via FRET in the presence of PIFE.
FRET between Cy3/ATTO647N attached to a 40u2009bp-dsDNA is probed simultaneously to PIFE that occurred between Cy3 and different restriction enzymes in R 1 =u20091u2009bp distance to the donor. (A) Sc...
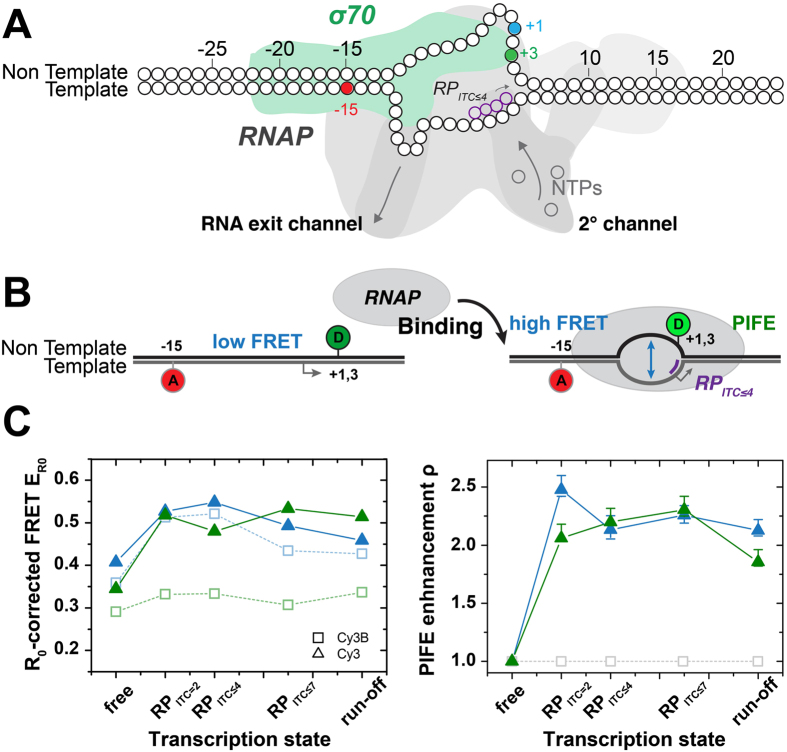
Figure 7
Mapping the proximity of the scrunched transcription bubble with RNAP.
( A ) Labelling scheme. The acceptor ATTO647N is positioned on the template strand at register (u221215). The donor Cy3(B) is placed on the non-template strand at register (+1) (cyan) or (+3) (green)....
Figure images are served from the NIH/NLM PubMed Central Open Access Subset or Europe PMC; copyright remains with the publishers and authors.
💬 Discussion
0 commentsNo comments yet. Be the first to start a discussion!
Leave a Comment