Abstract
Abstract Collective behavior in cellular populations is coordinated by biochemical signaling networks within individual cells. Connecting the dynamics of these intracellular networks to the population phenomena they control poses a considerable challenge because of network complexity and our limited knowledge of kinetic parameters. However, from physical systems, we know that behavioral changes in the individual constituents of a collectively behaving system occur in a limited number of well‐defined classes, and these can be described using simple models. Here, we apply such an approach to the emergence of collective oscillations in cellular populations of the social amoeba Dictyostelium discoideum . Through direct tests of our model with quantitative in vivo measurements of single‐cell and population signaling dynamics, we show how a simple model can effectively describe a complex molecular signaling network at multiple size and temporal scales. The model predicts novel noise‐driven single‐cell and population‐level signaling phenomena that we then experimentally observe. Our results suggest that like physical systems, collective behavior in biology may be universal and described using simple mathematical models.
🔬 Techniques
🧬 Organisms
💻 Software
✨ Fluorophores
🧪 Sample Preparation
🏭 Microscope Brands
🧪 Reagent Suppliers
📷 Detectors
💻 Software Details
🏛️ Research Organizations (ROR)
Affiliated research institutions:
📋 Methods
Cell culture, preparation, and genetic manipulation Axenic Dictyostelium discoideum cell lines expressing Epac1camps (AX4 background, gift of Dr. Satoshi Sawai), Epac1camps and mRFPmars (AX4 background), ECFP, and EYFP (both AX3 background, gifts of Dr. Carole Parent) were grown according to standard protocols (Fey et al , 2007 ). Briefly, vegetative cells were grown at 22°C while shaking at 180 rpm in PS medium consisting of 1.0% special peptone (Oxoid), 0.7% yeast extract (Oxoid), 1.5% D-glucose, 0.14% KH 2 PO 4 , 0.012% Na 2 HPO 4 -7H 2 O, 40 ng/ml vitamin B12, 80 ng/ml folic acid, and 1× antibiotic-antimycotic mix (Gibco) supplemented with 5 μg/ml (EYFP/AX3), 10 μg/ml (Epac1camps/AX4), or 20 μg/ml (ECFP/AX3) G418. Vegetative cells were washed and shaken at 1–2 × 10 7 cells/ml in development buffer (10 mM K/Na 2 phosphate buffer, 2 mM MgSO 4 , and 200 μM CaCl 2 , pH 6.5) for 4–5 h prior to experiments. The expression vector pBSRH-mars, which permits constitutive expression of mRFPmars in Dictyostelium discoideum under control of the act15 promoter, was kindly provided by Dr. Robert Cooper. The Epac1camps strain was transformed with pBSRH-mars by electroporation following a standard protocol (Gaudet et al , 2007 ), and a clone was selected based on fluorescence intensity. Fluorescence intensity of mRFPmars appears uniform in the cytosol. Microfluidic device fabrication Microfluidic devices for both single-cell and population experiments were fabricated using standard photolithography techniques to generate silicon masters and standard poly(dimethylsiloxane) (PDMS) replica molding techniques to generate the final devices. For the single-cell experiments, devices with two different feature heights were required to mix the cAMP to provide temporally complex input stimuli ( Supplementary Fig S2A ) (Stroock et al , 2002 ), and for these silicon masters, we used two-step photolithography (Anderson et al , 2000 ). Briefly, to create the main cell channel, an initial (160 μm thick) layer of SU-8 photoresist was spin coated, exposed to UV light, and developed on a silicon wafer. Subsequently, a second (15 μm thick) layer of photoresist was spun on top of this layer, the first layer features aligned to the mask for this second layer, exposed, and developed. For the population experiments, a 0.8-mm-tall aluminum Y-channel master was machined with 2-mm-wide and 6.5-mm-long input channels and a 3-mm-wide and 19-mm-long cell area. For both microfluidic devices, the microchannels were formed out of poly(dimethylsiloxane) (PDMS) via replica molding. Specifically, a 10:1 ratio of PDMS pre-polymer to catalyst was poured on top of the master of interest, baked for 50 min at 65°C, and then cut to size and removed from the master. Access holes for tubing were created using a 1.5-mm biopsy punch prior to plasma bonding the slabs to glass coverslips. Devices were then baked for at least 1 h at 65°C to aid in restoring a hydrophobic surface to the PDMS.
Show full methods section
Cell culture, preparation, and genetic manipulation Axenic Dictyostelium discoideum cell lines expressing Epac1camps (AX4 background, gift of Dr. Satoshi Sawai), Epac1camps and mRFPmars (AX4 background), ECFP, and EYFP (both AX3 background, gifts of Dr. Carole Parent) were grown according to standard protocols (Fey et al , 2007 ). Briefly, vegetative cells were grown at 22°C while shaking at 180 rpm in PS medium consisting of 1.0% special peptone (Oxoid), 0.7% yeast extract (Oxoid), 1.5% D-glucose, 0.14% KH 2 PO 4 , 0.012% Na 2 HPO 4 -7H 2 O, 40 ng/ml vitamin B12, 80 ng/ml folic acid, and 1× antibiotic-antimycotic mix (Gibco) supplemented with 5 μg/ml (EYFP/AX3), 10 μg/ml (Epac1camps/AX4), or 20 μg/ml (ECFP/AX3) G418. Vegetative cells were washed and shaken at 1–2 × 10 7 cells/ml in development buffer (10 mM K/Na 2 phosphate buffer, 2 mM MgSO 4 , and 200 μM CaCl 2 , pH 6.5) for 4–5 h prior to experiments. The expression vector pBSRH-mars, which permits constitutive expression of mRFPmars in Dictyostelium discoideum under control of the act15 promoter, was kindly provided by Dr. Robert Cooper. The Epac1camps strain was transformed with pBSRH-mars by electroporation following a standard protocol (Gaudet et al , 2007 ), and a clone was selected based on fluorescence intensity. Fluorescence intensity of mRFPmars appears uniform in the cytosol. Microfluidic device fabrication Microfluidic devices for both single-cell and population experiments were fabricated using standard photolithography techniques to generate silicon masters and standard poly(dimethylsiloxane) (PDMS) replica molding techniques to generate the final devices. For the single-cell experiments, devices with two different feature heights were required to mix the cAMP to provide temporally complex input stimuli ( Supplementary Fig S2A ) (Stroock et al , 2002 ), and for these silicon masters, we used two-step photolithography (Anderson et al , 2000 ). Briefly, to create the main cell channel, an initial (160 μm thick) layer of SU-8 photoresist was spin coated, exposed to UV light, and developed on a silicon wafer. Subsequently, a second (15 μm thick) layer of photoresist was spun on top of this layer, the first layer features aligned to the mask for this second layer, exposed, and developed. For the population experiments, a 0.8-mm-tall aluminum Y-channel master was machined with 2-mm-wide and 6.5-mm-long input channels and a 3-mm-wide and 19-mm-long cell area. For both microfluidic devices, the microchannels were formed out of poly(dimethylsiloxane) (PDMS) via replica molding. Specifically, a 10:1 ratio of PDMS pre-polymer to catalyst was poured on top of the master of interest, baked for 50 min at 65°C, and then cut to size and removed from the master. Access holes for tubing were created using a 1.5-mm biopsy punch prior to plasma bonding the slabs to glass coverslips. Devices were then baked for at least 1 h at 65°C to aid in restoring a hydrophobic surface to the PDMS.
Cell perfusion and cAMP stimulation
For experiments, vegetative cells were harvested at 1.5–3 × 10 6 cells/ml, washed, and shaken at 1–2 × 10 7 cells/ml in developmental buffer for 4–5 h before plating inside a microfluidic device. Single-cell microfluidic devices were seeded with 2,000–4,000 cells, and cells were permitted to adhere to the glass for 10 min before a constant flow rate of 4 μl/min was initiated using syringe pumps (Fusion Touch 200, Chemyx). Population devices were seeded with cells to the desired coverage and allowed to rest for 10 min before initiating flow of 10–100 μl/min and imaging 2 mm from the population edge. Macrofluidic dishes were seeded with 0.01 ML (1 ML = 6,600 cells/mm 2 ) of cells and allowed to rest for 10 min before initiating flow of 1 ml/min. Cells were maintained at 22°C throughout imaging, and experiments were limited to 130 min to mitigate any potential adverse effects of longer-term perfusion and ensure all cells are in the same developmental stage when a single cAMP receptor is the predominant receptor activating the signaling pathway (Insall et al , 1994 ). For experiments where single-cell cytosolic cAMP traces were taken from a population, 15–20% Epac1camps- and mRFPmars-expressing cells were mixed in the population to facilitate single-cell tracking. Single cells in microfluidic chips have a higher initial average response than those in macrofluidic dishes ( Supplementary Fig S2B and C ) as the transition from 0 to the stimulus concentration of cAMP in microfluidic chips is sharp, whereas in macrofluidic dishes, chaotic mixing of the cAMP with buffer leads to a more gradual transition.
Image acquisition
Cells were observed using an inverted epifluorescence microscope (TE300, Nikon) equipped with a Xenon lamp, automated excitation and emission filter wheels (Ludl), automated stage (Ludl), and oil immersion objectives (20× UPlanSApo NA 0.85, Olympus and 60× Plan Apo NA 1.40, Nikon). For FRET measurements, three fluorescent images were taken at each time point and are described using the following notation: where F is the fluorescence intensity, and the cell line is the line expressing the donor fluorophore only (D, here ECFP), the acceptor fluorophore only (A, here EYFP), or the epac1camps complex (EPAC). The excitation wavelength filter ranges are 436/20 nm for D and 500/20 nm for A, and the emission filter ranges are 470/24 nm for D and 535/30 nm for A (ET series filters, Chroma). A dichroic long-pass filter (T455LP, Chroma) further separated ECFP excitation from emission fluorescence during imaging. Images were captured using a back-illuminated Electron Multiplying CCD (EMCCD) camera (iXon + 897, Andor) with a depth of 16 bits, 256 × 256 resolution, and 1,000× gain. To minimize photodamage, exposure times were limited to 80 ms at 20× magnification and 20 ms at 60× magnification, an ND8 filter was in the emission path, and each field of view was imaged every 15 s. Acquisition was controlled using a custom Java plugin in Micro-Manager (Edelstein et al , 2010 ) that continually centered the cell of interest in single-cell experiments and maintained focus at the plane of interest.
Data analysis
Image analysis was performed using custom MATLAB (MathWorks) routines. Images were binarized, and for single-cell data, single-cell masks were generated by thresholding each fluorescent cell against its local background. For single cells to be considered the same cell between frames, the current cell location must overlap with the previous cell location and have an area change no greater than 33% to ensure they are remaining in contact with the coverslip. After masking, the image intensities were averaged across each cell at each time point to reduce noise. To calculate changes in the FRET efficiency, we used the E f DA /γ -based FRET method (Salonikidis et al , 2008 ). Briefly, E is the FRET efficiency, f DA is the fraction of Epac1camps complexes in their bound states, and γ is the relative donor/acceptor extinction. This method improves on the traditional ratiometric FRET method, which uses as a readout of FRET efficiency, by correcting for any photobleaching that occurs during long experiments. Furthermore, this method is independent of pH changes unlike the ratiometric method (Salonikidis et al , 2008 ), meaning that any cytosolic pH changes that may occur do not affect our readout of the FRET efficiency. To find E f DA /γ , we use the formula: 6 where , the relative acceptor fluorescence signal, and , the donor bleedthrough. On our imaging setup, α = 0.054 and β = 0.906. As Epac1camps is in a low FRET configuration when bound to cAMP and a high FRET configuration when unbound, we use − E f DA /γ as our FRET intensity here. All single-cell and population average FRET intensities are normalized to the baseline levels observed for either the single cell or the population at the beginning of each experiment prior to stimulation (individual cells) or synchronization (population). FRET signal units are defined as the change in − E f DA / γ where E is the FRET efficiency, f DA is the fraction of Epac1camps complexes in their bound states, and γ is the relative donor/acceptor extinction and 0 is defined as the baseline value of − E f DA / γ for the experiment when cells are in cAMP-free buffer. In our analysis of single cells, the accommodation spike width was defined as the time from the initial rise in cytosolic cAMP after the onset of stimulus to the time where the cytosolic cAMP returned to the baseline cAMP level before rising again for an oscillation or staying at the baseline. The mean oscillation time for single cells was calculated for each concentration by taking the mean of the peak period in Fourier transforms of individual oscillating cell traces, with error calculated through bootstrapping. Entrainment quality for single cells was defined as the mean Pearson correlation coefficient between the intracellular cAMP response to the first pulse of external cAMP and subsequent intracellular cAMP responses to each subsequent pulse of extracellular cAMP. For single-cell analysis of spike width and entrainment quality, cells with clear spikes 0.25 FRET signal units or greater in height were analyzed. When analyzing population average firing rates, spikes were required to be 0.3 FRET signal units in height to be counted as a population spike.
Simulations
Simulations were done using the Euler–Maruyama method (Kloeden & Platen, 1992 ) with a time step Δ t = 0.005 and started with random initial conditions. For phase diagram calculations, longer equilibration periods were used to eliminate the effect of the initial conditions. Spikes were defined as peaks in activator with values above zero, and rates were calculated by counting these spikes divided by simulation time. Parameters used for all simulations throughout the entire manuscript (unless stated otherwise) are as follows: ∈ = 0.1 (ratio between the activator and repressor timescales) γ = 0.5 (repressor degradation rate) c 0 = 1.2 (steady state repressor value in the absence of external cAMP) σ = 0.15 (noise strength) N = 100 (number of “cells” in population simulations) a = 0.058 (cAMP response magnitude) α 0 = 800 (basal cAMP leakage rate) α PDE = 10 3 (basal PDE leakage rate) K d = 10 −5 (cAMP response threshold) S = 10 6 (firing cAMP release rate)
Supporting Information Supplementary Figure S1 Supplementary Figure S2 Supplementary Figure S3 Supplementary Figure S4 Supplementary Figure Legends Source Data for Supplementary Figure S1 Source Data for Supplementary Figure S2 Source Data for Supplementary Figure S4 Review Process File Source Data for Figure 1 Source Data for Figure 2 Source Data for Figure 3 Source Data for Figure 4 Source Data for Figure 5 Source Data for Figure 6 Source Data for Figure 7
📊 Figures
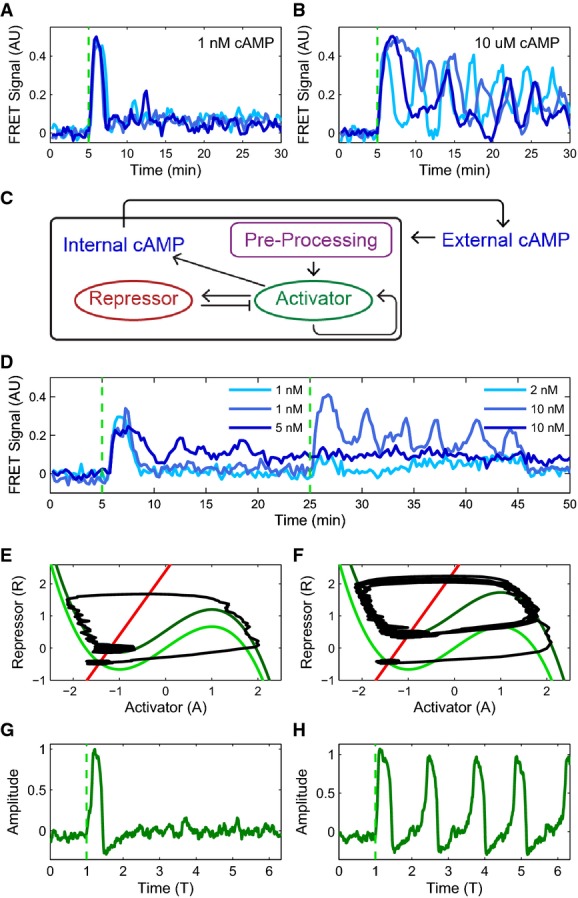
Figure 1
Modeling cytosolic cAMP responses to external cAMP stimuli in individual Dictyostelium cells Experimental observation of a bifurcation: cytosolic cAMP responses to an externally applied cAMP stimulus ...
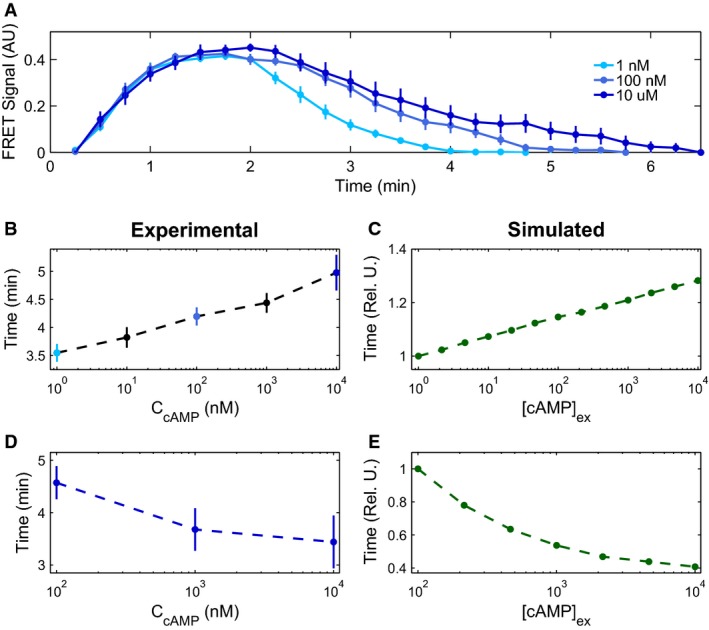
Figure 2
Phenomenological agreement between model and experiments Experimental mean accommodation spikes of cells in microfluidic devices for externally applied cAMP stimuli of 1u00a0nM (light blue), 100u00a0n...
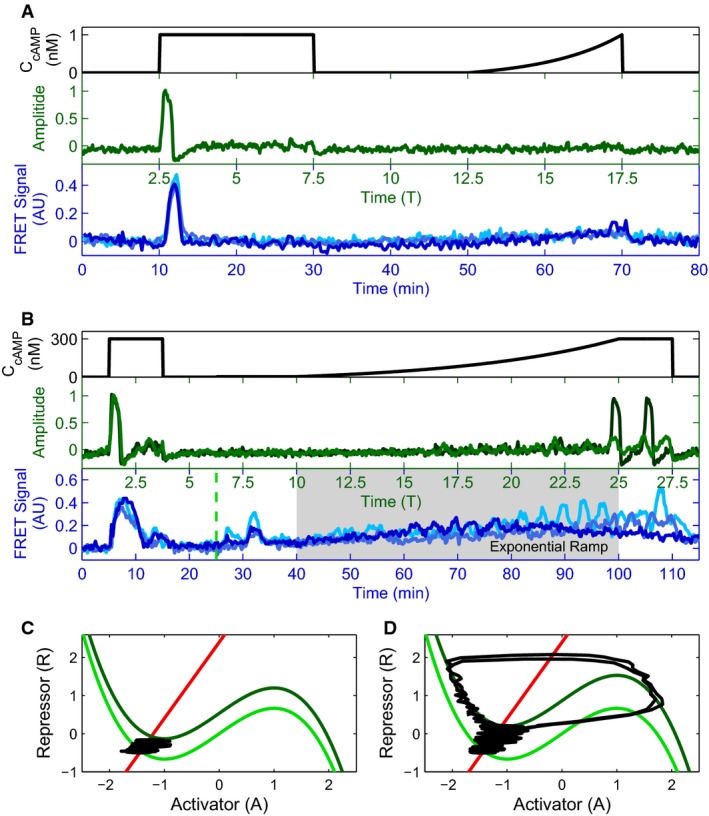
Figure 3
Cytosolic cAMP responses depend on the rate of externally applied cAMP Externally applied cAMP stimuli (black) with a step and an exponential ramp to a final height of 1u00a0nM cAMP (A), and with a sm...
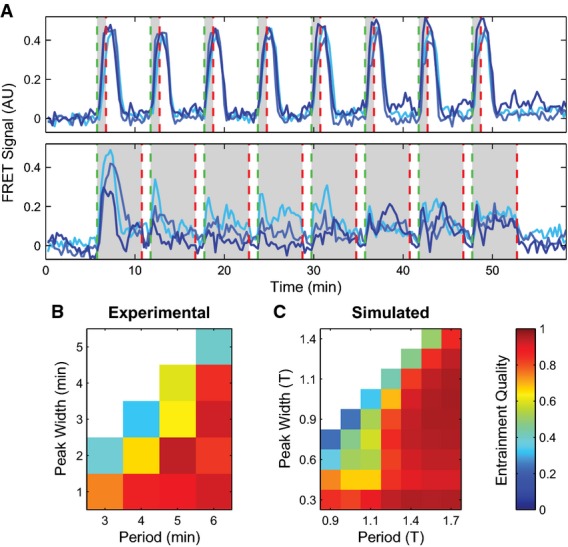
Figure 4
Cytosolic cAMP responses are entrainable to external cAMP stimuli and have a refractory period Cytosolic cAMP responses of single cells in microfluidic devices to externally applied 10 nM cAMP pulses ...

Figure 5
Multicellular model reproduces population behaviors in varying extracellular environments A phase diagram showing the coordinated population firing rate spanning a range of cell densities and flow rat...
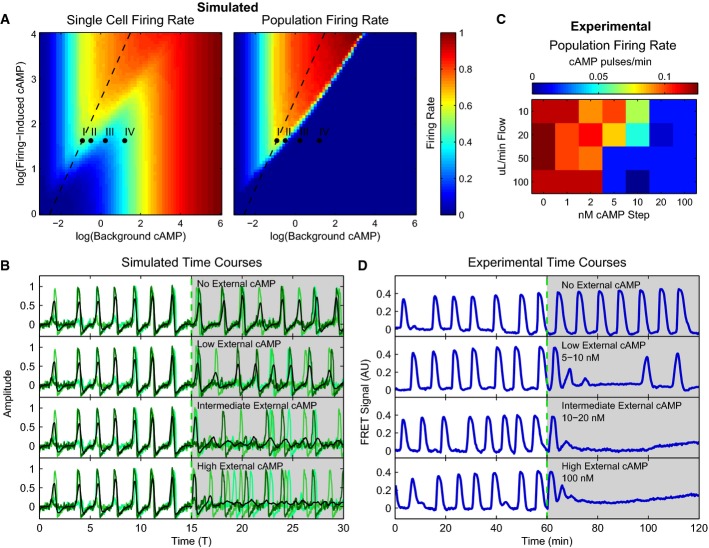
Figure 6
Population model predicts slowing and decoupling of intracellular cAMP oscillations in a population with increased external cAMP Firing rate phase diagrams for single cells in a population and the pop...
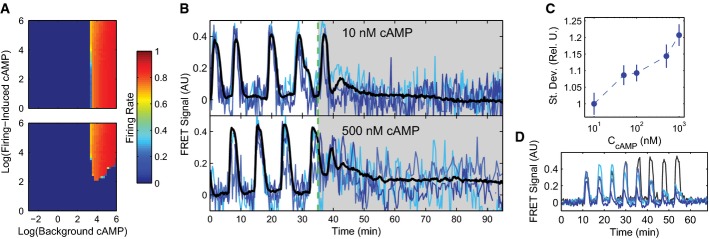
Figure 7
Intracellular noise in the cAMP circuit drives observed population behaviors Firing rate phase diagrams for single cells in a population (top) and the population as a whole (bottom) as predicted by th...
Figure images are served from the NIH/NLM PubMed Central Open Access Subset or Europe PMC; copyright remains with the publishers and authors.
💬 Discussion
0 commentsNo comments yet. Be the first to start a discussion!
Leave a Comment