Abstract
We propose a network representation of electrically coupled beta cells in islets of Langerhans. Beta cells are functionally connected on the basis of correlations between calcium dynamics of individual cells, obtained by means of confocal laser-scanning calcium imaging in islets from acute mouse pancreas tissue slices. Obtained functional networks are analyzed in the light of known structural and physiological properties of islets. Focusing on the temporal evolution of the network under stimulation with glucose, we show that the dynamics are more correlated under stimulation than under non-stimulated conditions and that the highest overall correlation, largely independent of Euclidean distances between cells, is observed in the activation and deactivation phases when cells are driven by the external stimulus. Moreover, we find that the range of interactions in networks during activity shows a clear dependence on the Euclidean distance, lending support to previous observations that beta cells are synchronized via calcium waves spreading throughout islets. Most interestingly, the functional connectivity patterns between beta cells exhibit small-world properties, suggesting that beta cells do not form a homogeneous geometric network but are connected in a functionally more efficient way. Presented results provide support for the existing knowledge of beta cell physiology from a network perspective and shed important new light on the functional organization of beta cell syncitia whose structural topology is probably not as trivial as believed so far.
🔬 Techniques
🔭 Microscopes
💻 Software
✨ Fluorophores
🧪 Sample Preparation
🔬 Cell Lines
🏭 Microscope Brands
🧪 Reagent Suppliers
🔴 Lasers
📷 Detectors
💻 Software Details
🏛️ Research Organizations (ROR)
Affiliated research institutions:
📋 Methods
Ethics statement
The study was carried out in accordance with all national and European recommendations pertaining to work with experimental animals, and all efforts were made to minimize suffering of animals. The protocol was approved by the Veterinary Administration of the Republic of Slovenia (permit number: 34401-61-2009/2).
Tissue slice preparation
Tissue slices (140 µm) were prepared from pancreata of 10–20 week old NMRI mice killed by cervical dislocation as described previously [43] . Throughout preparation and during slicing, the tissue was held in an ice-cold extracellular solution (ECS, consisting of (in mM) 125 NaCl, 26 NaHCO 3 , 6 glucose, 6 lactic acid, 3 myo-inositol, 2.5 KCl, 2 Na-pyruvate, 2 CaCl 2 , 1.25 NaH 2 PO 4 , 1 MgCl 2 , 0.5 ascorbic acid; ph 7.4) continuously bubbled with a gas mixture containing 5% CO 2 and 95% O 2 . Slices were collected in 30 ml of HEPES-buffered saline at room temperature (HBS, consisting of (in mM) 150 NaCl, 10 HEPES, 6 glucose, 5 KCl, 2 CaCl 2 , 1 MgCl 2 ; pH 7.4) before they were transferred to the dye-loading solution. All chemicals were obtained from Sigma-Aldrich (St. Louis, Missouri, USA) unless otherwise specified. 4–10 slices were simultaneously loaded with the dye in a Petri dish, exposed to ambient air, protected from light, and filled with 3.333 ml of HBS containing 6 µM Oregon Green 488 BAPTA-1 AM calcium dye (OGB-1, Invitrogen, Eugene, Oregon, USA), 0.03% Pluronic F-127 (w/v), and 0.12% dimethylsulphoxide (v/v) for 1 hour on an orbital shaker (40 turns/min) at room temperature. Uptake of OGB-1 was limited to the first two or three most superficial cell layers as described previously for pituitary slices [30] , [44] and isolated islets [35] , [45] . Several-fold differences in fluorescence intensity were observed between cells, most probably due to differences in viability, enzyme activity, loading, and variable extrusion of the dye. Different loading did not influence fluorescence time profiles. After staining and before measurements, the slices were kept protected from ambient light in 30 ml of fresh HBS for up to 12 hours at room temperature. HBS was exchanged every 2 hours. Individual slices were transferred to a temperature-controlled bath chamber (37°C, Luigs & Neumann, Ratingen, Germany) continuously perifused with bubbled (5% CO 2 , 95% O 2 ) ECS and used in imaging experiments.
Show full methods section
Ethics statement
The study was carried out in accordance with all national and European recommendations pertaining to work with experimental animals, and all efforts were made to minimize suffering of animals. The protocol was approved by the Veterinary Administration of the Republic of Slovenia (permit number: 34401-61-2009/2).
Tissue slice preparation
Tissue slices (140 µm) were prepared from pancreata of 10–20 week old NMRI mice killed by cervical dislocation as described previously [43] . Throughout preparation and during slicing, the tissue was held in an ice-cold extracellular solution (ECS, consisting of (in mM) 125 NaCl, 26 NaHCO 3 , 6 glucose, 6 lactic acid, 3 myo-inositol, 2.5 KCl, 2 Na-pyruvate, 2 CaCl 2 , 1.25 NaH 2 PO 4 , 1 MgCl 2 , 0.5 ascorbic acid; ph 7.4) continuously bubbled with a gas mixture containing 5% CO 2 and 95% O 2 . Slices were collected in 30 ml of HEPES-buffered saline at room temperature (HBS, consisting of (in mM) 150 NaCl, 10 HEPES, 6 glucose, 5 KCl, 2 CaCl 2 , 1 MgCl 2 ; pH 7.4) before they were transferred to the dye-loading solution. All chemicals were obtained from Sigma-Aldrich (St. Louis, Missouri, USA) unless otherwise specified. 4–10 slices were simultaneously loaded with the dye in a Petri dish, exposed to ambient air, protected from light, and filled with 3.333 ml of HBS containing 6 µM Oregon Green 488 BAPTA-1 AM calcium dye (OGB-1, Invitrogen, Eugene, Oregon, USA), 0.03% Pluronic F-127 (w/v), and 0.12% dimethylsulphoxide (v/v) for 1 hour on an orbital shaker (40 turns/min) at room temperature. Uptake of OGB-1 was limited to the first two or three most superficial cell layers as described previously for pituitary slices [30] , [44] and isolated islets [35] , [45] . Several-fold differences in fluorescence intensity were observed between cells, most probably due to differences in viability, enzyme activity, loading, and variable extrusion of the dye. Different loading did not influence fluorescence time profiles. After staining and before measurements, the slices were kept protected from ambient light in 30 ml of fresh HBS for up to 12 hours at room temperature. HBS was exchanged every 2 hours. Individual slices were transferred to a temperature-controlled bath chamber (37°C, Luigs & Neumann, Ratingen, Germany) continuously perifused with bubbled (5% CO 2 , 95% O 2 ) ECS and used in imaging experiments.
Calcium imaging
Imaging was performed on a Leica TCS SP5 AOBS Tandem II upright confocal system using a Leica HCX APO L water immersion objective (20×, NA 1.0). OGB-1 was excited by an argon 488 nm laser and fluorescence detected by Leica HyD hybrid detector in the range of 500–650 nm (all from Leica Microsystems GmbH, Wetzlar, Germany). 8-bit 512×512 pixels images were acquired at a frequency of 0.5 Hz. To avoid recording from cells at the potentially damaged cut surface, cells at 15 µm depth or more were imaged. Optical section thickness was 4 µm which gave a reasonable trade-off between satisfactory signal strength at lowest acceptable laser power (to avoid photobleaching and prolong the maximum time of recording) and the need to keep the section thickness as thin as possible to assure recording from a single cell only. Before and after recording each time series, a higher quality fluorescence image (1024×1024 pixels) was taken and used as a reference to assess motion artefacts and regions of interest (ROIs) during analysis. Calcium kinetics was measured off-line from ROIs and exported employing Leica Application Suite Advanced Fluorescence software (Leica Microsystems GmbH, Wetzlar, Germany). Further analysis was performed using custom-made scripts in MATLAB program (The MathWorks, Inc., Massachusetts, USA). Photobleaching was accounted for by a combination of linear and exponential fit. Traces were rejected if extensive motion artefacts were observed. The fluorescence signals of OGB-1 were expressed as F / F 0 ratios, F 0 representing the initial level of fluorescence and F the fluorescence signal recorded at individual time points during the experiment, respectively. Network construction Beta cells were distinguished from other cells on the basis of previous reports showing that cells within islets of Langerhans can reliably be identified by their type-specific calcium responses to stimulation with high glucose [46] – [48] . In cells identified as beta cells, intracellular concentration of calcium ([Ca 2+ ] i ) was low and rather stable under basal (6 mM) glucose. Upon stimulation with 12 mM glucose cells responded with a rapid increase in [Ca 2+ ] i , followed by a sustained plateau of elevated [Ca 2+ ] i with superimposed oscillations ( Figure 1B ). In different cells these oscillations had practically identical frequencies, but were slightly out of phase ( Figure 1C ). After the glucose was lowered back to 6 mM, [Ca 2+ ] i rapidly returned to the prestimulatory level. In further analyses, five different regimes will be considered: low glucose prior to stimulation (LG1), activation of beta cells (ON), high glucose regime (HG), deactivation of beta cells (OFF), and the low glucose after stimulation (LG2) ( Figure 1B ). Video S1 features responses of all cells in the islet. 10.1371/journal.pcbi.1002923.g001 Figure 1 Methodology used to extract functional connectivity patterns from cytosolic Ca 2+ traces. A Image of an islet of Langerhans showing the relative intensity of fluorescence signal during sustained activity (HG). Red circles indicate two cells, i and j , which we regard in continuation. B Temporal evolution of global calcium activity characterized by the mean-field of all beta cells in the islet. In the intervals 0≤ t ≤150 and 754≤ t ≤1960 cells were exposed to 6 mM glucose, whereas for 150≤ t ≤754 a stimulating concentration of glucose (12 mM) was applied. Arrows above the temporal trace denote five different dynamical regimes considered in this study: low glucose prior to stimulation (LG1) – 0≤ t
📊 Figures
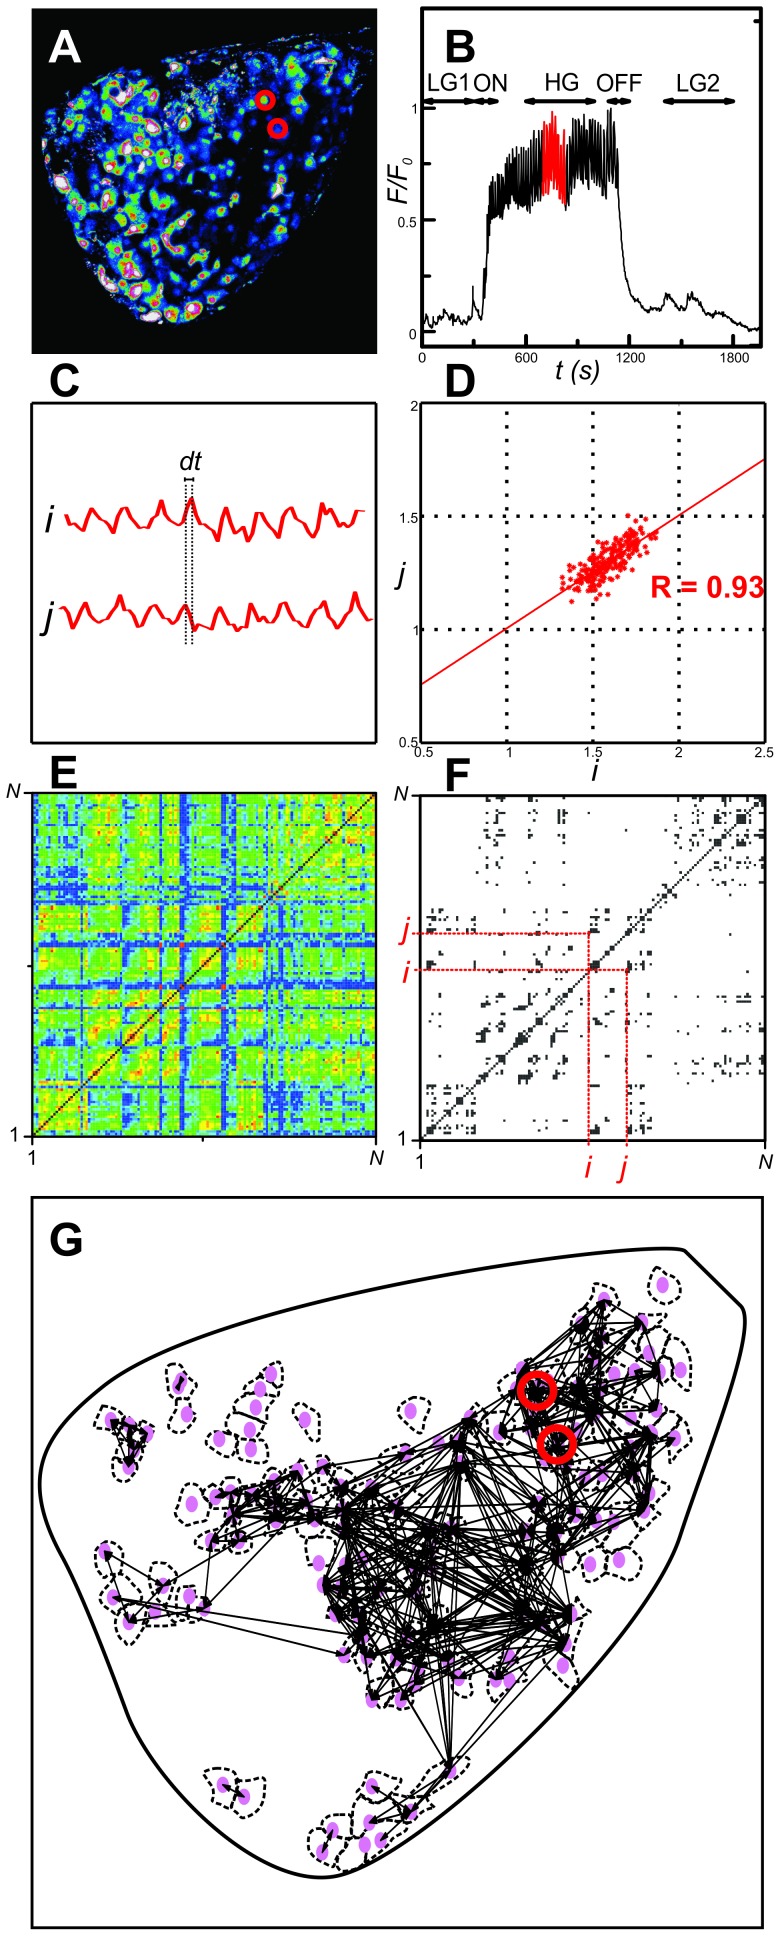
Figure 1
Methodology used to extract functional connectivity patterns from cytosolic Ca 2+ traces.
A Image of an islet of Langerhans showing the relative intensity of fluorescence signal during sustained activity (HG). Red circles indicate two cells, i and j , which we regard in continuation. B Tem...
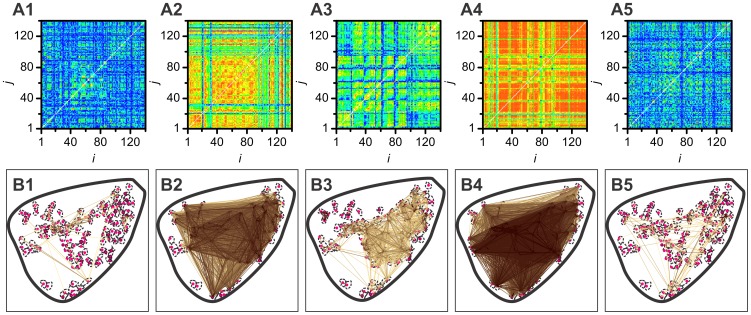
Figure 2
Correlation matrices R (upper row, images A1u2013A5) and network architectures (lower row, images B1u2013B5) for all regimes considered in this study.
Upper row: correlation matrices for low glucose before stimulation (A1), activation (A2), sustained activity in high glucose (A3), deactivation (A4), and low glucose after stimulation (A5). The color ...
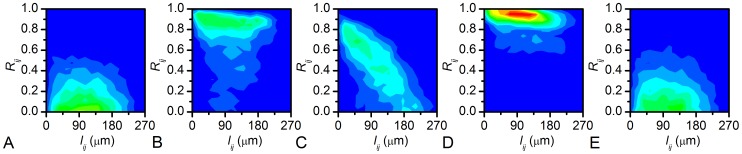
Figure 3
2D histograms showing the distribution of pairs of cells with regard to their Euclidean distance l ij and correlation coefficient R ij .
From left to right, histograms illustrating the distribution in low glucose before stimulation (A), during activation (B), during sustained activity in high glucose (C), during deactivation (D), and i...
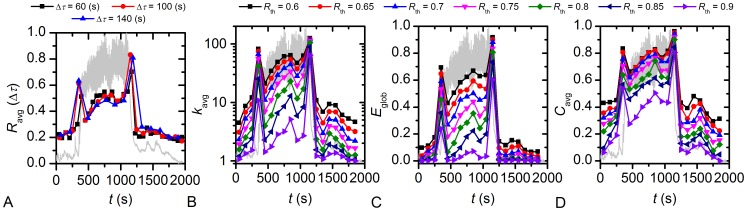
Figure 4
Temporal evolution of the average correlation coefficient, average degree, global network efficiency, and average clustering coefficient under stimulation with glucose.
In this figure, temporal changes of the average correlation coefficient (A), average degree (B), the global network efficiency (C) and the average clustering coefficient (D) are presented on a backgro...
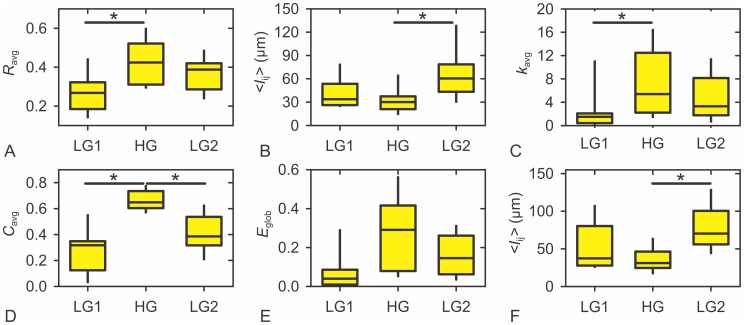
Figure 5
Characteristics of functional networks of beta cells in 9 islets of Langerhans for three of the five regimes analyzed.
A The average correlation coefficient. B The average physical distance between connected cells. C The average node degree. D The average clustering coefficient. E The global efficiency. F the average ...
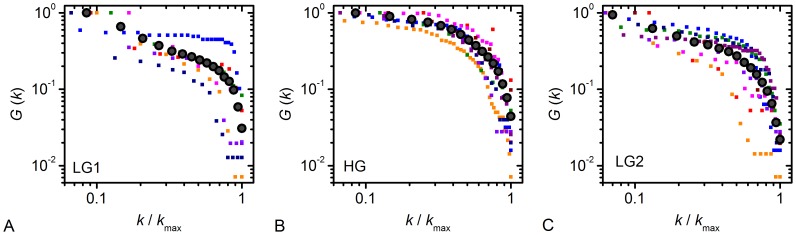
Figure 6
Cumulative degree distributions of functional networks for three of the five regimes analyzed.
Values obtained from all 9 islets are plotted in different colors and the larger black circles indicate their average for low glucose prior to stimulation (A), high glucose (B), and low glucose after ...
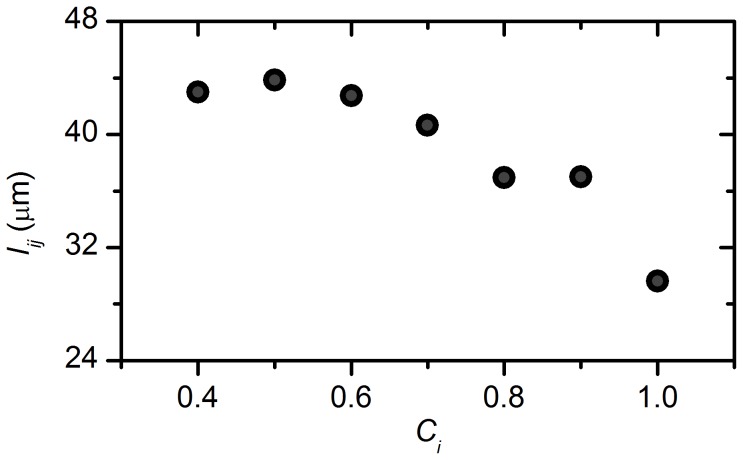
Figure 7
Average length of links as a function of the local clustering coefficient.
Plotted are the values obtained for the HG regime.
Figure images are served from the NIH/NLM PubMed Central Open Access Subset or Europe PMC; copyright remains with the publishers and authors.
💬 Discussion
0 commentsNo comments yet. Be the first to start a discussion!
Leave a Comment