Abstract
The HCN1-4 channel family is responsible for the hyperpolarization-activated cation current If/Ih that controls automaticity in cardiac and neuronal pacemaker cells. We present cryoelectron microscopy (cryo-EM) structures of HCN4 in the presence or absence of bound cAMP, displaying the pore domain in closed and open conformations. Analysis of cAMP-bound and -unbound structures sheds light on how ligand-induced transitions in the channel cytosolic portion mediate the effect of cAMP on channel gating and highlights the regulatory role of a Mg2+ coordination site formed between the C-linker and the S4-S5 linker. Comparison of open/closed pore states shows that the cytosolic gate opens through concerted movements of the S5 and S6 transmembrane helices. Furthermore, in combination with molecular dynamics analyses, the open pore structures provide insights into the mechanisms of K+/Na+ permeation. Our results contribute mechanistic understanding on HCN channel gating, cyclic nucleotide-dependent modulation, and ion permeation.
🔬 Techniques
💻 Software
✨ Fluorophores
🧪 Sample Preparation
🔬 Cell Lines
🏭 Microscope Brands
🧪 Reagent Suppliers
💻 Software Details
💻 Code & Software
💾 Data Repositories
🏛️ Research Organizations (ROR)
Affiliated research institutions:
📋 Methods
Key resources table REAGENT or RESOURCE SOURCE IDENTIFIER
Experimental models: Organisms/strains FreeStyle HEK293-F Cells Thermo Fisher Cat# R79007 HEK293T ATCC RRID: CRL-3216 Chemicals, peptides, and recombinant proteins Turbofect transfection reagent Thermo Fisher Cat# R0533 polyethyleneimine Polysciences Cat# 24765 protease inhibitor cocktail Roche Cat# 04693124001 DNase Sigma Cat# DN25 RNase Sigma Cat# R4875 PMSF Sigma Cat# P7626 LMNG Anatrace Cat# NG310 CHS Anatrace Cat# CH210 Amphipol A8-35 Anatrace Cat# A835 Adenosine 3′,5′-cyclophosphate Sigma Cat# A9501 Critical commercial assays QuikChange Lightning Site-Directed Mutagenesis Thermo Fisher Cat# 210518 Recombinant DNA plasmids pEGA: HCN4ΔC This paper N/A pEGA: HCN4ΔC (H407A, H553A) This paper N/A pCI:TRIP8b(1a-4) Porro et al., 2020 N/A pCI:rbHCN4 Porro et al., 2019 N/A pCI:rbHCN4 (H407A) This paper N/A pCI:rbHCN4 (H553A) This paper N/A pCI:rbHCN4 (E557A) This paper N/A pCI:rbHCN4 (H407A, H553A) This paper N/A pCI:rbHCN4 (H407A, H553A, E557A) This paper N/A pCI:hHCN1 Porro et al., 2019 N/A pCI:hHCN1 (E436A) This paper N/A pCI:mHCN2 Porro et al., 2019 N/A Deposited data CryoEM map of HCN4holo This paper EMDB: EMD-12513 CryoEM map of HCN4apo/LC This paper EMDB: EMD-12512 CryoEM map of HCN4apo/AM This paper EMDB: EMD-12466 Atomic model ofHCN4holo This paper PDB: 7NP4 Atomic model ofHCN4apo/LC This paper PDB: 7NP3 Atomic model ofHCN4apo/AM This paper PDB: 7NMN Software and algorithms RELION-3.0 Zivanov et al., 2018 https://www2.mrc-lmb.cam.ac.uk/relion/index.php/Main_Page CryoSPARC v.2 Punjani et al., 2017 https://cryosparc.com PHENIX Adams et al., 2010 https://phenix-online.org Coot Emsley et al., 2010 https://www2.mrc-lmb.cam.ac.uk/personal/pemsley/coot/ UCSF CHIMERA Pettersen et al., 2004 http://www.cgl.ucsf.edu/chimera MOLPROBITY Chen et al., 2010 http://molprobity.biochem.duke.edu/ HOLE Smart et al., 1996 http://www.holeprogram.org/ AutoDock 4.2.6 in conjunction with AutoDockTools 1.5.6 Morris et al., 2009 http://autodock.scripps.edu/ GROMACS 2019 Abraham et al., 2015 ; Van Der Spoel et al., 2005 https://manual.gromacs.org/documentation/2019/index.html# LINCS Hess et al., 1997 https://dblp.uni-trier.de/rec/journals/jcc/HessBBF97.html Biotite Kunzmann and Hamacher, 2018 https://github.com/biotite-dev/biotite Other Grids Quantifoil Three-hundred mesh holey gold R0.6/1 and R1.2/1.3 Resource availability Lead contact Further information and requests for resources and reagents should be directed to and will be fulfilled by the Lead Contact, Anna Moroni ( anna.moroni@unimi.it ).
Show full methods section
Key resources table REAGENT or RESOURCE SOURCE IDENTIFIER
Experimental models: Organisms/strains FreeStyle HEK293-F Cells Thermo Fisher Cat# R79007 HEK293T ATCC RRID: CRL-3216 Chemicals, peptides, and recombinant proteins Turbofect transfection reagent Thermo Fisher Cat# R0533 polyethyleneimine Polysciences Cat# 24765 protease inhibitor cocktail Roche Cat# 04693124001 DNase Sigma Cat# DN25 RNase Sigma Cat# R4875 PMSF Sigma Cat# P7626 LMNG Anatrace Cat# NG310 CHS Anatrace Cat# CH210 Amphipol A8-35 Anatrace Cat# A835 Adenosine 3′,5′-cyclophosphate Sigma Cat# A9501 Critical commercial assays QuikChange Lightning Site-Directed Mutagenesis Thermo Fisher Cat# 210518 Recombinant DNA plasmids pEGA: HCN4ΔC This paper N/A pEGA: HCN4ΔC (H407A, H553A) This paper N/A pCI:TRIP8b(1a-4) Porro et al., 2020 N/A pCI:rbHCN4 Porro et al., 2019 N/A pCI:rbHCN4 (H407A) This paper N/A pCI:rbHCN4 (H553A) This paper N/A pCI:rbHCN4 (E557A) This paper N/A pCI:rbHCN4 (H407A, H553A) This paper N/A pCI:rbHCN4 (H407A, H553A, E557A) This paper N/A pCI:hHCN1 Porro et al., 2019 N/A pCI:hHCN1 (E436A) This paper N/A pCI:mHCN2 Porro et al., 2019 N/A Deposited data CryoEM map of HCN4holo This paper EMDB: EMD-12513 CryoEM map of HCN4apo/LC This paper EMDB: EMD-12512 CryoEM map of HCN4apo/AM This paper EMDB: EMD-12466 Atomic model ofHCN4holo This paper PDB: 7NP4 Atomic model ofHCN4apo/LC This paper PDB: 7NP3 Atomic model ofHCN4apo/AM This paper PDB: 7NMN Software and algorithms RELION-3.0 Zivanov et al., 2018 https://www2.mrc-lmb.cam.ac.uk/relion/index.php/Main_Page CryoSPARC v.2 Punjani et al., 2017 https://cryosparc.com PHENIX Adams et al., 2010 https://phenix-online.org Coot Emsley et al., 2010 https://www2.mrc-lmb.cam.ac.uk/personal/pemsley/coot/ UCSF CHIMERA Pettersen et al., 2004 http://www.cgl.ucsf.edu/chimera MOLPROBITY Chen et al., 2010 http://molprobity.biochem.duke.edu/ HOLE Smart et al., 1996 http://www.holeprogram.org/ AutoDock 4.2.6 in conjunction with AutoDockTools 1.5.6 Morris et al., 2009 http://autodock.scripps.edu/ GROMACS 2019 Abraham et al., 2015 ; Van Der Spoel et al., 2005 https://manual.gromacs.org/documentation/2019/index.html# LINCS Hess et al., 1997 https://dblp.uni-trier.de/rec/journals/jcc/HessBBF97.html Biotite Kunzmann and Hamacher, 2018 https://github.com/biotite-dev/biotite Other Grids Quantifoil Three-hundred mesh holey gold R0.6/1 and R1.2/1.3 Resource availability Lead contact Further information and requests for resources and reagents should be directed to and will be fulfilled by the Lead Contact, Anna Moroni ( anna.moroni@unimi.it ).
Materials availability
All unique/stable reagents generated in this study are available from the Lead Contact without restriction.
Data and code availability
The cryo-EM density maps have been deposited in the Electron Microscopy Data Bank under the accession numbers: EMD-12466, EMD-12512, and EMD-12513. Coordinates have been deposited in the Protein Data Bank under the PDB accession numbers: 7NMN , 7NP3, and 7NP4.
Experimental model and subject details HEK293-T cells
(ATCC) were used for electrophysiology. Freestyle HEK293-F cell cultures (Thermo Fisher) were used for heterologous protein expression.
Method details Constructs
The cDNA encoding rabbit HCN4 (GenBank: NM_001082707 ) carrying an internal deletion (from residues 783 to 1064), hereafter HCN4ΔC, was cloned into a modified pEG BacMam vector ( Goehring et al., 2014 ) (hereafter pEGA) for large-scale protein purification from mammalian cells. The internal deletion eliminates a poorly conserved region in the C-terminal portion of the HCN channel protein, but preserves the extreme C-terminal SNL tripeptide sequence responsible for binding the auxiliary subunit TRIP8b ( Santoro et al., 2004 , 2011 ). The pEGA vector allows expression of the protein of interest with both eGFP and decahistidine tags at its N terminus. The tags can be cleaved using TEV enzyme, due to the presence of a TEV cleavage site between the tags and the protein of interest. For co-expression of HCN4 protein in the presence of TRIP8b, the cDNA encoding full-length mouse TRIP8b (splice variant 1a4) (GenBank: NM_001163516 ) was cloned into the pEGA vector and the HCN4ΔC cDNA into pCI vector (Promega Corporation). For whole-cell patch clamp analysis, the human HCN1 cDNA, the rabbit HCN4 cDNA and the mouse HCN2 cDNA were cloned into the pCDNA3.1 and in the pCI vector, respectively, as reported in Saponaro et al., 2018 . All mutations were generated by site-directed mutagenesis (QuikChange site-directed mutagenesis kit; Agilent Technologies) and confirmed by sequencing.
Electrophysiology and data analysis HEK293-T cells
(Invitrogen) were cultured as described ( Porro et al., 2019 , 2020 ) and transiently transfected either with HCN4, HCN1 or HCN2 wild-type or mutant channels (1μg per transfection) using Turbofect transfection reagent (Thermo Fisher) according to the manufacturer recommended protocol. When needed, GFP (cloned in pMAX vector) was cotransfected to identify successfully transfected cells. All the experiments were performed at room temperature (about 25°C). Currents were recorded in whole-cell configuration with an Axopatch 200B amplifier (Molecular Devices, CA, USA) or with an ePatch amplifier (Elements, Cesena, Italy); data acquired with the Axopatch 200B amplifier were digitized with an Axon Digidata 1550B (Molecular Devices, CA, USA) converter. All data were analyzed offline with Axon pClamp 10.7. Patch pipettes (3–6 MΩ) were filled with a solution containing: 10 mM NaCl, 130 mM KCl, 1 mM egtazic acid (EGTA), 0.5 mM MgCl 2 , 2 mM ATP (Magnesium salt) and 5 mM HEPES–KOH buffer (pH 7.2). The extracellular bath solution contained 110 mM NaCl, 30 mM KCl, 1.8 mM CaCl 2 , 0.5 mM MgCl 2 and 5 mM HEPES–KOH buffer (pH 7.4). The EDTA-containing pipette solution was prepared as follows: 60 mM EDTA-KOH, 20 mM KCl, 10 mM NaCl, 5 mM HEPES-NaOH buffer (pH 7.4). Where indicated, Adenosine 3′,5′-cyclic monophosphate (cAMP, Sigma-Aldrich) was added to the pipette solution from a previously prepared stock solution. For channel activation, hyperpolarizing steps were applied from a holding potential and current tails were measured upon return to a fixed voltage. The duration and the number of the steps used to activate the channels were adjusted for the different HCN isoform. For HCN1, holding potential was −20 mV (1 s), with steps from −20 mV to −120 mV (10 mV interval, 3.5 s) and tail currents recorded at −40 mV (3 s); for HCN4, holding potential was −20 mV (1 s), with steps from −30 mV to −165 mV (15 mV interval, 4.5 s) and tail currents were recorded at −40 mV (4.5 s); for HCN2, holding potential was −20 mV (1 s), with steps from −30 mV to −130 mV (10 mV interval, 4.5 s) and tail currents recorded at −40 mV (4.5 s). Mean activation curves were obtained by fitting maximal tail current amplitude, plotted against the voltage step applied, with the Boltzmann equation: y = 1 / [ 1 + exp ( ( V - V 1 / 2 ) / k ) where V is voltage, y the fractional activation, V 1/2 the half-activation voltage, and k the inverse-slope factor. Mean V 1/2 values were obtained by fitting individual curves from each cell to the Boltzmann equation and then averaging all the obtained values. Activation and deactivation time constants (τ) were obtained by fitting a single exponential function: I = I 0 exp ( - t / τ ) to current traces obtained with the activation protocol described above. Deactivation time constants were obtained by fitting tail currents collected at −40 mV after a fully activation pulse at −135 mV. Protein expression and membrane isolation Freestyle HEK293-F cell cultures (Thermo Fisher) were transiently transfected with pEGA: HCN4ΔC (1μg per ml) at a cell density of 2 × 10 6 cells per ml using polyethyleneimine (PEI) (Polysciences). The transfected cells were harvested by centrifugation after 48 hours of growth in shaker flasks at 37°C, 5% CO 2 . Cell pellets were resuspended in low salt buffer (10 mM KCl, 10 mM MgCl 2 , 10 mM HEPES pH 7.5, 0.5 mM PMSF, EDTA-free complete protease inhibitor cocktail (Roche) (1:1000), 20μg/mL DNase, and 10μg/mL RNase) and lysed by gentle homogenization in a glass homogenizer. Membranes were isolated by ultracentrifugation (40 min at 17000 xg), resuspended by homogenization and washed two times with high salt buffer: 1 M NaCl, 10 mM KCl, 10 mM MgCl 2 , 10 mM HEPES pH 7.5, 0.5 mM PMSF, EDTA-free complete protease inhibitor tablet, 20μg/mL DNase, 10μg/mL RNase. Isolated membranes were resuspended by homogenization in the storage buffer: 200 mM NaCl, 20 mM HEPES, pH 7.5, 0.5 mM PMSF, EDTA-free complete protease inhibitor cocktail (1:1000) and stored at −80°C until use. Protein purification in LMNG/CHS The isolated membranes were thawed on ice and solubilized by the addition of a mixture of detergents (lauryl maltose neopentyl glycol (LMNG) with cholesteryl hemisuccinate (CHS) in a 5 to 1 ratio) to a final concentration of 1% (w/v), and gently agitated for 2 hours at 4°C. The solution was cleared by ultracentrifugation (40 min at 1700 xg). Pre-equilibrated Ni 2+ -NTA resin (QIAGEN) was added to the sample, together with 10 mM imidazole and the mixture allowed to gently rotate overnight at 4°C. After transferring the mixture to a column, the resin was washed in two steps: 1) 5 column volumes of buffer containing 50 mM imidazole; 2) 5 column volumes of buffer containing 75 mM imidazole. The proteins were eluted with 10 column volumes of the following buffer: 200 mM NaCl, 20 mM HEPES, pH 7.5, 300 mM imidazole. The eluted protein was loaded on a Superose 6 increase 10/300 GL SEC column (GE Healthcare Life Sciences) pre-equilibrated with buffer containing 200 mM NaCl, 20 mM HEPES pH 7.0 and detergent (LMNG-CHS) at the concentration of 0.002% (w/v). For the protein sample used to solve the structure of HCN4 bound to cAMP, the ligand (Sigma-Aldrich) was kept at a concentration of 0.2 mM in all steps of membrane isolation and protein purification procedure described above. The decahistidine-eGFP tag at the N terminus of HCN4 protein was not removed. Final yield of purified protein was about 1mg per 1 l of cells. Protein purification in amphipols For purification in amphipols, HCN4 protein was obtained following co-expression and co-purification with the auxiliary subunit TRIP8b. This approach was chosen to prevent any cellular cAMP from occupying the CNBD ( Lolicato et al., 2011 ) due to the antagonistic nature of TRIP8b/cAMP binding ( Bankston et al., 2017 ; Gross et al., 2018 ; Hu et al., 2013 ; Saponaro et al., 2018 ). Although we were unable to detect signal for the TRIP8b protein upon cryo-EM image analysis, potentially due to loss of TRIP8b during vitrification and/or variability in the number of TRIP8b subunits associated with the channel, this approach did yield a near atomic-resolution structure of the HCN4 channel protein stabilized by amphipols in the cAMP-unbound conformation. Following co-transfection of pCI: HCN4ΔC (0.75μg per ml) and pEGA: TRIP8b (0.75μg per ml), membranes were isolated and the protein complex affinity purified with a Ni 2+ -NTA resin as described above. Proteins were then desalted by using PD-10 desalting columns (GE Healthcare) and reconstituted into amphipol A8-35 (Anatrace) at a protein: amphipol ratio of 1: 10 by weight. The protein – amphipol mixture was incubated for 4 hours with gentle rotation at 4°C. After 4 hours of incubation with amphipol, the detergent was removed by the addition of Bio-Beads (Bio-Rad) overnight at 4°C. The reconstituted protein was then loaded on a Superose 6 increase 10/300 GL SEC column pre-equilibrated in a buffer composed by 200 mM NaCl and 20 mM HEPES pH 7.0 without detergent in order to remove the excess of free amphipol and residual detergents. Final yield of purified HCN4ΔC in complex with GFP-TRIP8b was about 1mg per 1 l of cells. Cryo-EM sample preparation and image acquisition (LMNG/CHS) LMNG/CHS solubilized HCN4 alone (apo/LC) and in the presence 0.2 mM cAMP (holo) was concentrated to 0.5 and 0.6 mg ml -1 , respectively, using a 100 kDa concentrator (Amicon) and 3 μL of protein solution was applied to freshly plasma-cleaned (Gatan Solarus) 0.6/1 μm 300 mesh holey gold grids (Quantifoil UltrAuFoil) and blotted for 2.5 s at blot force 3 using a Vitrobot (FEI) operating at 22°C and > 90% humidity prior to being immediately plunged into liquid ethane to vitrify the sample. Images were acquired on a Titan Krios electron microscope (FEI) equipped with a K2 summit detector (Gatan) operating in counting mode with a calculated pixel size of 0.83 Å per pixel. Automated data collection was achieved with the Leginon software package ( Suloway et al., 2005 ). For HCN4 apo, 4465 exposure movies were collected with an estimated dose of 71.85 e - Å -2 for the 6 s exposure composed of 40 frames (150 ms per frame) using a defocus range of −1.1 to −2 μm. For HCN4 holo, 4478 exposure movies were obtained using the same exposure as HCN4 apo but with an estimated total dose of 67.88 e - Å -2 and a defocus range from −1 to −1.8 μm. Single-particle analysis (LMNG/CHS) For the HCN4 holo and apo/LC datasets, frame alignment was performed using the Relion 2.1 ( Kimanius et al., 2016 ; Scheres, 2012 ) implementation of MotionCor2 ( Zheng et al., 2017b ) with 3 by 3 patches and a B-factor of 150 and estimation of the contrast transfer function (CTF) was done for each micrograph using CTFFind4 ( Rohou and Grigorieff, 2015 ). Approximately 1500 particles were manually picked, extracted (binned by 4) and subjected to 2D classification in Relion to obtain templates for automated picking. Template picking runs were done in Relion using templates, low-pass filtered to 20 Å, which corresponded to top, bottom and side views resulting in 2,006,780 and 914,005 picked particles for holo and apo/LC, respectively. An additional template picking run using only side-view templates and a lower picking threshold was performed on the apo/LC dataset to obtain separate stack of 1,039,436 particles. All particles were extracted with a 68 pixel box at 3.32 Å per pixel and imported into CryoSPARC v.2 ( Punjani et al., 2017 ) for initial classification. The pyem script ( https://doi.org/10.5281/zenodo.3576630 ) was used for all conversions between Relion and CryoSPARC. Throughout the processing of these data we sought to determine if any deviations from C4 symmetry were present but ultimately did not observe any strong evidence. Therefore, unless specified differently, C4 symmetry was imposed for all reconstructions described below. For HCN4 holo, several rounds of 2D classification in CryoSPARC resulted in a cleaned stack of 252,458 particles which were moved back into Relion and extracted with recentered coordinates and an unbinned box size of 272 pixels and moved back into CryoSPARC where an ab-initio reconstruction without symmetry constraints produced a volume with apparent C4 symmetry. Several rounds of 3D classification (ab-initio into multiple classes and heterogeneous refinement) resulted in 170,263 particles and 4 Å map with streaking and smearing of density observed in the transmembrane domain (TMD). To improve the quality of the map in this region, particles were moved back to Relion where maps were reconstructed, and signal subtraction performed using a mask that removed the detergent micelle and the lower half of the cytosolic domains. Subsequent classification of the signal-subtracted particles was done in CryoSPARC to obtain a 3.4 Å reconstruction with much improved density in the TMD from 67,583 particles. The signal-subtracted particles were converted back to the original particles in Relion followed by Bayesian polishing prior to a final round of 3D classification and non-uniform refinement in CryoSPARC where 54,828 particles produced the final reconstruction at 3.2 Å resolution. For apo/LC, particles from the two template picking runs were initially processed independently using 2D and 3D classification in CryoSPARC resulting in cleaned particle stacks containing 132,630 and 120,030 particles from the template picking runs using templates with various orientations and only side view templates, respectively. The two particle stacks were merged in Relion and duplicate particles were removed by setting the minimum inter-particle distance to 50 pixels prior to unbinned extraction of recentered particles. This merged stack of 213,381 particles was imported back into CryoSPARC where an initial 3D refinement produced a 4 Å reconstruction that was used as an initial model for 4 rounds heterogeneous refinement with 3 to 5 classes. 85,512 particles from to the best classes from heterogeneous refinement were merged and a 3.5 Å reconstruction was obtained using non-uniform refinement. These particles were imported back into Relion where the volumes were reconstructed and CTF parameters refined. Following CTF refinement, 3D classification into 8 classes resulted in one class with 51,758 particles that contained the most structural features and cleanest density. These particles were imported into CryoSPARC where non-uniform refinement produced a 3.4 Å reconstruction. Finally, the particles were moved back into Relion for Bayesian polishing prior to non-uniform refinement in CryoSPARC to obtain the final map at 3.2 Å resolution. Cryo-EM sample preparation and image acquisition (amphipols) For cryo-EM, a 3.5 μL droplet of freshly purified sample, at final concentration of 0.3-0.7 mg/ml, was applied onto a UltrAu R1.2/1.3 300-mesh gold holey grid (Quantifoil), previously glow discharged for 30 s at 30mA using a GloQube system (Quorum Technologies). Following an incubation of 90 s at 4°C and 100% relative humidity, the grid was blotted for 2-5 s and plunge-frozen in liquid ethane using a Vitrobot Mk IV (Thermo Fischer Scientific). All data were acquired on a 200 kV Talos Arctica (Thermo Fischer Scientific) transmission electron microscope aligned to operate in parallel illumination. Cryo-EM data were acquired using EPU automated data collection software (Thermo Fischer Scientific). Images were collected at nominal magnification of 120,000 ×, corresponding to a pixel size of 0.889 Å/pixel at the specimen level, with an applied defocus values between −0.5 and −2.0 μm. Movies were acquired using Falcon 3EC direct electron detector (Thermo Fischer Scientific) operating in electron counting mode (0.5 e - /pix/sec) with a total exposure time of ∼61 s and a total accumulated dose of 40 e - /A 2 , equally distributed over 40 movie fractions (1 e - /A 2 per fraction). Single-particle analysis (amphipols) A total of 1,571 movies were collected, with frames aligned before summing in individual fractions within EPU software. Micrograph movies were imported in RELION-3.0 for all subsequent image processing tasks ( Zivanov et al., 2018 ). Prior to particle picking, all images were subjected to motion-correction and dose-weighting using MotionCor2 (version 1.2.1) ( Zheng et al., 2017b ).
Estimation of the contrast transfer function
(CTF) was performed on aligned, not weighted sum images using CTFFIND4 (version 4.1.10) ( Rohou and Grigorieff, 2015 ). Particles were automatically picked using Gautomatch (version 0.56) ( https://www.mrc-lmb.cam.ac.uk/kzhang/ ). Coordinates were then imported in RELION for visual inspection and manual removal of erroneously picked contaminants and aggregates. A total of 100,130 particles were initially normalized and extracted in RELION-3.0. Particles set was subjected to several rounds of reference-free 2D classification to remove junk particles. An initial 3D auto-refinement was performed using as reference a low-resolution 3D model obtained by negative staining EM, low-pass filtered at 40 Å. Subsequent rounds of 3D classification were performed imposing C4 symmetry to isolate particles best contributing to isotropic, near atomic-resolution reconstructions. A final dataset of 11,146 particles were selected and subjected to two rounds of CTF refinement, beam tilt correction and 3D auto-refinement followed by Bayesian polishing as implemented in RELION-3.0. A final 3D auto-refinement was performed on polished particles by applying a soft-edged and extended mask to a 15Å low-pass filtered reference map and enabling solvent-flattened FSC calculation. Refined 3D reconstructions were sharpened using RELION-3.0 standard post-processing procedure applying a soft-edge and extended solvent mask. Overall resolutions estimates were calculated from Fourier shell correlations at 0.143 (applied B-factor and estimated resolution listed in Table 1 ). Estimates of local resolutions were performed using RELION-3.0 local resolution tool. Model building, refinement and validation The initial model of HCN4 apo/AM was based on the HCN1 apo cryo-EM structure (PDB: 5U6O ) ( Lee and MacKinnon, 2017 ). The initial model was rigid body fitted into the cryo-EM reconstructions using UCSF CHIMERA ( Pettersen et al., 2004 ) and the resulting aligned model were subjected to real-space refinement using PHENIX ( Adams et al., 2010 ) before sequence adjustment and manual model building with COOT ( Emsley et al., 2010 ). Subsequent HCN4 apo/LC and HCN4 holo models were rigid body fitted with UCSF CHIMERA and real-space refinement with PHENIX using the previous HCN4 apo/AM coordinates as template. A polyalanine truncation and a subsequent rigid body refinement with non-crystallographic symmetry (NCS) restrains was carried out with each model to properly assess NCS using PHENIX. The full atomic models of HCN4 apo/AM, HCN4 apo/LC and HCN4 holo were subjected to multiple rounds of real-space refinement in PHENIX including global minimization and refinement of atomic displacement parameters, and applying secondary structures, Ramachandran and NCS restrains ( Afonine et al., 2018 ).
Thermal denaturation assay
GFP-HCN4ΔC protein was purified following the procedure described in the section “Protein purification in LMNG/CHS.” The buffer in which the protein was eluted from the SEC column contained 0.2 mM cAMP and 0.002% (w/v) LMNG-CHS which were kept present in all incubation buffers. The purified protein (3 μM) was maintained for 48 h at 4°C before being used for thermal denaturation assay. For Mg 2+ removal assay, GFP-HCN4ΔC was incubated 1h with 10 mM Ethylenediaminetetraacetic acid (EDTA, Sigma-Aldrich) pH 7. The buffer with EDTA was replaced by using PD-G25 desalting columns (GE Healthcare) with a buffer without EDTA +10 mM MgCl 2 . Aliquots of purified protein (5μg) were heated for 10 min over the following range of temperatures: 20, 30, 40, 50, 55, 60, 65, 70, 80°C. the samples were centrifuged (30 min, at 18000 xg) to remove precipitated protein and the supernatant was loaded on a Superose 6 increase 10/300 GL SEC column (GE Healthcare Life Sciences) pre-equilibrated with buffer containing 200 mM NaCl, 20 mM HEPES pH 7.0 and detergent (LMNG-CHS) at the concentration of 0.01% (w/v). Since we were following the emission signal (509 nm) of the excited GFP fused at the N terminus of HCN4ΔC, the SEC column was connected to a Prominence UFLC system (Shimadzu) fitted with an RF-10AXL fluorescence detector (Shimadzu). Thermal denaturation curves were obtained by measuring the height of the fluorescent SEC (fSEC) peak measured from samples at each of the different temperatures above reported. The height of the fSEC peak for sample incubated at 20°C was used as control for normalization. The thermal denaturation curves were fitted with a sigmoidal dose-response equation: Y = A 1 + ( A 2 − A 1 ) / ( 1 + 10 ∧ ( ( LOGx0 − x ) ∗ p ) ) where Y is the fluorescence emission in arbitrary units, A1 the minimal fluorescence (from the sample heated at 80°C), A2 the maximal fluorescence (from the sample heated at 20°C), LOGx0 the melting temperature (Tm), x a given temperature, and p is the Hill slope. Mean Tm values were obtained by fitting individual curves from each experiment to the Boltzmann equation and then averaging all the obtained values.
Pore Analysis
The pore radius was calculated with HOLE ( Smart et al., 1996 ) using Amber van-der-Waals radii.
Ivabradine docking
In-silico docking experiments were performed on HCN4 holo, apo/LC and apo/AM structures in the same manner (apo/LC and apo/AM yielding identical results). AutoDock 4.2.6 in conjunction with AutoDockTools 1.5.6 ( Morris et al., 2009 ) was used for preparation of proteins and ligands. Ligands were drawn and energy-minimized with Avogadro ( Hanwell et al., 2012 ) using the UFF force field ( Rappe et al., 1992 ). All bound ligands, detergents and water molecules were removed from protein structures prior to model preparation. Gasteiger charges were used. A cubic box with x = 4.725nm and a grid spacing of 0.0375nm was centered below the selectivity filter to include the central pore module and C-linker. 250 docking attempts with 2,500,000 evaluations were performed per protein-ligand system and clustered based on RMSD. The density of ivabradine was calculated from docked poses as 3d histogram over the atomic coordinates with a grid spacing of 0.1nm. Only bins with a count of at least 3 were considered.
Molecular dynamics simulations
Molecular dynamics simulations were performed using the PD (residues 412-523) of HCN4 holo, apo/LC and apo/AM structures embedded into a pre-equilibrated 1-palmitoyl-2-oleoyl-sn-glycero-3-phosphocholine (POPC) bilayer. Starting configurations were selected based on testing different variations in the initial positioning of the ions (either one or two K + /Na + inside the SF, with or without a separating water molecule) prior to production runs. Based on results from these preliminary trial runs, the following configurations were selected: For simulations in pure KCl solution, we placed two K + inside the SF at the height of binding sites a and c, separated by a single water molecule. For pure NaCl and mixed KCl:NaCl solutions, a single Na + ion was placed inside the SF at the height of the C479 carbonyl oxygen plane with two water molecules above and below, due to the fact that the two ion configuration was not stable. Short trial simulations were also performed to test a range of applied voltages and ion solution concentrations. To increase the rate of sampling of conduction events during production runs, we applied artificial electric fields of −500mV or −700mV ( Andersson et al., 2018 ; Köpfer et al., 2014 ; Stock et al., 2013 ). However, the same conduction mechanism was observed at hyperpolarizing voltages as low as −300mV and ion concentrations as low as 150 mV. Individual simulation conditions and the final composition of each system in the production runs are summarized in Table S3 (note that all production runs reported in Table S3 and described in Figure 6 were performed using HCN4 apo/LC). All simulations were carried out with GROMACS 2019 ( Abraham et al., 2015 ; Van Der Spoel et al., 2005 ) in conjunction with the Amber99sb ∗ -ILDN force field ( Best and Hummer, 2009 ; Lindorff-Larsen et al., 2010 ), the TIP3P water model ( Jorgensen et al., 1983 ), Berger-derived POPC lipids ( Cordomí et al., 2012 ) and ion parameters by Joung and Cheatham ( Joung and Cheatham, 2008 ). Van-der-Waals interactions were cut-off at 1nm and electrostatics were treated by PME ( Essmann et al., 1995 ) beyond 1nm. Temperature and Pressure were kept at 310K and 1bar using the V-Rescale Thermostat ( Bussi et al., 2007 ) and Parrinello-Rahman Barostat ( Parrinello and Rahman, 1981 ), respectively. All bonds were restraint using LINCS ( Hess et al., 1997 ) and hydrogen atoms were represented as virtual sites to allow for an integration time step of 4fs ( Feenstra et al., 1999 ). After system preparation, we performed 2000 steps energy minimization (steepest descent) and 20ns position-restrainted equilibration (F c = 1,000 kJ/mol/nm 2 ). Finally, restraints were gradually lifted over 3ns followed by 1,000-1,500 ns unrestrained simulation. A set of distance restraints were applied on the bottom half of the S6 helix to prevent the cytosolic gate from closing ( Kopec et al., 2018 ). Molecular dynamics trajectories were analyzed using GROMACS tools and Biotite ( Kunzmann and Hamacher, 2018 ).
Quantification and statistical analysis
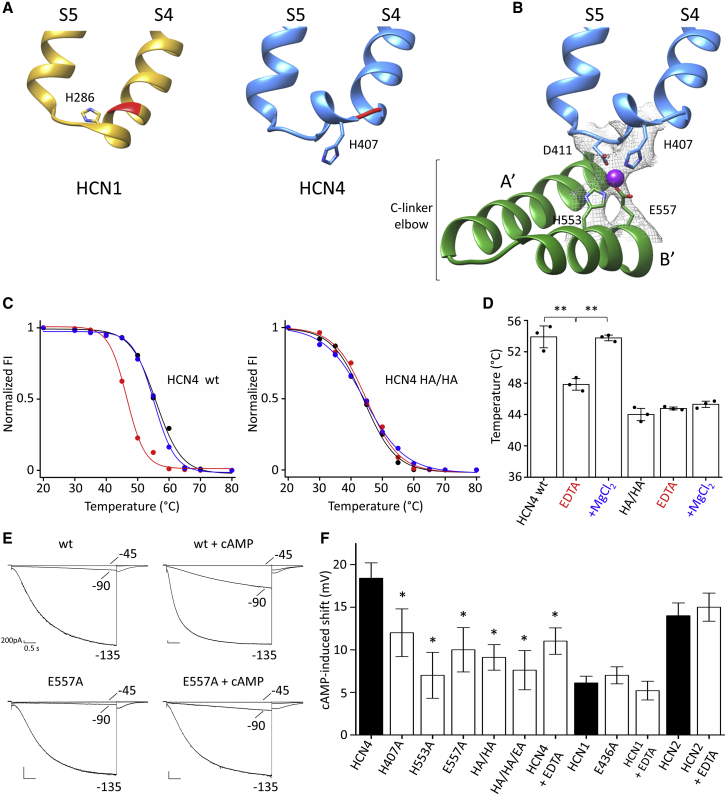
As indicated in the figure legend of Figure 2 D, the Thermal denaturation assays were repeated three times, and the data are represented as mean ± standard error of the mean (SEM) of the three independent experiments. Mean Tm values were compared using one-way ANOVA followed by Fisher’s test. Significance level was set to p = 0.05. As indicated in the figure legend of Figure 2 F, cAMP-induced shifts on half activation voltages (V 1/2 ) are represented as mean ± SEM of independent experiments (n > 3; for details see Table S1 ). Mean activation and deactivation time constants shown in Figure S1 and listed in Table S3 , were compared using Student’s t test. Significance level was set to p = 0.05. Mean V 1/2 values, reported in Table S1 and derived from tail current activation curves shown in Figures S1 and S9–S11 , were compared using one-way ANOVA followed by Fisher’s test or using Student’s t test. Significance level was set to p = 0.05. All the above-described analyses were performed using Originpro software (Originlab, Northampton, MA, USA). Cryo-EM data collection and refinement statistics as well as refinement of protein structure 3D models are listed in Table 1 . Validation of the models’ geometry and all-atoms contacts were carried out with MOLPROBITY ( Chen et al., 2010 ) and the RCSB PDB validation server.
Materials availability
All unique/stable reagents generated in this study are available from the Lead Contact without restriction.
Experimental model and subject details HEK293-T cells
(ATCC) were used for electrophysiology. Freestyle HEK293-F cell cultures (Thermo Fisher) were used for heterologous protein expression.
Method details Constructs
The cDNA encoding rabbit HCN4 (GenBank: NM_001082707 ) carrying an internal deletion (from residues 783 to 1064), hereafter HCN4ΔC, was cloned into a modified pEG BacMam vector ( Goehring et al., 2014 ) (hereafter pEGA) for large-scale protein purification from mammalian cells. The internal deletion eliminates a poorly conserved region in the C-terminal portion of the HCN channel protein, but preserves the extreme C-terminal SNL tripeptide sequence responsible for binding the auxiliary subunit TRIP8b ( Santoro et al., 2004 , 2011 ). The pEGA vector allows expression of the protein of interest with both eGFP and decahistidine tags at its N terminus. The tags can be cleaved using TEV enzyme, due to the presence of a TEV cleavage site between the tags and the protein of interest. For co-expression of HCN4 protein in the presence of TRIP8b, the cDNA encoding full-length mouse TRIP8b (splice variant 1a4) (GenBank: NM_001163516 ) was cloned into the pEGA vector and the HCN4ΔC cDNA into pCI vector (Promega Corporation). For whole-cell patch clamp analysis, the human HCN1 cDNA, the rabbit HCN4 cDNA and the mouse HCN2 cDNA were cloned into the pCDNA3.1 and in the pCI vector, respectively, as reported in Saponaro et al., 2018 . All mutations were generated by site-directed mutagenesis (QuikChange site-directed mutagenesis kit; Agilent Technologies) and confirmed by sequencing.
Electrophysiology and data analysis HEK293-T cells
(Invitrogen) were cultured as described ( Porro et al., 2019 , 2020 ) and transiently transfected either with HCN4, HCN1 or HCN2 wild-type or mutant channels (1μg per transfection) using Turbofect transfection reagent (Thermo Fisher) according to the manufacturer recommended protocol. When needed, GFP (cloned in pMAX vector) was cotransfected to identify successfully transfected cells. All the experiments were performed at room temperature (about 25°C). Currents were recorded in whole-cell configuration with an Axopatch 200B amplifier (Molecular Devices, CA, USA) or with an ePatch amplifier (Elements, Cesena, Italy); data acquired with the Axopatch 200B amplifier were digitized with an Axon Digidata 1550B (Molecular Devices, CA, USA) converter. All data were analyzed offline with Axon pClamp 10.7. Patch pipettes (3–6 MΩ) were filled with a solution containing: 10 mM NaCl, 130 mM KCl, 1 mM egtazic acid (EGTA), 0.5 mM MgCl 2 , 2 mM ATP (Magnesium salt) and 5 mM HEPES–KOH buffer (pH 7.2). The extracellular bath solution contained 110 mM NaCl, 30 mM KCl, 1.8 mM CaCl 2 , 0.5 mM MgCl 2 and 5 mM HEPES–KOH buffer (pH 7.4). The EDTA-containing pipette solution was prepared as follows: 60 mM EDTA-KOH, 20 mM KCl, 10 mM NaCl, 5 mM HEPES-NaOH buffer (pH 7.4). Where indicated, Adenosine 3′,5′-cyclic monophosphate (cAMP, Sigma-Aldrich) was added to the pipette solution from a previously prepared stock solution. For channel activation, hyperpolarizing steps were applied from a holding potential and current tails were measured upon return to a fixed voltage. The duration and the number of the steps used to activate the channels were adjusted for the different HCN isoform. For HCN1, holding potential was −20 mV (1 s), with steps from −20 mV to −120 mV (10 mV interval, 3.5 s) and tail currents recorded at −40 mV (3 s); for HCN4, holding potential was −20 mV (1 s), with steps from −30 mV to −165 mV (15 mV interval, 4.5 s) and tail currents were recorded at −40 mV (4.5 s); for HCN2, holding potential was −20 mV (1 s), with steps from −30 mV to −130 mV (10 mV interval, 4.5 s) and tail currents recorded at −40 mV (4.5 s). Mean activation curves were obtained by fitting maximal tail current amplitude, plotted against the voltage step applied, with the Boltzmann equation: y = 1 / [ 1 + exp ( ( V - V 1 / 2 ) / k ) where V is voltage, y the fractional activation, V 1/2 the half-activation voltage, and k the inverse-slope factor. Mean V 1/2 values were obtained by fitting individual curves from each cell to the Boltzmann equation and then averaging all the obtained values. Activation and deactivation time constants (τ) were obtained by fitting a single exponential function: I = I 0 exp ( - t / τ ) to current traces obtained with the activation protocol described above. Deactivation time constants were obtained by fitting tail currents collected at −40 mV after a fully activation pulse at −135 mV. Protein expression and membrane isolation Freestyle HEK293-F cell cultures (Thermo Fisher) were transiently transfected with pEGA: HCN4ΔC (1μg per ml) at a cell density of 2 × 10 6 cells per ml using polyethyleneimine (PEI) (Polysciences). The transfected cells were harvested by centrifugation after 48 hours of growth in shaker flasks at 37°C, 5% CO 2 . Cell pellets were resuspended in low salt buffer (10 mM KCl, 10 mM MgCl 2 , 10 mM HEPES pH 7.5, 0.5 mM PMSF, EDTA-free complete protease inhibitor cocktail (Roche) (1:1000), 20μg/mL DNase, and 10μg/mL RNase) and lysed by gentle homogenization in a glass homogenizer. Membranes were isolated by ultracentrifugation (40 min at 17000 xg), resuspended by homogenization and washed two times with high salt buffer: 1 M NaCl, 10 mM KCl, 10 mM MgCl 2 , 10 mM HEPES pH 7.5, 0.5 mM PMSF, EDTA-free complete protease inhibitor tablet, 20μg/mL DNase, 10μg/mL RNase. Isolated membranes were resuspended by homogenization in the storage buffer: 200 mM NaCl, 20 mM HEPES, pH 7.5, 0.5 mM PMSF, EDTA-free complete protease inhibitor cocktail (1:1000) and stored at −80°C until use. Protein purification in LMNG/CHS The isolated membranes were thawed on ice and solubilized by the addition of a mixture of detergents (lauryl maltose neopentyl glycol (LMNG) with cholesteryl hemisuccinate (CHS) in a 5 to 1 ratio) to a final concentration of 1% (w/v), and gently agitated for 2 hours at 4°C. The solution was cleared by ultracentrifugation (40 min at 1700 xg). Pre-equilibrated Ni 2+ -NTA resin (QIAGEN) was added to the sample, together with 10 mM imidazole and the mixture allowed to gently rotate overnight at 4°C. After transferring the mixture to a column, the resin was washed in two steps: 1) 5 column volumes of buffer containing 50 mM imidazole; 2) 5 column volumes of buffer containing 75 mM imidazole. The proteins were eluted with 10 column volumes of the following buffer: 200 mM NaCl, 20 mM HEPES, pH 7.5, 300 mM imidazole. The eluted protein was loaded on a Superose 6 increase 10/300 GL SEC column (GE Healthcare Life Sciences) pre-equilibrated with buffer containing 200 mM NaCl, 20 mM HEPES pH 7.0 and detergent (LMNG-CHS) at the concentration of 0.002% (w/v). For the protein sample used to solve the structure of HCN4 bound to cAMP, the ligand (Sigma-Aldrich) was kept at a concentration of 0.2 mM in all steps of membrane isolation and protein purification procedure described above. The decahistidine-eGFP tag at the N terminus of HCN4 protein was not removed. Final yield of purified protein was about 1mg per 1 l of cells. Protein purification in amphipols For purification in amphipols, HCN4 protein was obtained following co-expression and co-purification with the auxiliary subunit TRIP8b. This approach was chosen to prevent any cellular cAMP from occupying the CNBD ( Lolicato et al., 2011 ) due to the antagonistic nature of TRIP8b/cAMP binding ( Bankston et al., 2017 ; Gross et al., 2018 ; Hu et al., 2013 ; Saponaro et al., 2018 ). Although we were unable to detect signal for the TRIP8b protein upon cryo-EM image analysis, potentially due to loss of TRIP8b during vitrification and/or variability in the number of TRIP8b subunits associated with the channel, this approach did yield a near atomic-resolution structure of the HCN4 channel protein stabilized by amphipols in the cAMP-unbound conformation. Following co-transfection of pCI: HCN4ΔC (0.75μg per ml) and pEGA: TRIP8b (0.75μg per ml), membranes were isolated and the protein complex affinity purified with a Ni 2+ -NTA resin as described above. Proteins were then desalted by using PD-10 desalting columns (GE Healthcare) and reconstituted into amphipol A8-35 (Anatrace) at a protein: amphipol ratio of 1: 10 by weight. The protein – amphipol mixture was incubated for 4 hours with gentle rotation at 4°C. After 4 hours of incubation with amphipol, the detergent was removed by the addition of Bio-Beads (Bio-Rad) overnight at 4°C. The reconstituted protein was then loaded on a Superose 6 increase 10/300 GL SEC column pre-equilibrated in a buffer composed by 200 mM NaCl and 20 mM HEPES pH 7.0 without detergent in order to remove the excess of free amphipol and residual detergents. Final yield of purified HCN4ΔC in complex with GFP-TRIP8b was about 1mg per 1 l of cells. Cryo-EM sample preparation and image acquisition (LMNG/CHS) LMNG/CHS solubilized HCN4 alone (apo/LC) and in the presence 0.2 mM cAMP (holo) was concentrated to 0.5 and 0.6 mg ml -1 , respectively, using a 100 kDa concentrator (Amicon) and 3 μL of protein solution was applied to freshly plasma-cleaned (Gatan Solarus) 0.6/1 μm 300 mesh holey gold grids (Quantifoil UltrAuFoil) and blotted for 2.5 s at blot force 3 using a Vitrobot (FEI) operating at 22°C and > 90% humidity prior to being immediately plunged into liquid ethane to vitrify the sample. Images were acquired on a Titan Krios electron microscope (FEI) equipped with a K2 summit detector (Gatan) operating in counting mode with a calculated pixel size of 0.83 Å per pixel. Automated data collection was achieved with the Leginon software package ( Suloway et al., 2005 ). For HCN4 apo, 4465 exposure movies were collected with an estimated dose of 71.85 e - Å -2 for the 6 s exposure composed of 40 frames (150 ms per frame) using a defocus range of −1.1 to −2 μm. For HCN4 holo, 4478 exposure movies were obtained using the same exposure as HCN4 apo but with an estimated total dose of 67.88 e - Å -2 and a defocus range from −1 to −1.8 μm. Single-particle analysis (LMNG/CHS) For the HCN4 holo and apo/LC datasets, frame alignment was performed using the Relion 2.1 ( Kimanius et al., 2016 ; Scheres, 2012 ) implementation of MotionCor2 ( Zheng et al., 2017b ) with 3 by 3 patches and a B-factor of 150 and estimation of the contrast transfer function (CTF) was done for each micrograph using CTFFind4 ( Rohou and Grigorieff, 2015 ). Approximately 1500 particles were manually picked, extracted (binned by 4) and subjected to 2D classification in Relion to obtain templates for automated picking. Template picking runs were done in Relion using templates, low-pass filtered to 20 Å, which corresponded to top, bottom and side views resulting in 2,006,780 and 914,005 picked particles for holo and apo/LC, respectively. An additional template picking run using only side-view templates and a lower picking threshold was performed on the apo/LC dataset to obtain separate stack of 1,039,436 particles. All particles were extracted with a 68 pixel box at 3.32 Å per pixel and imported into CryoSPARC v.2 ( Punjani et al., 2017 ) for initial classification. The pyem script ( https://doi.org/10.5281/zenodo.3576630 ) was used for all conversions between Relion and CryoSPARC. Throughout the processing of these data we sought to determine if any deviations from C4 symmetry were present but ultimately did not observe any strong evidence. Therefore, unless specified differently, C4 symmetry was imposed for all reconstructions described below. For HCN4 holo, several rounds of 2D classification in CryoSPARC resulted in a cleaned stack of 252,458 particles which were moved back into Relion and extracted with recentered coordinates and an unbinned box size of 272 pixels and moved back into CryoSPARC where an ab-initio reconstruction without symmetry constraints produced a volume with apparent C4 symmetry. Several rounds of 3D classification (ab-initio into multiple classes and heterogeneous refinement) resulted in 170,263 particles and 4 Å map with streaking and smearing of density observed in the transmembrane domain (TMD). To improve the quality of the map in this region, particles were moved back to Relion where maps were reconstructed, and signal subtraction performed using a mask that removed the detergent micelle and the lower half of the cytosolic domains. Subsequent classification of the signal-subtracted particles was done in CryoSPARC to obtain a 3.4 Å reconstruction with much improved density in the TMD from 67,583 particles. The signal-subtracted particles were converted back to the original particles in Relion followed by Bayesian polishing prior to a final round of 3D classification and non-uniform refinement in CryoSPARC where 54,828 particles produced the final reconstruction at 3.2 Å resolution. For apo/LC, particles from the two template picking runs were initially processed independently using 2D and 3D classification in CryoSPARC resulting in cleaned particle stacks containing 132,630 and 120,030 particles from the template picking runs using templates with various orientations and only side view templates, respectively. The two particle stacks were merged in Relion and duplicate particles were removed by setting the minimum inter-particle distance to 50 pixels prior to unbinned extraction of recentered particles. This merged stack of 213,381 particles was imported back into CryoSPARC where an initial 3D refinement produced a 4 Å reconstruction that was used as an initial model for 4 rounds heterogeneous refinement with 3 to 5 classes. 85,512 particles from to the best classes from heterogeneous refinement were merged and a 3.5 Å reconstruction was obtained using non-uniform refinement. These particles were imported back into Relion where the volumes were reconstructed and CTF parameters refined. Following CTF refinement, 3D classification into 8 classes resulted in one class with 51,758 particles that contained the most structural features and cleanest density. These particles were imported into CryoSPARC where non-uniform refinement produced a 3.4 Å reconstruction. Finally, the particles were moved back into Relion for Bayesian polishing prior to non-uniform refinement in CryoSPARC to obtain the final map at 3.2 Å resolution. Cryo-EM sample preparation and image acquisition (amphipols) For cryo-EM, a 3.5 μL droplet of freshly purified sample, at final concentration of 0.3-0.7 mg/ml, was applied onto a UltrAu R1.2/1.3 300-mesh gold holey grid (Quantifoil), previously glow discharged for 30 s at 30mA using a GloQube system (Quorum Technologies). Following an incubation of 90 s at 4°C and 100% relative humidity, the grid was blotted for 2-5 s and plunge-frozen in liquid ethane using a Vitrobot Mk IV (Thermo Fischer Scientific). All data were acquired on a 200 kV Talos Arctica (Thermo Fischer Scientific) transmission electron microscope aligned to operate in parallel illumination. Cryo-EM data were acquired using EPU automated data collection software (Thermo Fischer Scientific). Images were collected at nominal magnification of 120,000 ×, corresponding to a pixel size of 0.889 Å/pixel at the specimen level, with an applied defocus values between −0.5 and −2.0 μm. Movies were acquired using Falcon 3EC direct electron detector (Thermo Fischer Scientific) operating in electron counting mode (0.5 e - /pix/sec) with a total exposure time of ∼61 s and a total accumulated dose of 40 e - /A 2 , equally distributed over 40 movie fractions (1 e - /A 2 per fraction). Single-particle analysis (amphipols) A total of 1,571 movies were collected, with frames aligned before summing in individual fractions within EPU software. Micrograph movies were imported in RELION-3.0 for all subsequent image processing tasks ( Zivanov et al., 2018 ). Prior to particle picking, all images were subjected to motion-correction and dose-weighting using MotionCor2 (version 1.2.1) ( Zheng et al., 2017b ).
Estimation of the contrast transfer function
(CTF) was performed on aligned, not weighted sum images using CTFFIND4 (version 4.1.10) ( Rohou and Grigorieff, 2015 ). Particles were automatically picked using Gautomatch (version 0.56) ( https://www.mrc-lmb.cam.ac.uk/kzhang/ ). Coordinates were then imported in RELION for visual inspection and manual removal of erroneously picked contaminants and aggregates. A total of 100,130 particles were initially normalized and extracted in RELION-3.0. Particles set was subjected to several rounds of reference-free 2D classification to remove junk particles. An initial 3D auto-refinement was performed using as reference a low-resolution 3D model obtained by negative staining EM, low-pass filtered at 40 Å. Subsequent rounds of 3D classification were performed imposing C4 symmetry to isolate particles best contributing to isotropic, near atomic-resolution reconstructions. A final dataset of 11,146 particles were selected and subjected to two rounds of CTF refinement, beam tilt correction and 3D auto-refinement followed by Bayesian polishing as implemented in RELION-3.0. A final 3D auto-refinement was performed on polished particles by applying a soft-edged and extended mask to a 15Å low-pass filtered reference map and enabling solvent-flattened FSC calculation. Refined 3D reconstructions were sharpened using RELION-3.0 standard post-processing procedure applying a soft-edge and extended solvent mask. Overall resolutions estimates were calculated from Fourier shell correlations at 0.143 (applied B-factor and estimated resolution listed in Table 1 ). Estimates of local resolutions were performed using RELION-3.0 local resolution tool. Model building, refinement and validation The initial model of HCN4 apo/AM was based on the HCN1 apo cryo-EM structure (PDB: 5U6O ) ( Lee and MacKinnon, 2017 ). The initial model was rigid body fitted into the cryo-EM reconstructions using UCSF CHIMERA ( Pettersen et al., 2004 ) and the resulting aligned model were subjected to real-space refinement using PHENIX ( Adams et al., 2010 ) before sequence adjustment and manual model building with COOT ( Emsley et al., 2010 ). Subsequent HCN4 apo/LC and HCN4 holo models were rigid body fitted with UCSF CHIMERA and real-space refinement with PHENIX using the previous HCN4 apo/AM coordinates as template. A polyalanine truncation and a subsequent rigid body refinement with non-crystallographic symmetry (NCS) restrains was carried out with each model to properly assess NCS using PHENIX. The full atomic models of HCN4 apo/AM, HCN4 apo/LC and HCN4 holo were subjected to multiple rounds of real-space refinement in PHENIX including global minimization and refinement of atomic displacement parameters, and applying secondary structures, Ramachandran and NCS restrains ( Afonine et al., 2018 ).
Thermal denaturation assay
GFP-HCN4ΔC protein was purified following the procedure described in the section “Protein purification in LMNG/CHS.” The buffer in which the protein was eluted from the SEC column contained 0.2 mM cAMP and 0.002% (w/v) LMNG-CHS which were kept present in all incubation buffers. The purified protein (3 μM) was maintained for 48 h at 4°C before being used for thermal denaturation assay. For Mg 2+ removal assay, GFP-HCN4ΔC was incubated 1h with 10 mM Ethylenediaminetetraacetic acid (EDTA, Sigma-Aldrich) pH 7. The buffer with EDTA was replaced by using PD-G25 desalting columns (GE Healthcare) with a buffer without EDTA +10 mM MgCl 2 . Aliquots of purified protein (5μg) were heated for 10 min over the following range of temperatures: 20, 30, 40, 50, 55, 60, 65, 70, 80°C. the samples were centrifuged (30 min, at 18000 xg) to remove precipitated protein and the supernatant was loaded on a Superose 6 increase 10/300 GL SEC column (GE Healthcare Life Sciences) pre-equilibrated with buffer containing 200 mM NaCl, 20 mM HEPES pH 7.0 and detergent (LMNG-CHS) at the concentration of 0.01% (w/v). Since we were following the emission signal (509 nm) of the excited GFP fused at the N terminus of HCN4ΔC, the SEC column was connected to a Prominence UFLC system (Shimadzu) fitted with an RF-10AXL fluorescence detector (Shimadzu). Thermal denaturation curves were obtained by measuring the height of the fluorescent SEC (fSEC) peak measured from samples at each of the different temperatures above reported. The height of the fSEC peak for sample incubated at 20°C was used as control for normalization. The thermal denaturation curves were fitted with a sigmoidal dose-response equation: Y = A 1 + ( A 2 − A 1 ) / ( 1 + 10 ∧ ( ( LOGx0 − x ) ∗ p ) ) where Y is the fluorescence emission in arbitrary units, A1 the minimal fluorescence (from the sample heated at 80°C), A2 the maximal fluorescence (from the sample heated at 20°C), LOGx0 the melting temperature (Tm), x a given temperature, and p is the Hill slope. Mean Tm values were obtained by fitting individual curves from each experiment to the Boltzmann equation and then averaging all the obtained values.
Pore Analysis
The pore radius was calculated with HOLE ( Smart et al., 1996 ) using Amber van-der-Waals radii.
Ivabradine docking
In-silico docking experiments were performed on HCN4 holo, apo/LC and apo/AM structures in the same manner (apo/LC and apo/AM yielding identical results). AutoDock 4.2.6 in conjunction with AutoDockTools 1.5.6 ( Morris et al., 2009 ) was used for preparation of proteins and ligands. Ligands were drawn and energy-minimized with Avogadro ( Hanwell et al., 2012 ) using the UFF force field ( Rappe et al., 1992 ). All bound ligands, detergents and water molecules were removed from protein structures prior to model preparation. Gasteiger charges were used. A cubic box with x = 4.725nm and a grid spacing of 0.0375nm was centered below the selectivity filter to include the central pore module and C-linker. 250 docking attempts with 2,500,000 evaluations were performed per protein-ligand system and clustered based on RMSD. The density of ivabradine was calculated from docked poses as 3d histogram over the atomic coordinates with a grid spacing of 0.1nm. Only bins with a count of at least 3 were considered.
Molecular dynamics simulations
Molecular dynamics simulations were performed using the PD (residues 412-523) of HCN4 holo, apo/LC and apo/AM structures embedded into a pre-equilibrated 1-palmitoyl-2-oleoyl-sn-glycero-3-phosphocholine (POPC) bilayer. Starting configurations were selected based on testing different variations in the initial positioning of the ions (either one or two K + /Na + inside the SF, with or without a separating water molecule) prior to production runs. Based on results from these preliminary trial runs, the following configurations were selected: For simulations in pure KCl solution, we placed two K + inside the SF at the height of binding sites a and c, separated by a single water molecule. For pure NaCl and mixed KCl:NaCl solutions, a single Na + ion was placed inside the SF at the height of the C479 carbonyl oxygen plane with two water molecules above and below, due to the fact that the two ion configuration was not stable. Short trial simulations were also performed to test a range of applied voltages and ion solution concentrations. To increase the rate of sampling of conduction events during production runs, we applied artificial electric fields of −500mV or −700mV ( Andersson et al., 2018 ; Köpfer et al., 2014 ; Stock et al., 2013 ). However, the same conduction mechanism was observed at hyperpolarizing voltages as low as −300mV and ion concentrations as low as 150 mV. Individual simulation conditions and the final composition of each system in the production runs are summarized in Table S3 (note that all production runs reported in Table S3 and described in Figure 6 were performed using HCN4 apo/LC). All simulations were carried out with GROMACS 2019 ( Abraham et al., 2015 ; Van Der Spoel et al., 2005 ) in conjunction with the Amber99sb ∗ -ILDN force field ( Best and Hummer, 2009 ; Lindorff-Larsen et al., 2010 ), the TIP3P water model ( Jorgensen et al., 1983 ), Berger-derived POPC lipids ( Cordomí et al., 2012 ) and ion parameters by Joung and Cheatham ( Joung and Cheatham, 2008 ). Van-der-Waals interactions were cut-off at 1nm and electrostatics were treated by PME ( Essmann et al., 1995 ) beyond 1nm. Temperature and Pressure were kept at 310K and 1bar using the V-Rescale Thermostat ( Bussi et al., 2007 ) and Parrinello-Rahman Barostat ( Parrinello and Rahman, 1981 ), respectively. All bonds were restraint using LINCS ( Hess et al., 1997 ) and hydrogen atoms were represented as virtual sites to allow for an integration time step of 4fs ( Feenstra et al., 1999 ). After system preparation, we performed 2000 steps energy minimization (steepest descent) and 20ns position-restrainted equilibration (F c = 1,000 kJ/mol/nm 2 ). Finally, restraints were gradually lifted over 3ns followed by 1,000-1,500 ns unrestrained simulation. A set of distance restraints were applied on the bottom half of the S6 helix to prevent the cytosolic gate from closing ( Kopec et al., 2018 ). Molecular dynamics trajectories were analyzed using GROMACS tools and Biotite ( Kunzmann and Hamacher, 2018 ).
Supplemental information Document S1. Figures S1–S16 and Tables S1–S3 Document S2. Article plus supplemental information
📊 Figures
Figureu00a01
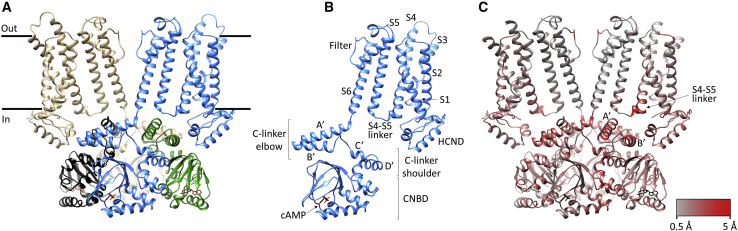
HCN4 structure and its comparison with that of HCN1 (A) Structure of the HCN4 channel tetramer in cAMP-bound state (holo), in a cross-membrane view. For clarity, only two subunits are shown in full (t...
Figureu00a02
Structural, biochemical, and functional evidence for the tetrad, connecting the transmembrane and cytosolic domains in HCN4 (A) Comparison of the S4-S5 linker of HCN1 (yellow) and HCN4 (blue). Backbon...
Figureu00a03
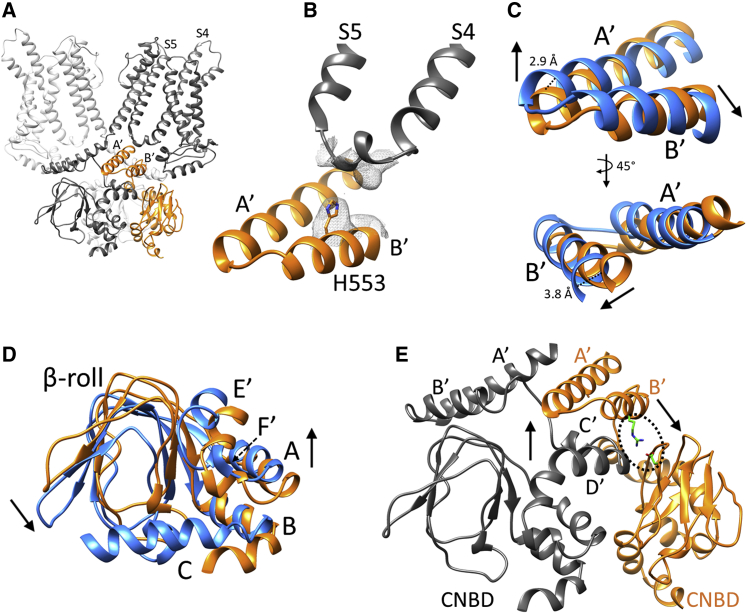
cAMP-dependent rearrangement of the cytosolic region of HCN4 channels (A) Ribbon representation of HCN4 apo/LC dimer in gray, along with C-linker/CNBD of a third subunit in the tetramer shown in orang...
Figureu00a04
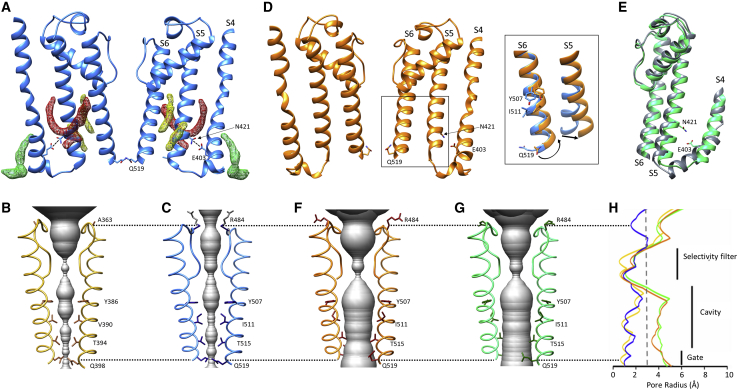
Transmembrane domain rearrangements in the three HCN4 structures (A) Ribbon representation of S4, S5, and S6 TM helices in HCN4 holo (blue) in a cross-membrane view. For clarity, only two subunits are...
Figureu00a05
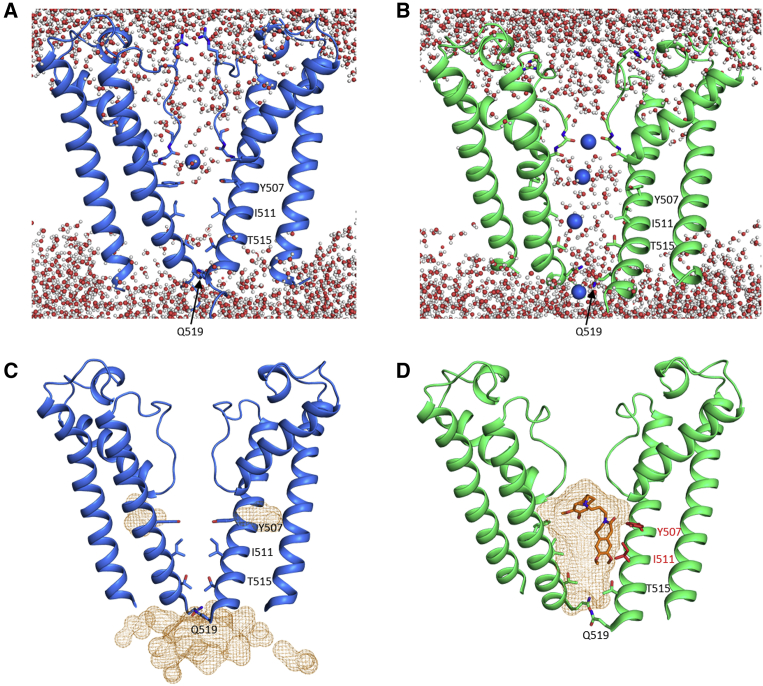
Pore hydration and ivabradine docking in HCN4 structures (A and B) Representative snapshot from unrestrained MD simulation of PD of HCN4 structure with narrow cytosolic entrance (blue, holo) (A) and w...
Figureu00a06
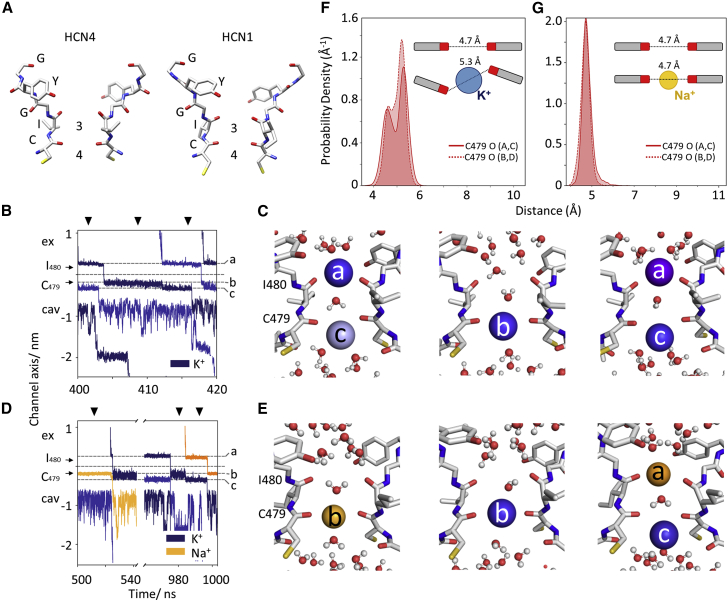
Mechanism of ion permeation in HCN channels (A) Comparison of selectivity filters of an open HCN4 pore (apo/LC) and HCN1. The sequence 479 CIGYG 481 (HCN4 numbering) is marked. (B) Conduction trajecto...
Figure images are served from the NIH/NLM PubMed Central Open Access Subset or Europe PMC; copyright remains with the publishers and authors.
💬 Discussion
0 commentsNo comments yet. Be the first to start a discussion!
Leave a Comment