Abstract
General anesthesia (GA) can produce analgesia (loss of pain) independent of inducing loss of consciousness, but the underlying mechanisms remain unclear. We hypothesized that GA suppresses pain in part by activating supraspinal analgesic circuits. We discovered a distinct population of GABAergic neurons activated by GA in the mouse central amygdala (CeAGA neurons). In vivo calcium imaging revealed that different GA drugs activate a shared ensemble of CeAGA neurons. CeAGA neurons also possess basal activity that mostly reflects animals' internal state rather than external stimuli. Optogenetic activation of CeAGA potently suppressed both pain-elicited reflexive and self-recuperating behaviors across sensory modalities and abolished neuropathic pain-induced mechanical (hyper-)sensitivity. Conversely, inhibition of CeAGA activity exacerbated pain, produced strong aversion and canceled the analgesic effect of low-dose ketamine. CeAGA neurons have widespread inhibitory projections to many affective pain-processing centers. Our study points to CeAGA as a potential powerful therapeutic target for alleviating chronic pain.
🔬 Techniques
🔭 Microscopes
💻 Software
✨ Fluorophores
🧪 Sample Preparation
🏭 Microscope Brands
🧪 Reagent Suppliers
💻 Software Details
💻 Code & Software
💾 Data Repositories
🏛️ Research Organizations (ROR)
Affiliated research institutions:
📋 Methods
Animal statement
All experiments were conducted according to protocols approved by The Duke University Institutional Animal Care and Use Committee.
Animals
Adult male and female (more than 8 weeks old) Fos TVA mice (Jackson Laboratory, stock 027831) were used for all experiments. Mice were housed in the vivarium with 12-hour light and dark cycle and were given food and water ad libitum. vGAT-IRES-cre mice (Jackson Laboratory, stock 016962) were used for some immunohistochemistry experiments. Viruses CANE-LV-Cre (titer, 5×10 8 ifu/mL; CANE-LV envelope [Addgene Plasmid #86666]) were produced as previously described. Various AAVs were co-injected with CANE-LV-Cre: AAV2/1-CAG-Flex-GFP (UNC Vector Core), AAV2/1-CBA-Flex-ChR2-mCherry (UPenn Vector Core), AAV2/1-hSyn-ChR2(H134R)-eYFP (UPenn Vector Core and Addgene), AAV2/1-Ef1a-DIO-eArch-eYFP (Addgene), AAV2/1-CAG-Flex-GCaMP6m (Addgene).
Surgical procedures
Viral delivery. To capture and express desired transgenes in CeA GA neurons, Fos TVA mice were anesthetized with isoflurane (1.5% isoflurane, 0.75% oxygen) for two hours (to induce Fos expression in CeA GA ) in a chamber before mice were transported to a stereotaxic frame (David Kopf Instruments) and small craniotomies were created over the target region. The coordinates of CeA used relative to bregma were: AP = 1.15 or 1.20 +/− 0.05 mm, ML = 2.83 or 2.86 +/− 0.02 mm, DV = −4.17 or −4.22 +/− 0.03 mm. The CANE-LV-Cre and Cre-dependent AAV were mixed (1:1) prior to injection. 1 µl total was delivered at a rate of 60 nl/min per injection and left for 10 minutes post injection for efficient diffusion of the virus. Optic fiber implantation. After viral injection, an optical fiber (200 µm core diameter, ThorLabs) was inserted 300 µm above the injection site and secured using Metabond (Parkell) and dental cement. During post hoc immunohistochemistry, viral expression, site of injection and insertion of optical fiber was confirmed; animals with failed expression or off target optical fiber placement were excluded from all analysis. EEG/EMG and CeA GA optogenetic experimental procedure. Three stainless steel screws were placed on the left frontal, left parietal, and right cerebellar cortex as EEG electrodes and two headmount-coupled stainless steel leads (#8201-SS, Pinnacle technology Inc) were inserted into bilateral neck muscles as EMG electrodes. For optogenetic activation, one optical fiber was inserted on top of right CeA. All three EEG electrodes were further connected onto the headmount (#8201-SS, Pinnacle technology Inc). EEG and EMG were recorded with Sirenia Acquisition (Pinnacle technology Inc) at 1000 Hz. For optogenetic experiments, after 5 min of recorded EEG baseline in the recording chamber, three laser trains (20 Hz, 20 ms, 2 min on followed by 2 min off, ~4 mW from the fiber tip, 473-nm Blue Laser) were given per experimental animal. GRIN lens implantation and baseplate attachment. GRIN lens (7.3 × 0.6 mm, Inscopix) was implanted according to Inscopix instructions. A holder (Inscopix, Gripper Part ID: 1050–002199) was used to lower the miniature microscope with baseplate onto the top of the GRIN lens until the GCaMP6m fluorescence was visible under the illumination from the miniscope’s LED. Subsequently, the baseplate was fixed to the skull with dental cement darkened with carbon powder to prevent external light from contaminating the imaging field-of-view. A cover (Inscopix, Part ID: 1050–002193) was attached to the baseplate to protect the microendoscope. Chronic Constriction Injury of the Infraorbital Nerve (CCI-IoN). Animals were anesthetized with ketamine/xylazine and a small incision (~ 0.35 cm) parallel to the midline was made starting at the caudal end of the third row of whiskers toward the ipsilateral orbit. The superficial fascia was gently separated to expose the infraorbital nerve (IoN) trunk at its distal segment outside the orbital cavity. Two chromic ligatures (6–0, Angiotech) were loosely tied around the distal part of the IoN (1 mm apart). The wound was checked for hemostasis and the incision was closed with three 5–0 silk sutures (Angiotech). In vivo optogenetic activation or silencing Animals with optical fiber implants were connected to an optical patch cable (ThorLabs) coupled to either a 473 nm or 561 nm laser (Opto Engine LLC). Light pulse was controlled by a pulse generator (Master 8 or AIM-2 Optogenetic Interface). 473 nm laser was applied in pulsed mode (~3.5 mW/mm 2 , 20 Hz, 20 ms pulse width) to animals that expressed ChR2 in CeA GA and their respective GFP controls, while 561 nm laser was applied in continuous mode (~15 mW/mm 2 ) to animals that expressed eArch in CeA GA and their respective GFP controls.
Show full methods section
Animal statement
All experiments were conducted according to protocols approved by The Duke University Institutional Animal Care and Use Committee.
Animals
Adult male and female (more than 8 weeks old) Fos TVA mice (Jackson Laboratory, stock 027831) were used for all experiments. Mice were housed in the vivarium with 12-hour light and dark cycle and were given food and water ad libitum. vGAT-IRES-cre mice (Jackson Laboratory, stock 016962) were used for some immunohistochemistry experiments. Viruses CANE-LV-Cre (titer, 5×10 8 ifu/mL; CANE-LV envelope [Addgene Plasmid #86666]) were produced as previously described. Various AAVs were co-injected with CANE-LV-Cre: AAV2/1-CAG-Flex-GFP (UNC Vector Core), AAV2/1-CBA-Flex-ChR2-mCherry (UPenn Vector Core), AAV2/1-hSyn-ChR2(H134R)-eYFP (UPenn Vector Core and Addgene), AAV2/1-Ef1a-DIO-eArch-eYFP (Addgene), AAV2/1-CAG-Flex-GCaMP6m (Addgene).
Surgical procedures
Viral delivery. To capture and express desired transgenes in CeA GA neurons, Fos TVA mice were anesthetized with isoflurane (1.5% isoflurane, 0.75% oxygen) for two hours (to induce Fos expression in CeA GA ) in a chamber before mice were transported to a stereotaxic frame (David Kopf Instruments) and small craniotomies were created over the target region. The coordinates of CeA used relative to bregma were: AP = 1.15 or 1.20 +/− 0.05 mm, ML = 2.83 or 2.86 +/− 0.02 mm, DV = −4.17 or −4.22 +/− 0.03 mm. The CANE-LV-Cre and Cre-dependent AAV were mixed (1:1) prior to injection. 1 µl total was delivered at a rate of 60 nl/min per injection and left for 10 minutes post injection for efficient diffusion of the virus. Optic fiber implantation. After viral injection, an optical fiber (200 µm core diameter, ThorLabs) was inserted 300 µm above the injection site and secured using Metabond (Parkell) and dental cement. During post hoc immunohistochemistry, viral expression, site of injection and insertion of optical fiber was confirmed; animals with failed expression or off target optical fiber placement were excluded from all analysis. EEG/EMG and CeA GA optogenetic experimental procedure. Three stainless steel screws were placed on the left frontal, left parietal, and right cerebellar cortex as EEG electrodes and two headmount-coupled stainless steel leads (#8201-SS, Pinnacle technology Inc) were inserted into bilateral neck muscles as EMG electrodes. For optogenetic activation, one optical fiber was inserted on top of right CeA. All three EEG electrodes were further connected onto the headmount (#8201-SS, Pinnacle technology Inc). EEG and EMG were recorded with Sirenia Acquisition (Pinnacle technology Inc) at 1000 Hz. For optogenetic experiments, after 5 min of recorded EEG baseline in the recording chamber, three laser trains (20 Hz, 20 ms, 2 min on followed by 2 min off, ~4 mW from the fiber tip, 473-nm Blue Laser) were given per experimental animal. GRIN lens implantation and baseplate attachment. GRIN lens (7.3 × 0.6 mm, Inscopix) was implanted according to Inscopix instructions. A holder (Inscopix, Gripper Part ID: 1050–002199) was used to lower the miniature microscope with baseplate onto the top of the GRIN lens until the GCaMP6m fluorescence was visible under the illumination from the miniscope’s LED. Subsequently, the baseplate was fixed to the skull with dental cement darkened with carbon powder to prevent external light from contaminating the imaging field-of-view. A cover (Inscopix, Part ID: 1050–002193) was attached to the baseplate to protect the microendoscope. Chronic Constriction Injury of the Infraorbital Nerve (CCI-IoN). Animals were anesthetized with ketamine/xylazine and a small incision (~ 0.35 cm) parallel to the midline was made starting at the caudal end of the third row of whiskers toward the ipsilateral orbit. The superficial fascia was gently separated to expose the infraorbital nerve (IoN) trunk at its distal segment outside the orbital cavity. Two chromic ligatures (6–0, Angiotech) were loosely tied around the distal part of the IoN (1 mm apart). The wound was checked for hemostasis and the incision was closed with three 5–0 silk sutures (Angiotech). In vivo optogenetic activation or silencing Animals with optical fiber implants were connected to an optical patch cable (ThorLabs) coupled to either a 473 nm or 561 nm laser (Opto Engine LLC). Light pulse was controlled by a pulse generator (Master 8 or AIM-2 Optogenetic Interface). 473 nm laser was applied in pulsed mode (~3.5 mW/mm 2 , 20 Hz, 20 ms pulse width) to animals that expressed ChR2 in CeA GA and their respective GFP controls, while 561 nm laser was applied in continuous mode (~15 mW/mm 2 ) to animals that expressed eArch in CeA GA and their respective GFP controls.
Immunohistochemistry
To detect general anesthesia-activated neurons, animals were anesthetized with isoflurane, or ketamine/xylazine, or dexmedetomidine, for two hours then transcardially perfused with 10% sucrose in cold phosphate buffer saline (PBS, pH 7.4) followed by 4% cold paraformaldehyde (PFA) fixation solution. To detect restraint stress-activated neurons, mice were placed in the restrainer for 90 min (TV-150, Braintree scientific Inc). All brains were post-fixed in PFA overnight at 4°C, cryoprotected in 30% sucrose PBS solution for 2–3 days at 4°C, frozen in O.C.T compound (Tissue-Tek, Sakura), and then stored at −80°C until sectioning. Floating brain sections (80 µm) were stained using standard immunofluorescent protocol. The primary antibody used were: goat anti-Fos (Santa Cruz Biotechnology, sc520g, 1:300) 50 , rabbit anti-Fos (Cell Signaling, #2250, 1:1500) 51 , anti-Neurotensin (ImmunoStar, 20072) 52 . The secondary antibody used are: Alexa Fluor 488 donkey anti-goat (Jackson ImmunoResearch, 705-545-147, 1:500) 53 , Alexa Fluor 647 anti-rabbit (Jackson ImmunoResearch, 711-605-152, 1:500) 54 , and Cy3 donkey anti-goat (Jackson ImmunoResearch, 705-165-147, 1:500) 55 (see Life Sciences Reporting Summary).
Fluorescent in situ hybridization
For each brain collected after one hour of isoflurane anesthesia, 8–10 slices (60 µm thick) containing the central amygdala (CeA) were collected and in situ was performed as described previously 11 . Penk1 , Pkc-d , Pdyn , Sst , and Fos probes were the same as the ones used by the Allen Brain Atlas. FITC-labeled Fos probe was paired with Dig-labeled Penk1 , Pkc-d , Pdyn , or Sst probes to analyze the co-localization of Fos to these markers. For 3-color HCR in situ hybridization to examine Fos, Penk1, and Pkc-d expression: HCR in situ were performed as described 10 . Probes were ordered from Molecular Instruments. For each brain collected after one hour of isoflurane anesthesia, 8–10 ((60 µm thick) containing the central amygdala (CeA) were collected and hybridization chain reaction in situ was performed. On day 1, collected brain slices were exposed to probe hybridization buffer with HCR Probe Set. On day 2, brain slices were washed with probe wash buffer, received amplification buffer and amplifier. On day 3, brain slices were counter stained with DAPI and mounted. Penk1 (488 nm), Pkc-d (647 nm), and Fos (546 nm), probes were used to examine any overlaps between these markers. Histological image acquisition and quantification Image Acquisition. Brain slices were visualized with a laser scanning confocal microscope (Zeiss 700). Entire brain slices were imaged at 10x resolution, while the entire CeA was imaged at 20x resolution using z-stack (~30 µm). Cells were manually quantified for co-localization and total Fos count between Fos expressing neurons and respective markers by a researcher blinded to the samples. For each animal, six slices were averaged for the entire CeA region before averaging percentages across all animals. Projection Average Intensity Values. The regions of interest/borders for each region were drawn according to the Allen Brain Atlas. The mean, or average intensity value was calculated for each region using the histogram function in Photoshop. The mean value was recorded across all samples and an average was computed across three samples.
Behavioral Tests
Formalin injection. Formalin (Sigma, 37%) was diluted to 4% with PBS and 10 µl was unilaterally injected into the top of the hind paw or the whisker pad to induce inflammatory pain. The animals displayed self-recuperating behavior dependent on injection site such as licking of the hind paw or wiping of the whisker pad. Formalin injection induced 2 distinct phases of acute pain. Self-recuperating behavior was video recorded immediately after injection. During the first and second phase, optogenetic stimulation was initiated for 2 minutes-on and -off periods for 3 (first phase, 6 minutes stimulation) and 6 times (second phase, 12 minutes stimulation). Self-recuperating behavior were recorded and analyzed. Spontaneous Wiping behavior. After CCI-IoN, animals exhibited spontaneous wiping behavior as a result of the injury. Animals were placed into a clear cylindrical chamber and attached to the patch cable. Each animal was placed in the chamber and video recorded for 19 minutes (7-minute baseline, 5-minute stimulation, and 7-minute post-stimulation). Optogenetic illumination was turned on during the middle 5-min period and total time exhibiting spontaneous wiping behavior was measured. Low-dose Ketamine Analgesia experiments. Mice were injected with 12 mg/kg of ketamine and placed back into their home cage for six minutes. Then mice were given an injection of 10 ul of 0.2 μg/μl capsaicin (capsaicin was diluted with from a 10 µg/µl stock to 0.2 µg/µl in saline with 4% ethanol and 4% Tween-80). Mice were immediately video recorded for 15 minutes in a cylinder plexiglass container. Mice with optogenetic silencing received silencing during the first (0–5 min) and last (10–15 min) 5-minute bins. The total licking time was computed from the entire 15 minutes of recording as the animals exhibited self-recuperating behavior by licking the hind paw. Hargreaves heat test. To examine thermal sensitivity, animals were placed in the Hargreaves test enclosure for 5–10 minutes to acclimate. The guiding lines were used to position the infrared emitter/detector directly underneath the plantar region of the hind paws. The I.R. intensity was set to 40. The reaction time was recorded. Each animal received 3 trials per hind paw, each applied at least 30 seconds apart. Cold dry ice test. To examine cold sensitivity, animals were placed in a 13 × 13 × 20 cm chamber that was raised 30.5 cm above the floor and left to acclimate for 5–10 minutes. The floor of the chamber was a 0.80 mm thick polycarbonate sheet. Dry ice were pounded into a fine powder and packed tightly into a ½ inch diameter syringe in order to form a cylindrical shape. Dry ice was pushed out of the syringe and centered on the plantar region of the hind paws. The syringe was promptly removed after the animal displayed a withdrawal reflex. Withdrawal behavior was video recorded. Each animal received 3 trials per hind paw, each applied at least 10 seconds apart. von Frey test on the face. To assess mechanical sensitivity, animals received 10 repeated application (10–20 seconds apart) of various von Frey filaments with increasing forces (.008 to 1 gram) to the whisker pads (with all whiskers kept intact). In the CCI-IoN model, filaments were applied near the ligation injury. Withdrawal Threshold was defined as the first filament that induced withdrawal latency over 50% of the 10 repeated applications. von Frey test on the paw. To assess mechanical sensitivity, animals received 10 repeated application (10–20 seconds apart) of various von Frey filaments with increasing forces (0.40g to 4.0g) to the hind paws. Electronic von Frey test on the hind paws. The electronic von Frey (eVF) test was used exclusively for the hind paws. The eVF rigid tip was applied to the plantar region of the hind paws and the withdrawal threshold was recorded. The calibration was set at reaching 50 grams in 5 seconds. Each animal received 3 trials per hind paw, each applied at least 10–20 seconds apart. Open Field test. To assess locomotion and anxiety-like behavior, animals were placed in a 30 × 30 cm box. Each animal was placed in the center of the box and locomotion activity and freezing behavior was recorded for a total of 15 minutes. Animals were attached to the patch cable and optogenetic illumination was turned on during the middle 5-min period. ANY-Maze software (Stoelting Co.) was used to create a 15 × 15 cm center zone within the box and also used to analyze the video recording. Elevated Plus Maze test. To assess anxiety-like behavior to optogenetic illumination of CeA, mice were placed in an elevated plus maze for 15 minutes. Animals were attached to the patch cable and received optogenetic illumination during the middle 5-minute period. Locomotion and time spent in the open and closed arms were analyzed and recorded using ANY-Maze software. Conditioned Place Preference/Aversion test. To determine if optogenetic activation or silencing of CeA GA induced a place preference or aversion, animals were placed in a 2-chamber 20 × 40 cm box and attached to a patch cable. Each chamber contained two distinct visual patterns of horizontal and vertical stripes. On day 1, animals were placed in the center of the box and left to explore the box without illumination for 10 minutes. The preference of the animal was determined by the chamber the animal spent more time in. For the next 4 days (day 2–5), animals received illumination on day 3 and 5, and no illumination on day 2 and 4. On the last day (day 6), animals could explore freely the 2 chambers to determine the new place preference without illumination. ChR2-expressing animals received illumination on the side it did not prefer for 22 minutes with 2 min on and off periods, while eArch-expressing animals received illumination on the side it did prefer for 10 minutes continuously. This test was designed to bias against the animal’s natural preference. ANY-Maze software was used to analyze the time spent in each chamber. In a separate experiment, CCI-IoN animals expressing ChR2 or GFP controls were also placed in the same 2-chamber box to determine if optogenetic activation of CeA GA altered the natural place preference in a state of chronic pain. Ultrasonic Vocalization and Courtship Behavior. Male animals were placed in a clear cylindrical chamber with estrus female BL6 animals for 90 sec (baseline), then male animals received optogenetic stimulation for 90 sec. Male ultrasonic vocalizations were recorded with an ultrasonic microphone (CM16/CMPA-P48; Avisoft-Bioacoustics) and analyzed with MUPET 56 . Courtship behavior was defined as anogenital sniffing and mounting. Behavior was video recorded, and the differences of total syllables elicited during ultrasonic vocalizations and the duration of courtship behavior with and without light stimulation were quantified. In Vivo Calcium Imaging and Image Data Analyses Order of calcium imaging recording in behavioral experiments. After the baseplate attachment, each of the CANE ISO -GCaMP6m CeA GA mouse was acclimated to handling and attachment of the Inscopix miniature microscope for 10–15 min per day for 3–5 days. Doric TTL Plus Generators (Doric, OTPG_4) was used to trigger and synchronize behavioral video recordings with calcium recordings. Part1, anesthesia and noxious stimuli test. We first imaged neural activities during re-exposure to isoflurane induced anesthesia (Day 1, 5min baseline followed by 20 min of 1.5% isoflurane mixed with oxygen). On day 3, we imaged the neurons during ketamine/xylazine induced anesthesia (5min baseline followed by i.p. injection of ketamine (100mg/kg) /xylazine (10mg/kg) and imaged for 20 min continuously). Day 5 to day 8, we imaged the neurons before, during, and after applications of noxious stimuli (dry ice, laser heat, von Frey on hind paw and von Frey on facial pad), with 1 day interval between each sensory test experiment. 2 days after, we repeated imaging of neural activities in some mice during 1.5% isoflurane (day 10) and ketamine /xylazine (day 12) induced anesthesia. 7 mice underwent imaging under anesthesia, 6 of them underwent cold and heat stimuli, 4 of them underwent von Frey stimuli on the hind paws and facial pads. Part2, anesthesia and stress. Calcium imaging recordings of restraint stress (8 min baseline followed by 8 min restriction of AIMS TM Rodent restraint bags, and later 8 min release from the restriction), and isoflurane anesthesia (1.5%, 5min baseline followed by 20 min of 1.5% isoflurane mixed with oxygen) were done separately within one day (Day 1). Then, day 3, we imaged neurons during low dose ketamine (5min baseline followed by i.p. injection of ketamine (12 mg/kg) and imaged for 20 min continuously), and regular dose ketamine on day 4 (5min baseline followed by i.p. injection of ketamine (100 mg/kg) and imaged for 20 min continuously). On day 6, we imaged neurons during low dose isoflurane (0.5%, 5min baseline followed by 20 min of 0.5% isoflurane mixed with oxygen). Mice moved around under low dose ketamine and low dose isoflurane administration. On day 8, we repeated imaging recordings of restraint stress and isoflurane (1.5%) induced anesthesia separately. 5 mice went through this series of imaging. Imaging data analysis: All the calcium imaging data were processed from the raw video by MIN1PIPE 17 , where videos underwent background subtraction, movement correction, automatic seeds selection and ROI separation. The extracted ROIs were then manually inspected again by experienced researchers to ensure only the most reliable units were included. The traces of the refined set of ROIs were then rescaled to the same range (between 0 and 1 with arbitrary unit). For the isoflurane and ketamine experiments, the refined traces were aligned according to the delivery moment of the anesthetics, and the window from 4 min prior to (baseline, −4 – 0 min) to 20 min post (isoflurane or ketamine, 0–20 min) the delivery moment was selected to perform data analysis. The aligned traces were sorted by the average calcium fluorescent intensity ratio of all the units, first sorted by (isoflurane or ketamine period) / (baseline) ( Fig. 2 c and e ), and then sorted by (last 10 min of isoflurane or ketamine) / (first 10 min of isoflurane/ketamine) ( Fig. 2 d and f ). The sorted traces were roughly classified into isoflurane- or ketamine- active and suppressed group ( Fig. 2 c and e ), or sustained, transient and suppressed groups ( Fig. 2 d and f , Extended Data 3 a and b ), respectively, where the average trace of each group was calculated. To further examine the finer dynamic property of different groups, the percentage contribution of the last 10 min to the overall 24 min duration of each trace was calculated. The distribution of the sustained activity and transient activity in percentage contribution was then calculated from each group or each mouse To evaluate the isoflurane and ketamine neural response, we in general applied 4 approaches including direct calculation and corrected calculation ( Fig. 2h , right panel, Extended Data 3 c and d ). Direct calculation method is computing the ratio of the mean activity for stimulus ON (isoflurane or ketamine delivery) and OFF (baseline) periods, indicated by Mean/Mean, where activity in the stimulus ON period might be underestimated due to the changes of brain dynamics during the long imaging time window over anesthesia (20 min). Therefore, we also calculated the corrected (effective) mean intensity (Eff.) for the ON and/or OFF periods (Eff./ Eff. or Eff. / Mean) before computing the ON/OFF activity ratio, by computing only the average activity during the time when the calcium intensity is at least two median absolute deviation above the overall mean. In addition, we calculated the effective active duration of individual neurons. Neurons with effective active time over certain amount of time (1 min) after stimulus ON (anesthesia onset) could be considered as activated by the stimulus (Eff. time). In the sensory stimuli application experiments ( Fig. 4 ), for every stimulus applied in these experiments, a trial was defined with a window of 10 s before and 10 s after the stimulus. All the traces from the same experimental condition were epoched based on the trials, and were then pooled together and sorted by the peak activity latency within the trial. The mean activity trace was calculated by averaging across the epoched traces of all neurons and all trials. For each individual neuron, the sorted traces from all trials of the same condition were further pooled together to show the neuronal response to the stimuli. To investigate the neuronal response change, the pooled traces were averaged and the overall activity difference between the 5 s post-response average and the 5 s pre-response average was calculated for all individual neurons, based upon which the empirical probability distribution was computed across neurons. To group the neurons based on the response types, the activity difference of individual neurons was compared with a threshold of two times of the standard deviation of the averaged neuronal activity in that trial. If the activity difference was higher than the threshold, the neuron was considered to be in the activity increased group; if the activity difference was lower than the negative of the threshold, the neuron was considered to be in the activity suppressed group; otherwise the neuron was classified as being in the unchanged group. The proportion of each group was then calculated. In the restraint stress experiment ( Extended data 3 ), 1st 8 min was recorded for baseline spontaneous activity (−8 – 0 min), 2nd 8 min (0 – 8 min) was recorded when mice were under restraint, and 3rd 8 min (8 – 16 min) was recorded when mice released from the restraint. To further quantify the stress neural responses and compared with their responses to isoflurane (as shown in Extended data 3e – h ), we computed the corrected/effective mean calcium intensity for the stress period and two baseline periods. Only the time points when signal intensity was over two median absolute deviation above the mean were considered as effective time points. Then we calculated the ratio between the corrected mean intensities for each neuron, and label the neuron to be stress activated if the ratio is above 1 while stress suppressed if the ratio is below 1. To further have a more conservative calculation, we excluded the neurons with maximum intensity below 0.1 (normalized intensity) over the whole duration. The remaining neurons were labeled as the robust group, and used for later cross-analysis with isoflurane-responses. Same cell tracking (cross day analysis) of CeA GA calcium activity: To register neurons across days from different calcium imaging recordings sessions of the same mouse, we adapted CellReg method with Log Demons registration method used in MIN1PIPE 17 , 18 . In brief, all the extracted ROIs from each session to be tracked were collected, and then the modified CellReg was applied. Only the ROIs that were reliably tracked were used for subsequent analyses. EEG analysis. The EEG signal was first epoched to laser on (2 min) and off (2 min) periods, and the power spectrum was calculated using FFT. The power spectrum was then normalized to the full frequency band on which each epoch is valid, and only the band [0, 20Hz] was extracted to further compute the average trace across the 9 epochs (N= 3 mice, 3 repetitions in each mouse).
Statistics
All statistical analyses were performed in GraphPad Prism 8. Behavior data was analyzed with 2-way ANOVA followed by Tukey, Sidak, and Dunnett’s post hoc multiple comparison test when appropriate. All t-tests were performed as two-tailed. Significance levels are indicated as follows: *: P
📊 Figures
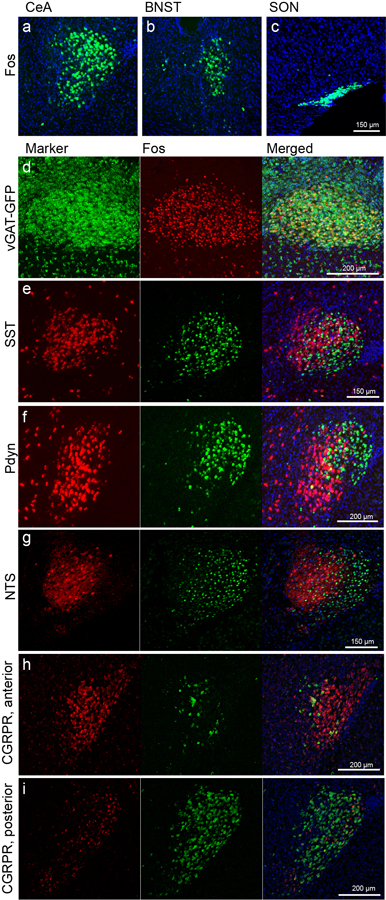
Extended Data Fig. 1
Isoflurane general anesthesia activates different neuronal ensembles and molecular marker analysis of CeA GA neurons.
General anesthesia activated the a , central amygdala (CeA), b , bed nucleus of stria terminalis (BNST), and c , super optic nucleus (SON). Representative images two-color experiments examining the ex...
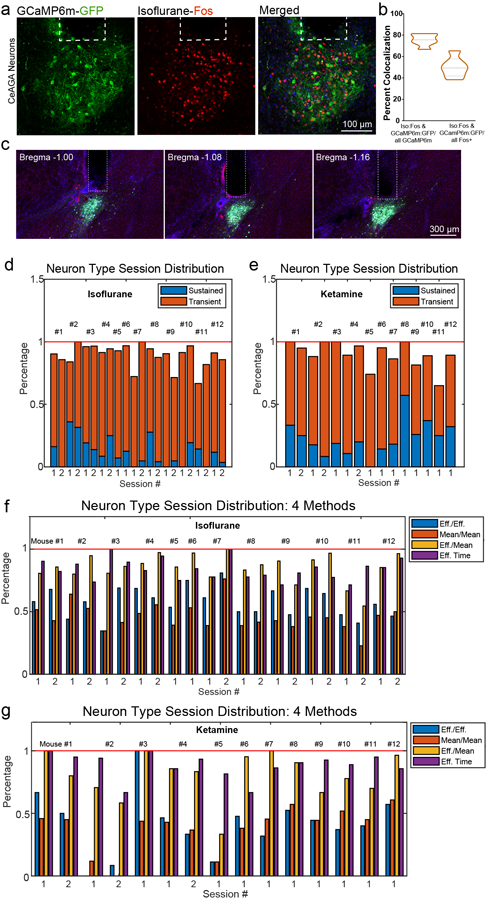
Extended Data Fig. 2
Representative post hoc histology and session distributions of activity of CANE-captured isoflurane -activated CeA GA neurons in response to isoflurane or ketamine.
a , Representative images of CANE-GCaMP6m+ neurons (green) and isoflurane-activated Fos+ neurons (red) and their overlap. Dotted box showing the placement of the GRIN lens in CeA. b , Quantification o...
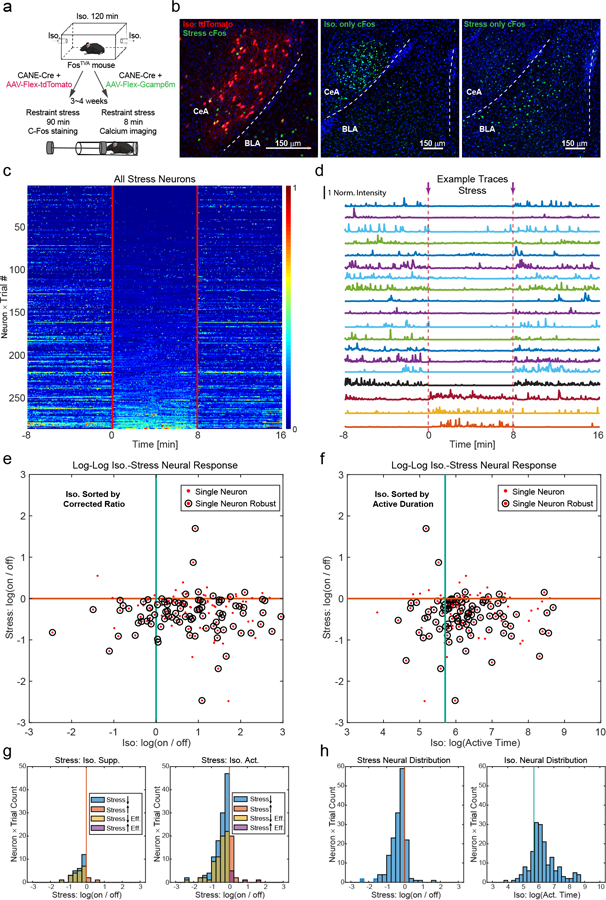
Extended Data Fig. 3
CANE-captured CeA GA neurons are mostly inhibited by stress.
a , Schematic of CANE captured isoflurane -activated CeA GA neurons followed by a second exposure to restraint stress (left, for Fos expression, right, for calcium imaging). b , Left, representative i...
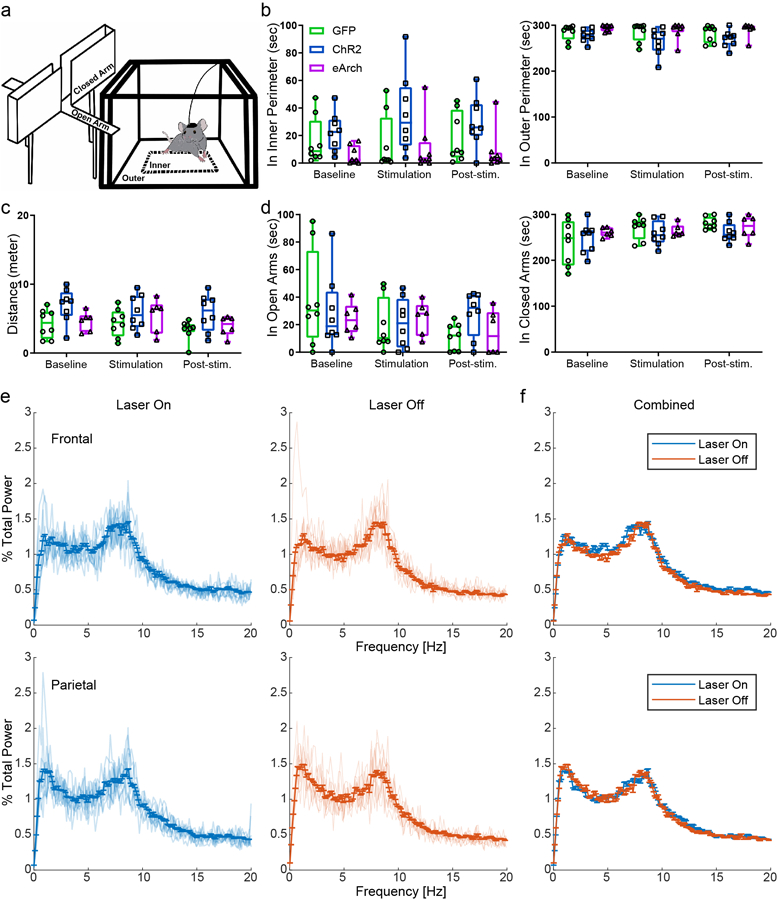
Extended Data Fig. 4
Manipulation of CeA GA neurons did not induce anxiety-like or fear-like behavior or change the gross brain state.
a , Schematics of the Elevated Plus Maze (left) and Open Field (right) apparatus. b , Quantification of total time spent in the inner (GFP: 15.67 u00b1 5.97s (baseline), 14.18 u00b1 7.24s (stim), 18.0...
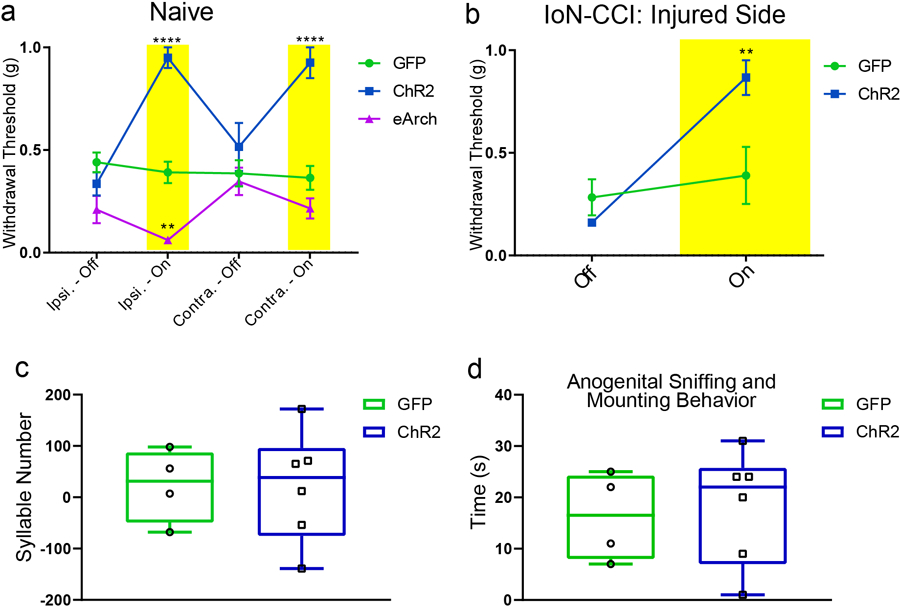
Extended Data Fig. 5
Manipulations of CeA GA neurons modulated reflexive withdrawal threshold to von Frey filaments and activation of CeA GA neurons did not alter courtship behaviors.
a-b , Quantifications of the withdrawal threshold to von Frey filaments applied to the whisker pad in a , nau00efve (control, n=9 animals (0.44 u00b1 0.0g5 (ipsi-off), 0.39 u00b10.05g (ipsi-on), 0.39 ...
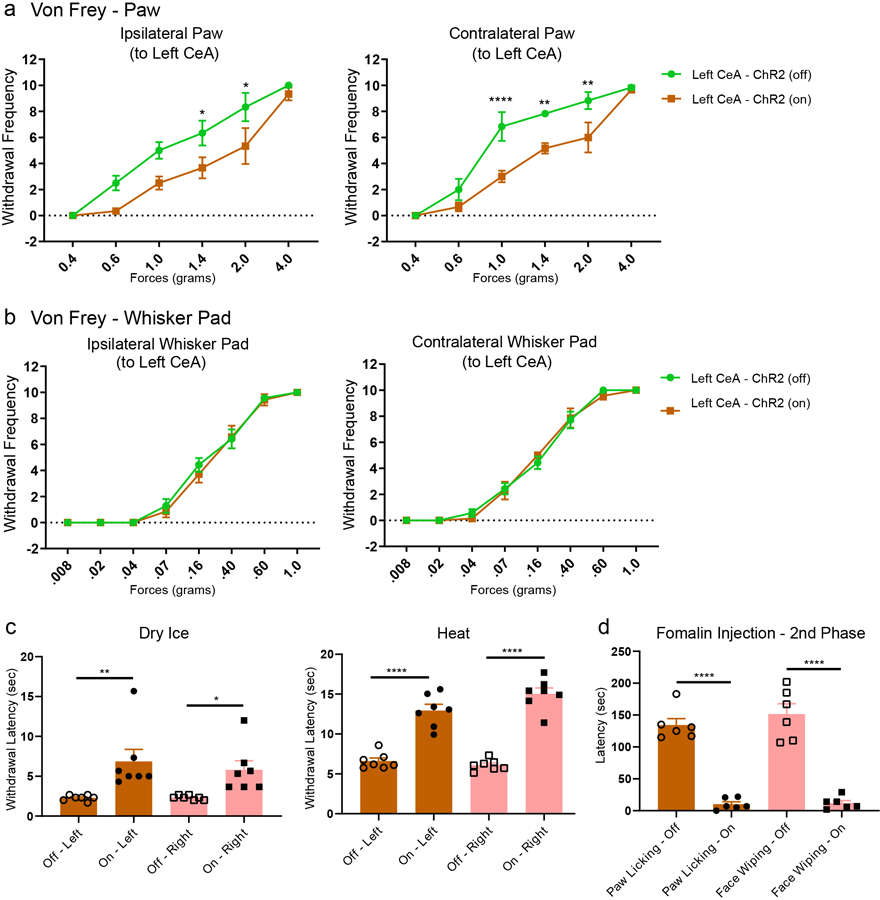
Extended Data Fig. 6
Activation of the left CeA GA neurons modulated pain-related behaviors in nau00efve mice and acute pain models.
a , Quantification of effects of optogenetic activation of the left CeA GA neurons on the paw withdrawal frequency to six graded von Frey filaments ranging from 0.4 to 4.0 grams applied to the ipsilat...
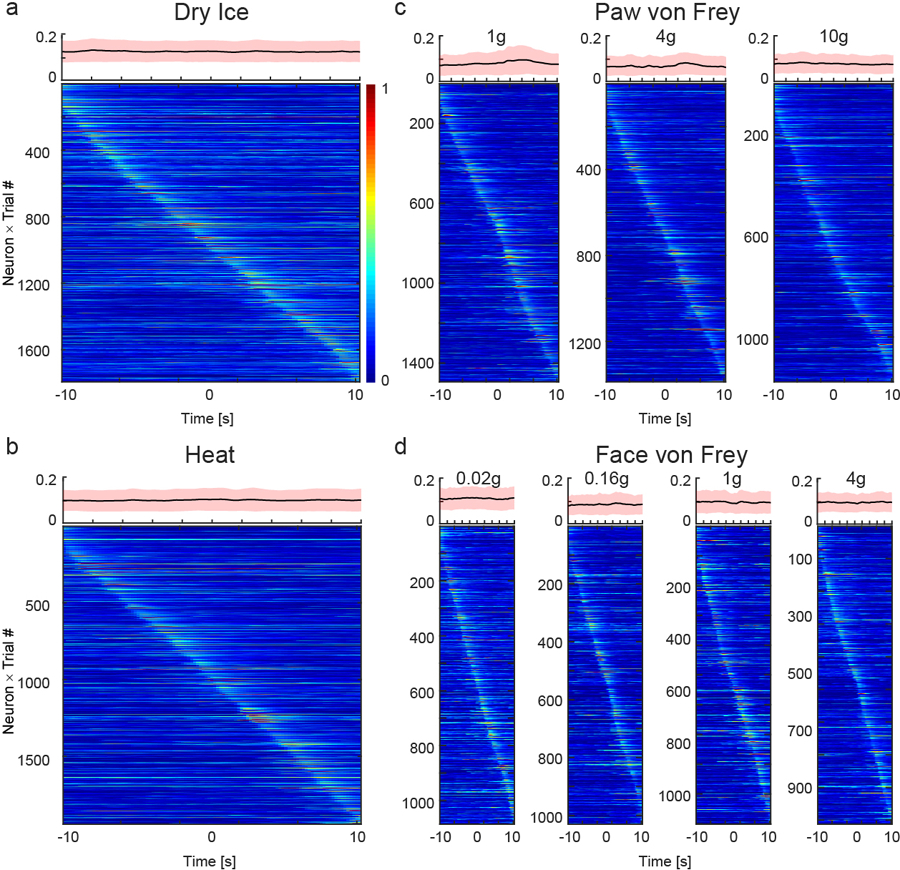
Extended Data Fig. 7
CeA GA activities are not correlated to the onsets of sensory stimuli.
Neuronal activity patterns during a , cold, b , heat, c , paw von Frey, and d , face von Frey tests sorted by neurons peak responses timing: from u221210 to +10 sec, with 0 as the onset of stimulus ap...
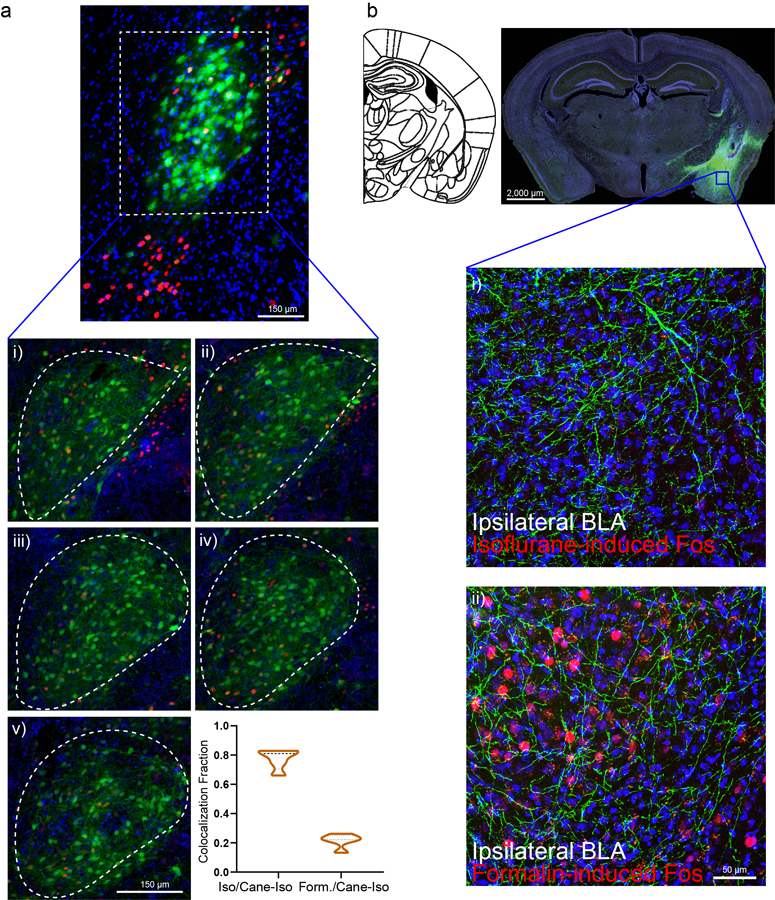
Extended Data Fig. 8
CeA GA neurons are distinct from pain-activated neurons in CeA and high magnification image of CeA GA neurons projection into the ipsilateral BLA.
a , CeA GA neurons have minimal co-localization with formalin-induced Fos+ cells. Formalin-activated cells primarily locate in the capsular division of CeA outside the lateral division where CeA GA lo...
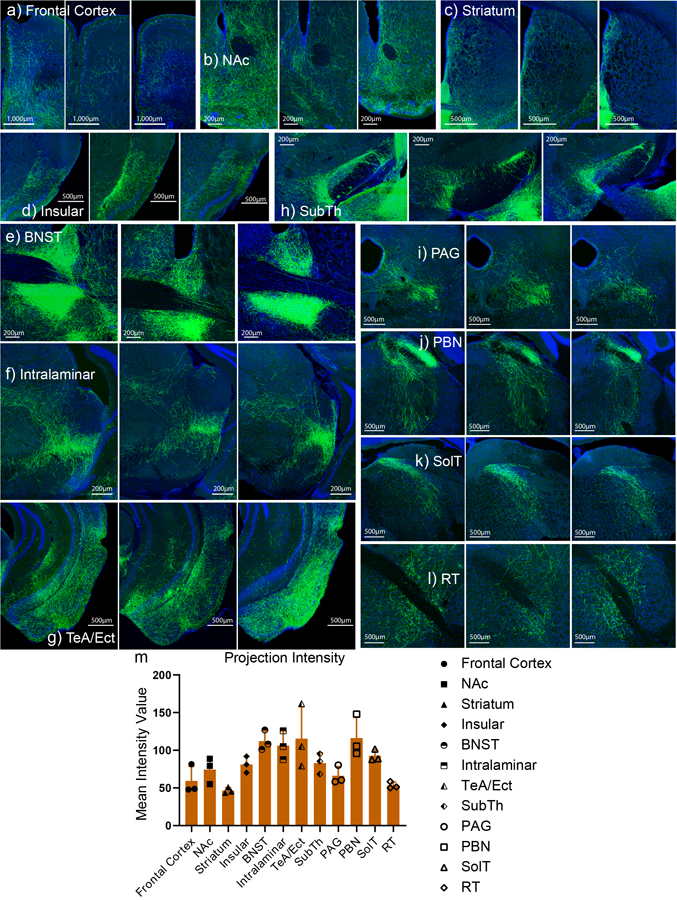
Extended Data Fig. 9
Consistent axonal projections from CeA GA neurons.
In sequential order: a ) frontal cortex, b ) nucleus accumbens (NAc), c ) striatum, d ) insular, e ) bed nucleus stria terminalis (BNST), f ) intralaminar, g ) temporal association cortex (TeA) and ec...
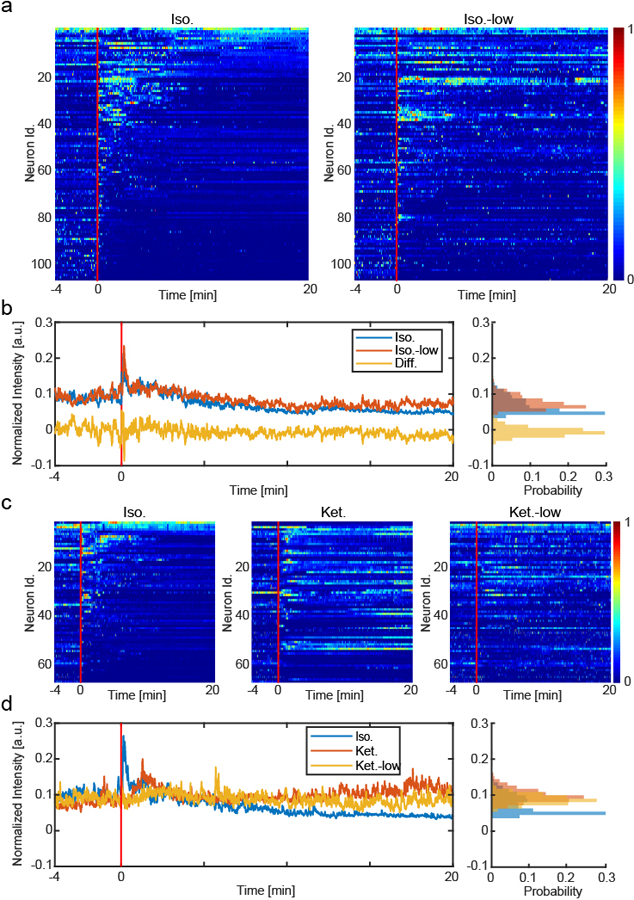
Extended Data Fig. 10
CeA GA neurons are also activated by low dose anesthetics.
a , Heatmaps, activity patterns of the same neurons tracked in isoflurane (1.5%) and low isoflurane (0.5%) experiments, aligned by isoflurane (1.5%) neural patterns. 106 tracked same neurons from 5 mi...
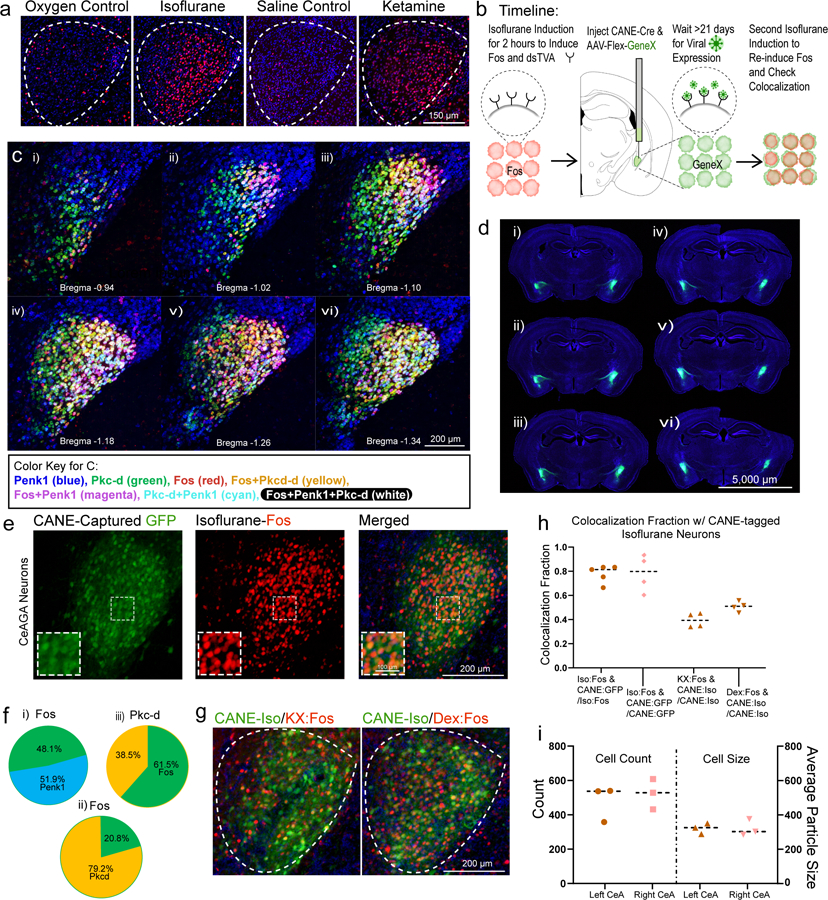
Figure 1 |
Ensembles of neurons in the central amygdala (CeA) are activated by general anesthesia (GA).
a , Representative images of Fos+ neurons in the CeA from exposure to oxygen control, isoflurane, saline control, and ketamine/xylazine injection. Repeated experiments for n=3 biologically independent...
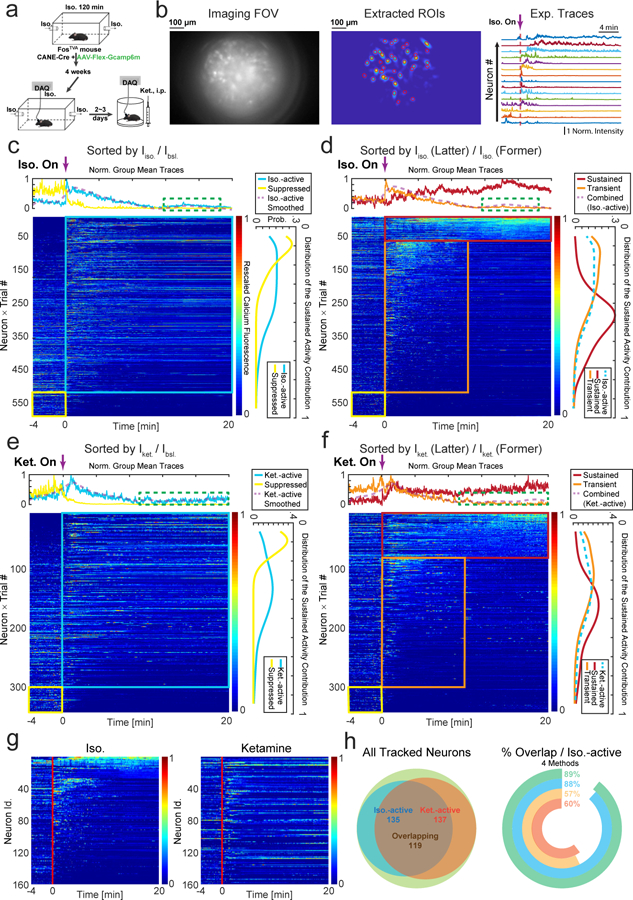
Figure 2 |
Activity patterns of CANE ISO -GCaMP6m captured CeA GA neurons during isoflurane and ketamine GA.
a , Calcium imaging recording of CANE ISO -GCaMP6m captured CeA GA neurons during isoflurane or ketamine induced general anesthesia (GA). b, Left, an example frame from the raw calcium imaging video. ...
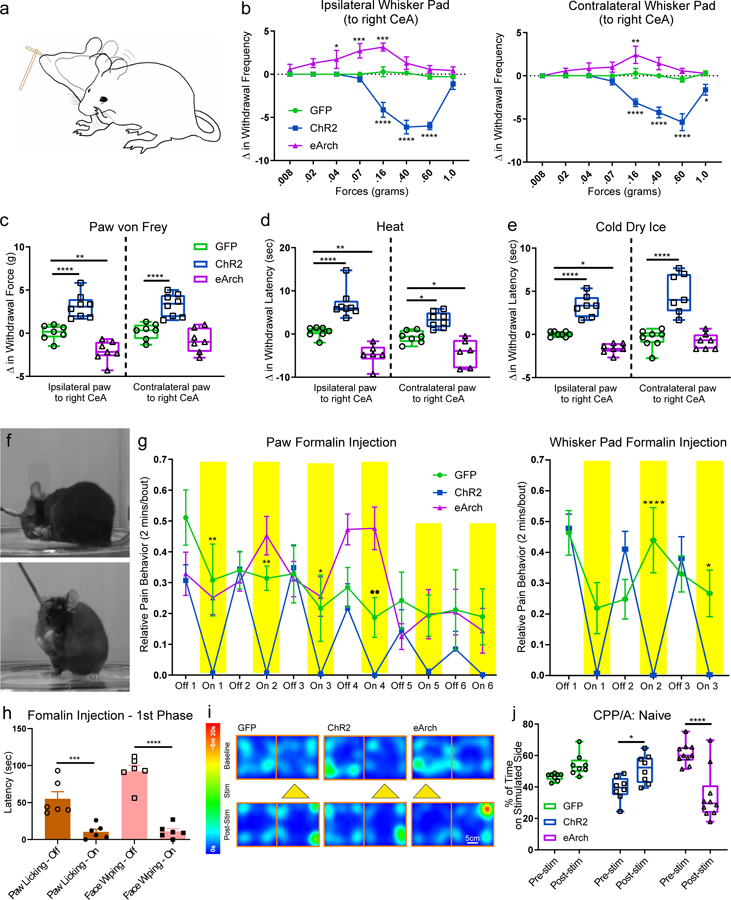
Figure 3 |
Activation or inhibition of CeA GA neurons bi-directionally modulated pain-related behaviors in nau00efve mice and acute pain models.
a , Schematic of the responses to von Frey filaments applied to the whisker pad, including head withdraw and face wiping. b , Quantification of optogenetic manipulation of CeA GA neurons induced chang...
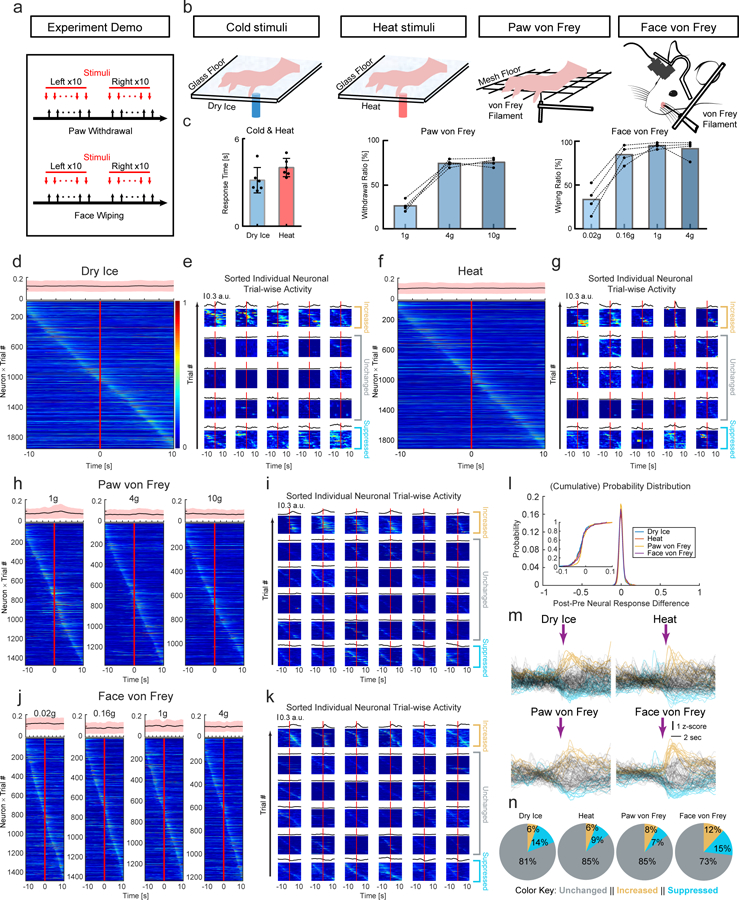
Figure 4 |
In vivo calcium imaging of CeA GA activities in sensory tests.
a, Scheme of nociceptive stimuli on the mice hind paws and facial pads. Red arrows, the onset of stimuli. Black arrows, the onset of withdrawal reflex responses. b, Diagram showing calcium imaging of ...
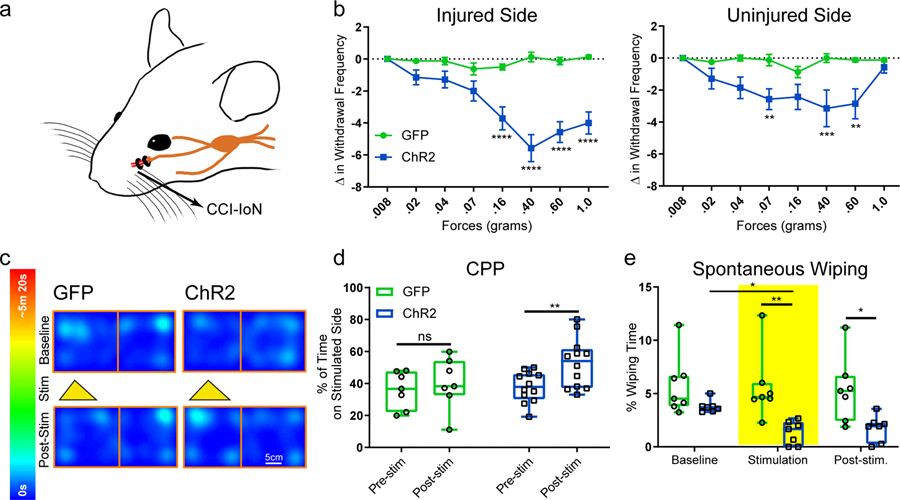
Figure 5 |
Activation of CeA GA neurons strongly reduced nociception-related behaviors in chronic constriction injury model and drove CPP.
a , Schematic of the site of chronic constriction injury of the Infraorbital Nerve. b , Quantification of activating CeA GA induced changes in withdrawal frequency to 8 different von Frey filaments in...
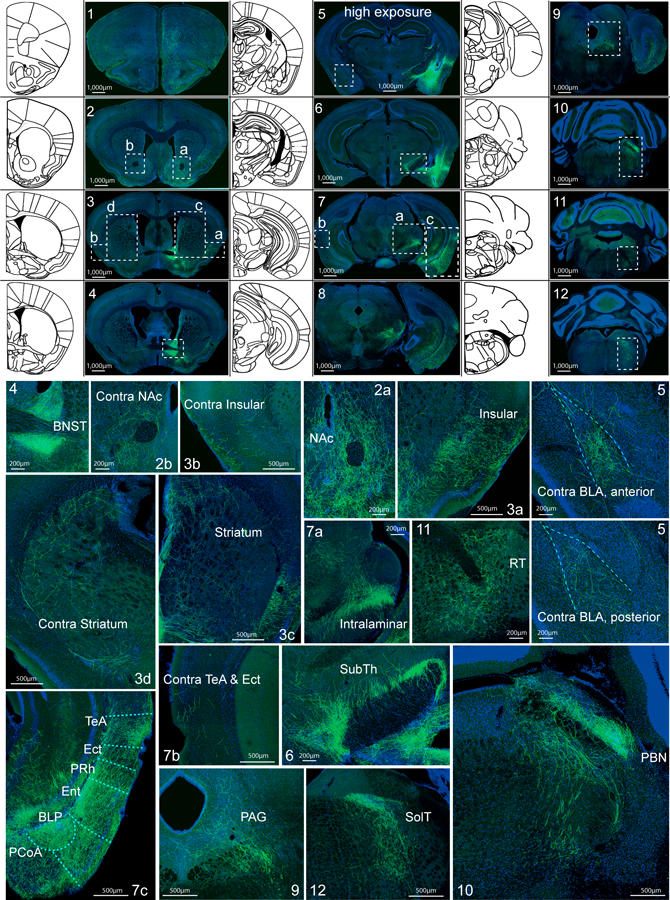
Figure 6 |
Whole brain mapping of axonal projections from CeA GA neurons.
Top half: Coronal schematic next to example coronal slices. Boxes indicate the location of high-magnification zoomed in view of axonal projections. Bottom half: In sequential order: 1 , cortex; 2a , n...
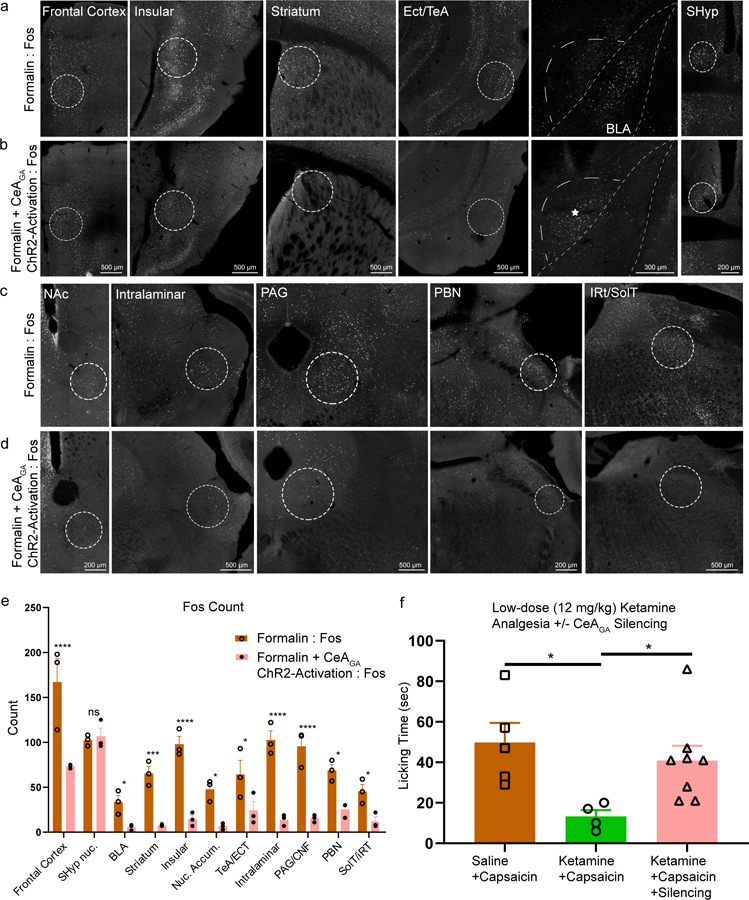
Figure 7 |
Activation of CeA GA neurons reduced formalin-induced activity to all CeA GA target regions and silencing CeA GA blocked the analgesic effect of low- dose ketamine.
a, c , Representative images of strong Fos+ expression induced by formalin. The regions shown here are all CeA GA targets revealed in Figure 6 including: frontal cortex, insular, striatum, ectorhinal ...
Figure images are served from the NIH/NLM PubMed Central Open Access Subset or Europe PMC; copyright remains with the publishers and authors.
💬 Discussion
0 commentsNo comments yet. Be the first to start a discussion!
Leave a Comment