Abstract
BACKGROUND: The incidence of ischemic cerebrovascular disease is increasing in recent years and has been one of the leading causes of neurological dysfunction and death. Ginsenoside Rg1 has been found to protect against neuronal damage in many neurodegenerative diseases. However, the effect and mechanism by which Rg1 protects against cerebral ischemia-reperfusion injury (CIRI) are not fully understood. Here, we report the neuroprotective effects of Rg1 treatment on CIRI and its possible mechanisms in mice. METHODS: A bilateral common carotid artery ligation was used to establish a chronic CIRI model in mice. HT22 cells were treated with Rg1 after OGD/R to study its effect on [Ca2+]i. The open-field test and pole-climbing experiment were used to detect behavioral injury. The laser speckle blood flowmeter was used to measure brain blood flow. The Nissl and H&E staining were used to examine the neuronal damage. The Western blotting was used to examine MAP2, PSD95, Tau, p-Tau, NOX2, PLC, p-PLC, CN, NFAT1, and NLRP1 expression. Calcium imaging was used to test the level of [Ca2+]i. RESULTS: Rg1 treatment significantly improved cerebral blood flow, locomotion, and limb coordination, reduced ROS production, increased MAP2 and PSD95 expression, and decreased p-Tau, NOX2, p-PLC, CN, NFAT1, and NLRP1 expression. Calcium imaging results showed that Rg1 could inhibit calcium overload and resist the imbalance of calcium homeostasis after OGD/R in HT22 cells. CONCLUSION: Rg1 plays a neuroprotective role in attenuating CIRI by inhibiting oxidative stress, calcium overload, and neuroinflammation.
🔬 Techniques
🔭 Microscopes
✨ Fluorophores
🧪 Sample Preparation
🏭 Microscope Brands
🧪 Reagent Suppliers
💻 Software Details
🏛️ Research Organizations (ROR)
Affiliated research institutions:
📋 Methods
A bilateral common carotid artery ligation was used to establish a chronic CIRI model in mice. HT22 cells were treated with Rg1 after OGD/R to study its effect on [Ca 2+ ] i . The open-field test and pole-climbing experiment were used to detect behavioral injury. The laser speckle blood flowmeter was used to measure brain blood flow. The Nissl and H&E staining were used to examine the neuronal damage. The Western blotting was used to examine MAP2, PSD95, Tau, p-Tau, NOX2, PLC, p-PLC, CN, NFAT1, and NLRP1 expression. Calcium imaging was used to test the level of [Ca 2+ ] i .
2 Materials and methods 2.1 Chemicals and reagents Rg1 (>98 %) was purchased from Chengdu Desite Biotechnology Co., China. The tempol and apocynin were obtained from Merck Millipore.
Animals
The male 3-month-old ICR mice (30–40 g) were obtained from the Laboratory Animal Center of Anhui Medical University and raised in a light/dark cycle for 12 h, humidity and temperature (22–24 °C) control room. The animals were then randomized into 6 groups (n = 14): sham operation group (Sham); cerebral I/R group (model); apocynin (50 mg/kg) group, tempol (50 mg/kg) group, and Rg1 (5, 10 mg/kg) groups. The drugs were administered by gavage (0.1 ml/10 g) before cerebral I/R for 5 days and after cerebral I/R for 14 days. The sham and model groups were given distilled water by gavage (0.1 ml/10 g). All tests were endorsed by the Research facility Creature Morals Committee of Anhui Medical University.
Cells culture and treatment
HT22 cells were cultured in the high-sugar DMEM medium in supplementation with 10 % FBS solution in 5 % CO 2 at 37 °C. When the cells reached about 70 % in the high-sugar serum medium, they were replaced with the sugar-free medium and incubated in a triple-gas incubator (N 2 :O 2 :CO 2 = 94:1:5) for 6 h. Then the cells were supplanted with the high-sugar serum-free medium and reoxygenated for 24 h in a normoxic incubator by adding the corresponding drugs in each group. Experimental groups: control group, OGD/R group, tempol (50 μM) group, apocynin (50 μM) group and Rg1 (5, 10 μM) group. Bilateral common carotid artery ligation and reperfusion and lLaser speckle blood flowmeter measurement The animals were anesthetized by using pentobarbital sodium (0.35 %, 0.1 ml/10 g) by intraperitoneal injection. The mice were fixed supine and both common carotid arteries were exposed and isolated. Insert threads under the common carotid artery and place the fishing line parallel to the common carotid artery, and ligate the bilateral common carotid arteries together with the fishing line to prevent the blood for 1 h. Then pull out the fishing lines and cut the threads for reperfusion. For laser speckle blood flowmeter measurement, the mice (n = 5) were firstly fixed prone. The skin of the head is cut about 1 cm, the subcutaneous fascia is separated and the skull is exposed to detect the brain blood flow. Then the mice were performed the cerebral I/R. Blood flow is detected by using the PeriCam Perfusion Speckle Imager System (Perimed, Järfälla, Sweden) in each mouse before cerebral ischemia, after cerebral ischemia 40 min, and after reperfusion 20 min. The average blood flow of the three detection points was calculated to indicate the changes in blood flow. Open field test (OFT) The OFT was employed to detect the activities of mice after the cerebral I/R 14 days. Briefly, the mice (n = 8) were put in the middle of the box to adapt to the environment for 2 min, then the movements of the mice were recorded by the behavioral tracking system (ANY-maze software, Stoeling Company) for 3 min. The total moving distance (TMD, m), the mean moving speed (MMS, m/s), and the line crossing and standing up times were recorded respectively to indicate the motor and exploratory behavior. Pole-climbing test (PCT) The PCT was carried out after the cerebral I/R 14 days. A cork ball of 3 cm in diameter was fixed on the top of the stick. The mice (n = 8) were placed head up upon the ball, then the time that the mice turned around on the ball and the time that the mice climbed the whole pole were recorded. All mice need to be trained three times to familiarize themselves with the whole process before testing.
Show full methods section
A bilateral common carotid artery ligation was used to establish a chronic CIRI model in mice. HT22 cells were treated with Rg1 after OGD/R to study its effect on [Ca 2+ ] i . The open-field test and pole-climbing experiment were used to detect behavioral injury. The laser speckle blood flowmeter was used to measure brain blood flow. The Nissl and H&E staining were used to examine the neuronal damage. The Western blotting was used to examine MAP2, PSD95, Tau, p-Tau, NOX2, PLC, p-PLC, CN, NFAT1, and NLRP1 expression. Calcium imaging was used to test the level of [Ca 2+ ] i .
2 Materials and methods 2.1 Chemicals and reagents Rg1 (>98 %) was purchased from Chengdu Desite Biotechnology Co., China. The tempol and apocynin were obtained from Merck Millipore.
Animals
The male 3-month-old ICR mice (30–40 g) were obtained from the Laboratory Animal Center of Anhui Medical University and raised in a light/dark cycle for 12 h, humidity and temperature (22–24 °C) control room. The animals were then randomized into 6 groups (n = 14): sham operation group (Sham); cerebral I/R group (model); apocynin (50 mg/kg) group, tempol (50 mg/kg) group, and Rg1 (5, 10 mg/kg) groups. The drugs were administered by gavage (0.1 ml/10 g) before cerebral I/R for 5 days and after cerebral I/R for 14 days. The sham and model groups were given distilled water by gavage (0.1 ml/10 g). All tests were endorsed by the Research facility Creature Morals Committee of Anhui Medical University.
Cells culture and treatment
HT22 cells were cultured in the high-sugar DMEM medium in supplementation with 10 % FBS solution in 5 % CO 2 at 37 °C. When the cells reached about 70 % in the high-sugar serum medium, they were replaced with the sugar-free medium and incubated in a triple-gas incubator (N 2 :O 2 :CO 2 = 94:1:5) for 6 h. Then the cells were supplanted with the high-sugar serum-free medium and reoxygenated for 24 h in a normoxic incubator by adding the corresponding drugs in each group. Experimental groups: control group, OGD/R group, tempol (50 μM) group, apocynin (50 μM) group and Rg1 (5, 10 μM) group. Bilateral common carotid artery ligation and reperfusion and lLaser speckle blood flowmeter measurement The animals were anesthetized by using pentobarbital sodium (0.35 %, 0.1 ml/10 g) by intraperitoneal injection. The mice were fixed supine and both common carotid arteries were exposed and isolated. Insert threads under the common carotid artery and place the fishing line parallel to the common carotid artery, and ligate the bilateral common carotid arteries together with the fishing line to prevent the blood for 1 h. Then pull out the fishing lines and cut the threads for reperfusion. For laser speckle blood flowmeter measurement, the mice (n = 5) were firstly fixed prone. The skin of the head is cut about 1 cm, the subcutaneous fascia is separated and the skull is exposed to detect the brain blood flow. Then the mice were performed the cerebral I/R. Blood flow is detected by using the PeriCam Perfusion Speckle Imager System (Perimed, Järfälla, Sweden) in each mouse before cerebral ischemia, after cerebral ischemia 40 min, and after reperfusion 20 min. The average blood flow of the three detection points was calculated to indicate the changes in blood flow. Open field test (OFT) The OFT was employed to detect the activities of mice after the cerebral I/R 14 days. Briefly, the mice (n = 8) were put in the middle of the box to adapt to the environment for 2 min, then the movements of the mice were recorded by the behavioral tracking system (ANY-maze software, Stoeling Company) for 3 min. The total moving distance (TMD, m), the mean moving speed (MMS, m/s), and the line crossing and standing up times were recorded respectively to indicate the motor and exploratory behavior. Pole-climbing test (PCT) The PCT was carried out after the cerebral I/R 14 days. A cork ball of 3 cm in diameter was fixed on the top of the stick. The mice (n = 8) were placed head up upon the ball, then the time that the mice turned around on the ball and the time that the mice climbed the whole pole were recorded. All mice need to be trained three times to familiarize themselves with the whole process before testing.
Hyphology
The mice (n = 4) were performed cardiac perfusion with saline and 4 % paraformaldehyde. The brain tissue was removed and placed in 4 % paraformaldehyde for 24 h. The brain tissue was embedded in paraffin and sliced into 5 μm sections for H&E staining and Nissl staining. The neuronal morphology and the changes of Nissl bodies in the cortex, hippocampal CA1 and CA3 were observed with a microscope (Olympus IX72, Japan). For the Nissl staining, the density from three random fields (400 × ) in each area of cortex, hippocampus CA1 and CA3 was measured by using the Image-Pro Plus (IPP) 6.0 to evaluate the changes of Nissl bodies in neurons.
DHE fluorescence staining Dihydroethidium
(DHE), a superoxide fluorescent probe reagent, is commonly used to label the ROS in living cells. The mice (n = 3) were injected from the tail vein with DHE working solution (0.33 g/L, 0.1 ml/10 g) after I/R 24 h. Thirty minutes later, the brain tissues were taken out and frozen at −20 °C in OCT (Sakura, Torrance, USA). The brain tissue was sectioned into 10 μm slices with a freezing microtome (Leica CM3050, Germany) at −20 °C. Then the slices were stained with Hoechst 33,258 for 2 min. The fluorescence microscope was used to photograph the DHE and Hoechst. The red fluorescence density was measured using IPP 6.0 from three random fields in each area of cortex, hippocampus CA1, and CA3 to indicate ROS production.
Western blotting
The brain tissues (n = 3) of the cortex and hippocampus or HT22 cells were adopted to extract the total proteins by using RIPA lysate (containing 1 % protease and phosphatase inhibitors). Then protein was separated with SDS-PAGE gel (10%) electrophoresis and further transferred to the PVDF membrane (Millipore, Bedford, USA). Then the membrane was sealed in the closed buffer for 1 h and further treated with primary antibodies overnight at 4 °C (Supplementary Table S1). Then the membrane was followed by secondary antibodies for 1 h at 25 °C. After three washes in TBST, the results were visualized by using the Imaging System (Chemi-Doc MP, Bio-Rad, Britain). Protein band density was measured using Image J and normalized to β-actin. Then the relative density was used to indicate the expression of the target protein.
Calcium imaging
The cells were seeded in a 35 mm dish and performed OGD/R and drug treatment. After 24 h of reoxygenation, replaced with fluorescent dye solution (DMEM: F-127: Fura-2 AM = 500: 1: 1) for 20 min, and then washed 3 times with artificial extracellular solution.
Fluorescence of Fura-2
AM was measured at 340 nm (F340) and 380 nm (F380) under alternating excitation per second using an Olympus Digital Calcium Imaging System (IX73, DG-4PLUS/OF30, Japan). Images were acquired for 300s to obtain baseline Ca 2+ levels with extracellular Ca 2+ (1 mM). The extracellular solution was then replaced by adding BAPTA (1 mM, MedChemExpress, USA) or CaCl 2 (Ca 2+ , 2 mM) and the ratio (F340/F380) was recorded. The △ratio (F340/F380) was calculated to indicate the change of [Ca 2+ ] i levels before and after treatment with BAPTA or high calcium solution. The experiments were performed at least three independent experiments.
Data analysis
All data are showed as mean ± standard deviation. Statistical differences were analyzed by using GraphPad Prism 6. And one-way ANOVA was employed to compare differences among groups, the Tukey's test was used to compare the differences between groups. P < 0.05 was regarded as statistical significance.
Appendix A Supplementary data
The following are the Supplementary data to this article: Multimedia component 1 Multimedia component 1 Multimedia component 2 Multimedia component 2 Multimedia component 3 Multimedia component 3
📊 Figures
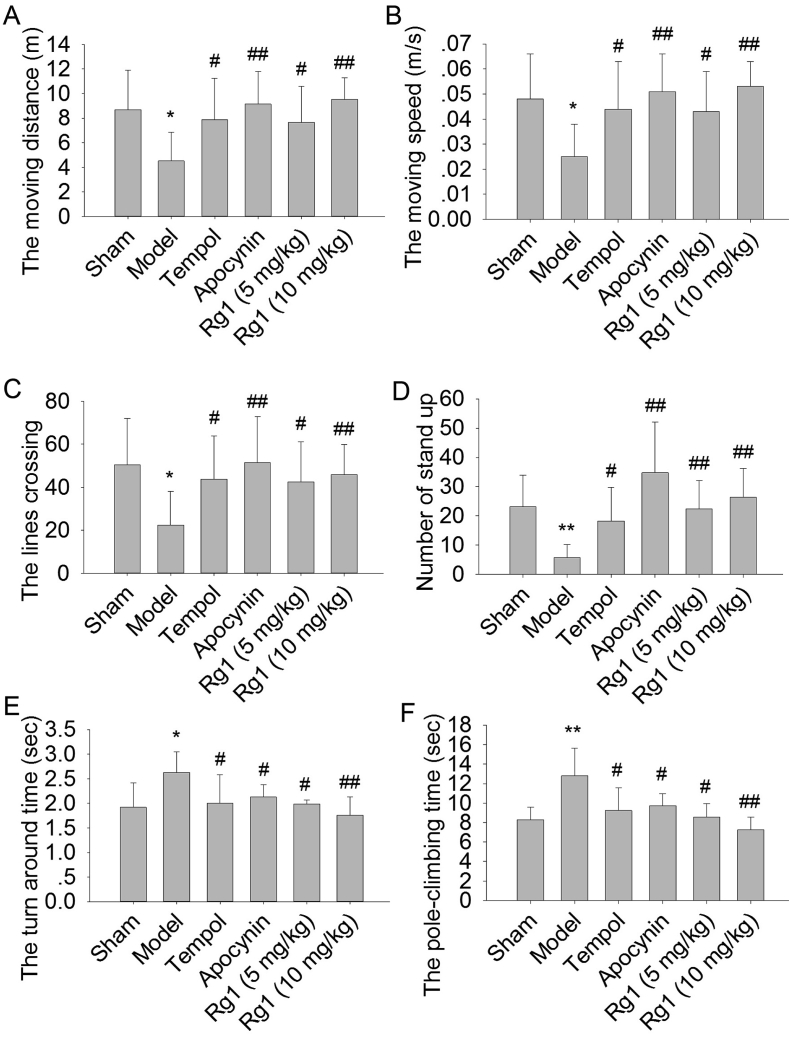
Fig.u00a01
Impacts of Rg1 on spontaneous movement and motor coordination in cerebral I/R mice. (A) The moving distance (m); (B) The moving speed (m/s); (C) The lines crossing; (D) The number of standing up; (E) ...
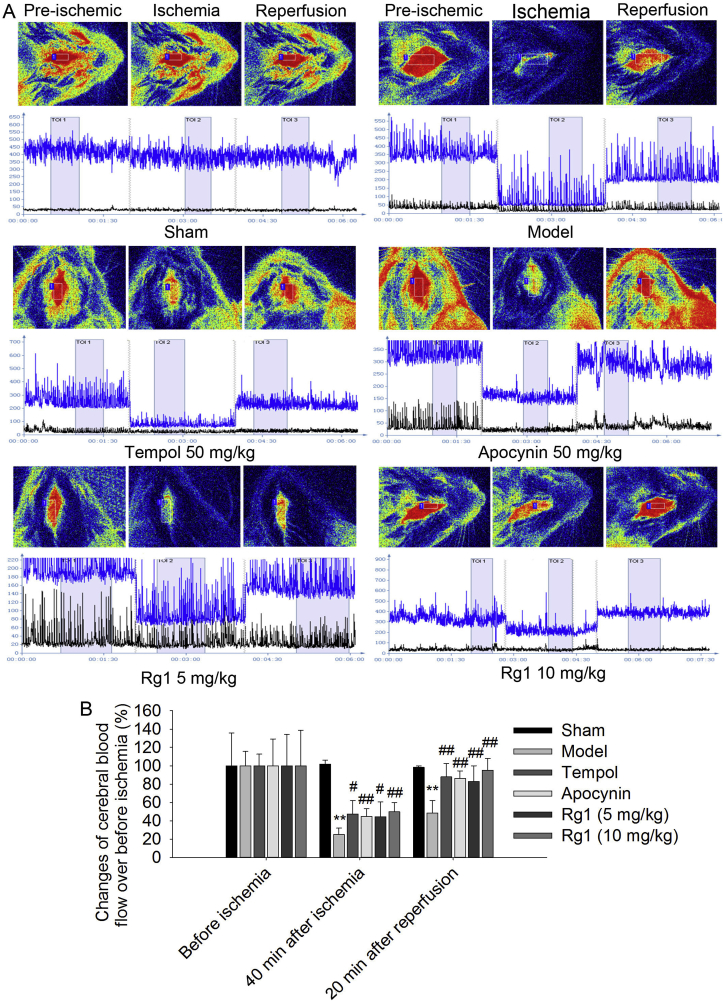
Fig.u00a02
Impacts of Rg1 on cerebral bloodstream in cerebral I/R mice. (A) Laser speckle contrast imaging. (B) The examination of relative changes of cerebral blood flow over before ischemia. Data are shown as ...
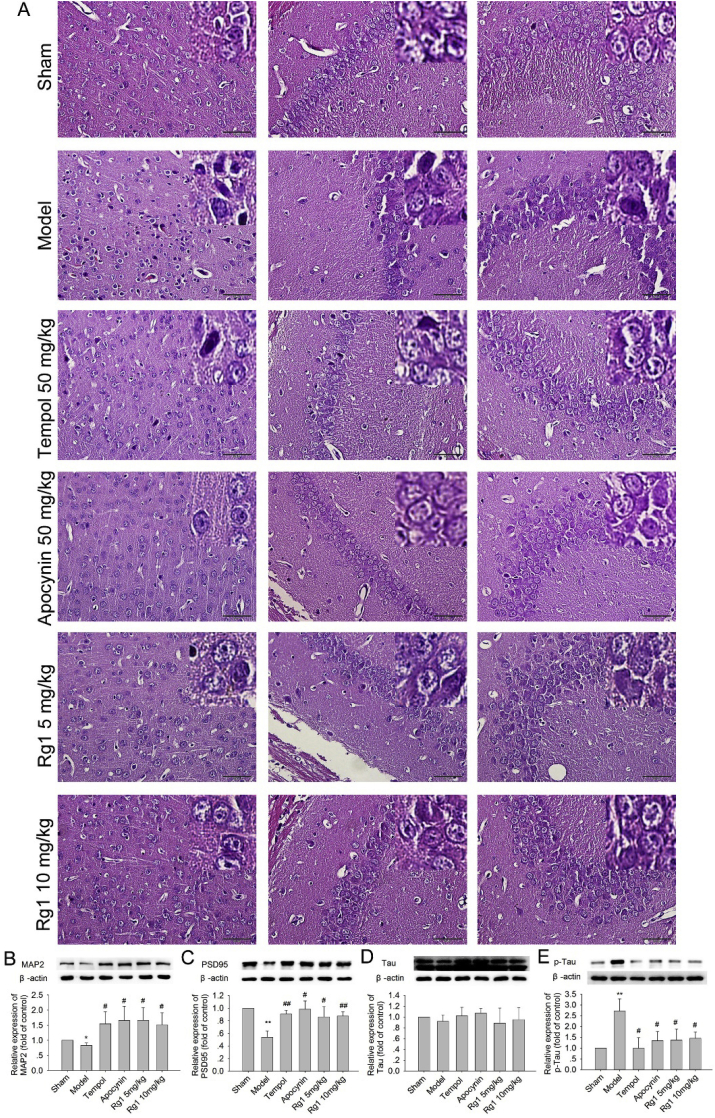
Fig.u00a03
Impacts of Rg1 on neuropathological variation and the expressions of MAP2, PSD95, TAU, and p-TAU in cerebral I/R mice. (A) Changes of pathological morphology (nu00a0=u00a04). (Bu2013E) The relative ex...
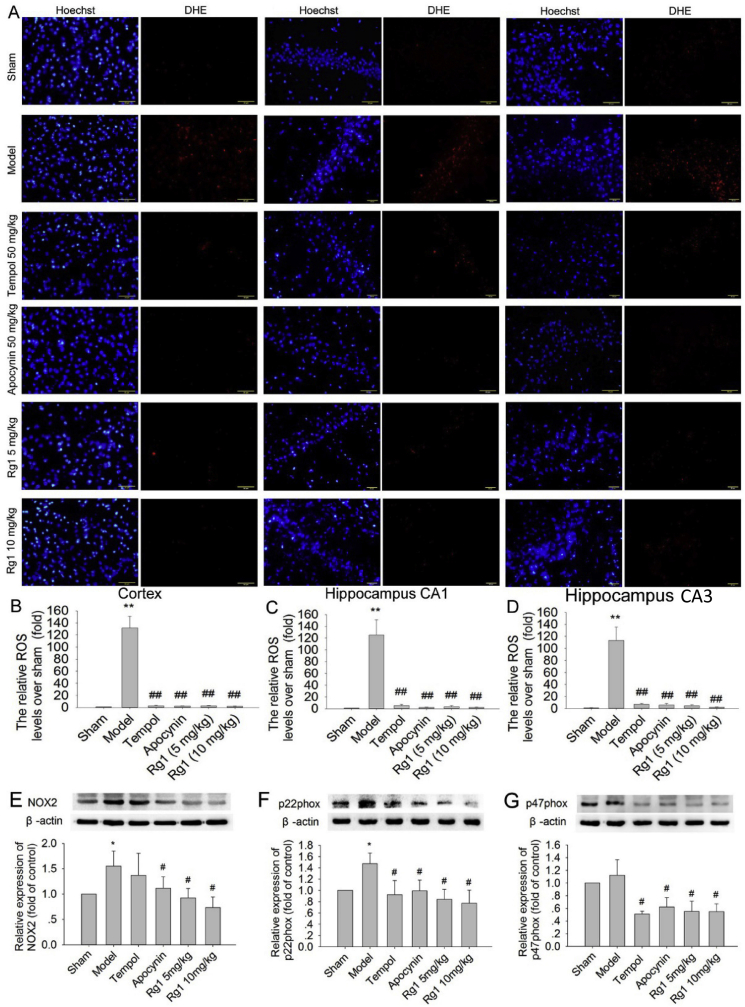
Fig.u00a04
Impacts of Rg1 treatment for ROS production and the expressions of NOX2-related protein in cerebral I/R mice. (A) The ROS accumulation (nu00a0=u00a04). (Bu2013D) Analysis of the relative ROS levels ov...
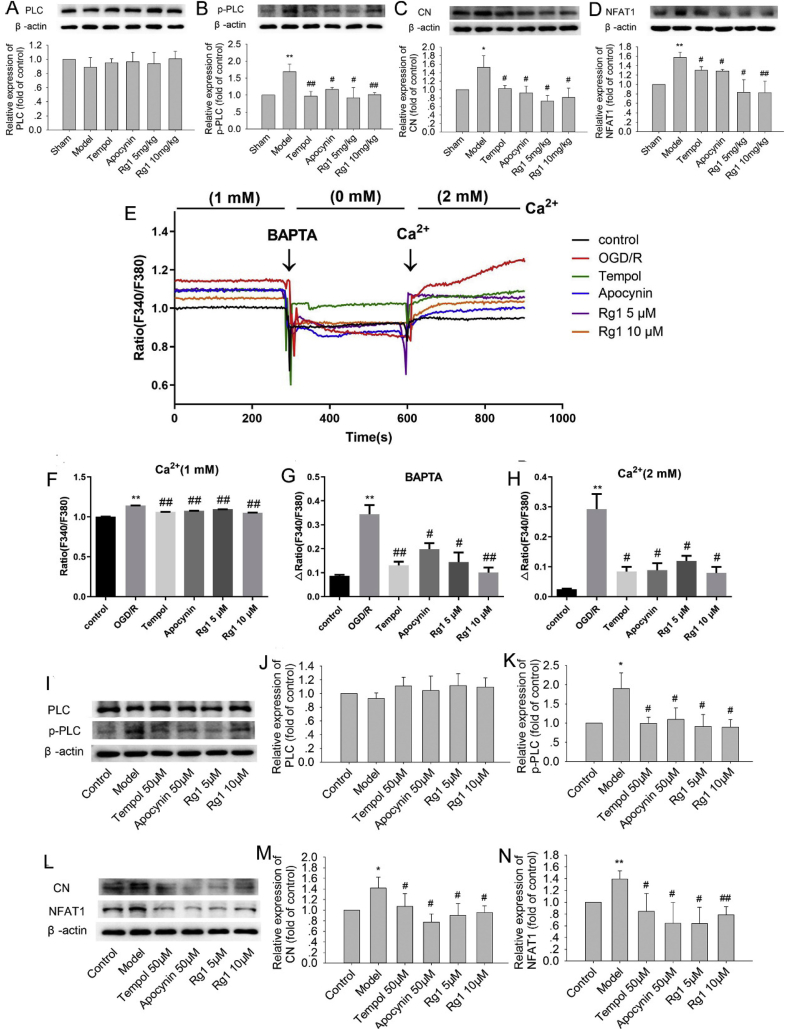
Fig.u00a05
Impacts of Rg1 on [Ca 2+ ] i in OGD/R HT22u00a0cells and the expressions of PLC, p-PLC, CN, and NFAT1 inu00a0vivo and vitro. (Au2013D) The relative expressions of PLC, p-PLC, CN, and NFAT1 in cerebral...
Figure images are served from the NIH/NLM PubMed Central Open Access Subset or Europe PMC; copyright remains with the publishers and authors.
💬 Discussion
0 commentsNo comments yet. Be the first to start a discussion!
Leave a Comment