Abstract
Transient receptor potential vanilloid member 1 (TRPV1) is a Ca2+-permeable cation channel that serves as the primary heat and capsaicin sensor in humans. Using cryo-EM, we have determined the structures of apo and capsaicin-bound full-length rat TRPV1 reconstituted into lipid nanodiscs over a range of temperatures. This has allowed us to visualize the noxious heat-induced opening of TRPV1 in the presence of capsaicin. Notably, noxious heat-dependent TRPV1 opening comprises stepwise conformational transitions. Global conformational changes across multiple subdomains of TRPV1 are followed by the rearrangement of the outer pore, leading to gate opening. Solvent-accessible surface area analyses and functional studies suggest that a subset of residues form an interaction network that is directly involved in heat sensing. Our study provides a glimpse of the molecular principles underlying noxious physical and chemical stimuli sensing by TRPV1, which can be extended to other thermal sensing ion channels.
🔬 Techniques
🔭 Microscopes
🧬 Organisms
💻 Software
✨ Fluorophores
🧪 Sample Preparation
🔬 Cell Lines
🏭 Microscope Brands
🧪 Reagent Suppliers
📷 Detectors
💻 Software Details
💾 Data Repositories
🏛️ Research Organizations (ROR)
Affiliated research institutions:
📋 Methods
TRPV1 Protein expression and purification The Rattus norvegicus full-length TRPV1 was cloned into the pEG BacMam vector 51 , in-frame with a FLAG-tag and 10× His-tag at C-terminus. All structural studies were performed using the wild-type (WT) rat TRPV1 construct. Baculovirus was generated according to manufacturer’s protocol (Bac-to-Bac, Invitrogen). For rat TRPV1 protein expression, HEK293S GnTI − cells (ATCC) was cultured in FreeStyle 293 media (Life Technologies) supplemented with 2% (v/v) FBS (Gibco) at 8% (w/v) CO 2 . Cultures at 3×10 6 mL −1 cell density were infected with 6% (v/v) P3 baculovirus. After 20-22 hrs of shaking incubation at 37°C, 10 mM sodium butyrate (Sigma-Aldrich) was added and the temperature was lowered to 30°C to boost protein expression. After 40-44 hrs, the cells were harvested by centrifugation at 550× g and were subsequently resuspended in lysis buffer (20 mM Tris pH 8, 150 mM NaCl, 12 μg mL −1 leupeptin, 12 μg mL −1 pepstatin, 12 μg mL −1 aprotinin, 2 μg mL −1 DNase I, 1 mM phenylmethylsulphonyl fluoride (PMSF), and 1% (w/v) digitonin). Membrane protein extraction was performed at 4°C for 1 hr, followed by centrifugation at 13000× g for 30 min to remove insoluble material. The supernatant was subsequently incubated with anti-FLAG M2 resin (Sigma-Aldrich) at 4°C for 1 hr to allow protein binding. The resin was then packed onto a gravity-flow column (BioRad), and washed with 10 column volumes of wash buffer (20 mM Tris pH 8, 150 mM NaCl, 0.07% digitonin). The TRPV1 protein was then eluted with 5 column volumes of elution buffer (20 mM Tris pH 8, 150 mM NaCl, 0.07% digitonin, 100 μg mL −1 FLAG peptide (GenScript)). The eluted protein was collected and subjected for nanodiscs reconstitution. Nanodiscs Reconstitution MSP2N2 was purified according to the previously published protocol 52 . FLAG-purified TRPV1 was concentrated to 1-1.5 mg mL −1 , and mixed with purified MSP2N2 and lipid mix [1-palmitoyl-2-oleoyl-sn-glycero-3-phosphocholine (POPC), 1-palmitoyl-2-oleoyl-sn-glycero-3-phosphoethanolamine (POPE), 1-palmitoyl-2-oleoyl-sn-glycero-3-phospho-(1'-rac-glycerol) (POPG), Avanti Polar Lipids; POPC:POPE:POPG=3:1:1] at 1:3:200 molar ratio, where TRPV1 was treated as tetramer in molar ratio calculations. The mixture was incubated at 4°C for 30 min with constant rocking. Subsequently, 100 mg mL −1 Bio-Beads SM2 (Bio-Rad) was added to the mixture to initiate the reconstitution reaction. The Bio-Beads were exchanged with a fresh batch after two hours (100 mg mL −1 ), and the mixture was incubated with constant rocking at 4°C for 12-15 hrs. The sample was then subjected to size exclusion chromatography on a Superose 6 Increase 10/300 GL column (Cytiva) pre-equilibrated with buffer containing 20 mM HEPES pH 7.5, 150 mM NaCl.
Show full methods section
TRPV1 Protein expression and purification The Rattus norvegicus full-length TRPV1 was cloned into the pEG BacMam vector 51 , in-frame with a FLAG-tag and 10× His-tag at C-terminus. All structural studies were performed using the wild-type (WT) rat TRPV1 construct. Baculovirus was generated according to manufacturer’s protocol (Bac-to-Bac, Invitrogen). For rat TRPV1 protein expression, HEK293S GnTI − cells (ATCC) was cultured in FreeStyle 293 media (Life Technologies) supplemented with 2% (v/v) FBS (Gibco) at 8% (w/v) CO 2 . Cultures at 3×10 6 mL −1 cell density were infected with 6% (v/v) P3 baculovirus. After 20-22 hrs of shaking incubation at 37°C, 10 mM sodium butyrate (Sigma-Aldrich) was added and the temperature was lowered to 30°C to boost protein expression. After 40-44 hrs, the cells were harvested by centrifugation at 550× g and were subsequently resuspended in lysis buffer (20 mM Tris pH 8, 150 mM NaCl, 12 μg mL −1 leupeptin, 12 μg mL −1 pepstatin, 12 μg mL −1 aprotinin, 2 μg mL −1 DNase I, 1 mM phenylmethylsulphonyl fluoride (PMSF), and 1% (w/v) digitonin). Membrane protein extraction was performed at 4°C for 1 hr, followed by centrifugation at 13000× g for 30 min to remove insoluble material. The supernatant was subsequently incubated with anti-FLAG M2 resin (Sigma-Aldrich) at 4°C for 1 hr to allow protein binding. The resin was then packed onto a gravity-flow column (BioRad), and washed with 10 column volumes of wash buffer (20 mM Tris pH 8, 150 mM NaCl, 0.07% digitonin). The TRPV1 protein was then eluted with 5 column volumes of elution buffer (20 mM Tris pH 8, 150 mM NaCl, 0.07% digitonin, 100 μg mL −1 FLAG peptide (GenScript)). The eluted protein was collected and subjected for nanodiscs reconstitution. Nanodiscs Reconstitution MSP2N2 was purified according to the previously published protocol 52 . FLAG-purified TRPV1 was concentrated to 1-1.5 mg mL −1 , and mixed with purified MSP2N2 and lipid mix [1-palmitoyl-2-oleoyl-sn-glycero-3-phosphocholine (POPC), 1-palmitoyl-2-oleoyl-sn-glycero-3-phosphoethanolamine (POPE), 1-palmitoyl-2-oleoyl-sn-glycero-3-phospho-(1'-rac-glycerol) (POPG), Avanti Polar Lipids; POPC:POPE:POPG=3:1:1] at 1:3:200 molar ratio, where TRPV1 was treated as tetramer in molar ratio calculations. The mixture was incubated at 4°C for 30 min with constant rocking. Subsequently, 100 mg mL −1 Bio-Beads SM2 (Bio-Rad) was added to the mixture to initiate the reconstitution reaction. The Bio-Beads were exchanged with a fresh batch after two hours (100 mg mL −1 ), and the mixture was incubated with constant rocking at 4°C for 12-15 hrs. The sample was then subjected to size exclusion chromatography on a Superose 6 Increase 10/300 GL column (Cytiva) pre-equilibrated with buffer containing 20 mM HEPES pH 7.5, 150 mM NaCl.
Cryo-EM sample preparation and data collection Peak fractions containing nanodisc-reconstituted
TRPV1 from the size exclusion chromatography were concentrated to ~0.8 mg mL −1 . All cryo-EM samples in this study were prepared on freshly glow-discharged UltrAuFoil R1.2/1.3 300 mesh grids (Quantifoil), using a Leica EM GP2 plunge freezer. (i) For TRPV1 4C,APO sample, 3 μL of TRPV1-nanodiscs sample was applied to the grid, blotted for 2 s in the chamber set at 4°C and 95% humidity, followed by plunge-freezing in liquid-ethane cooled by liquid nitrogen. (ii) For TRPV1 48C,APO sample, 10 μl of the TRPV1 sample was incubated in a heat block set at 48°C for 30 s, 3 μL of which was then applied to the grid, blotted for 2 s in the chamber set at 48°C and 80% humidity, followed by plunge-freezing in liquid-ethane cooled by liquid nitrogen. (iii) For TRPV1 4C,CAP sample, TRPV1 sample was mixed with 30 μM capsaicin (Sigma) for 30 min before applying to the grid, blotted for 2 s in the chamber set at 4°C and 95% humidity, then plunge-frozen in liquid-ethane cooled by liquid nitrogen. (iv) For TRPV1 25C,CAP sample, TRPV1 sample was mixed with 30 μM capsaicin for 30 min before applying to the grid, blotted for 2 s in the chamber set at 25°C and 95% humidity, then plunge-froze in liquid-ethane cooled by liquid nitrogen. (v) For TRPV1 48C,CAP sample, TRPV1 sample was mixed with 30 μM capsaicin for 30 min before applying to the grid, incubated in a heat block set at 48°C for 30 s, blotted for 2 s in the chamber set at 48°C and 80% humidity, then plunge-froze in liquid-ethane cooled by liquid nitrogen. For 25°C and 48°C freezing, all the tools (grid, tube, forceps) were equilibrated to the repective temperatures before use. TRPV1 4C,CAP and TRPV1 25C,CAP datasets were collected with a Titan Krios microscope (Thermo Fisher) operating at 300 kV equipped with a K3 detector (Gatan) in counting mode, using the Latitude-S automated data acquisition program. Movie datasets were collected at a nominal magnification of 81,000 × with a pixel size of 1.08 Å/pix at specimen level. Each movie contains 60 frames over a 4.6 s exposure time, using a dose rate of about 15 e − /Å 2 /s, resulting in the total accumulated dose of ~60 e − /Å 2 . The nominal defocus range was set from −1 to −2.25 μm. TRPV1 4C,APO and TRPV1 48C,APO datasets were collected with a Titan Krios microscope (Thermo Fisher) operating at 300 kV equipped with a K3 detector (Gatan) in counting mode with GIF BioQuantum energy filter (slit width 20 eV), using the Serial-EM automated data acquisition program. Movie datasets were collected at a nominal magnification of 81,000 × with a pixel size of 0.5395 Å/pix in super-resolution mode. Each movie contains 74 frames over a 3.5 s exposure time, using a dose rate of about 15 e − /Å 2 /s, resulting at the total accumulated dose of ~50 e − /Å 2 . The nominal defocus range was set from −0.75 to −2.0 μm. TRPV1 48C,CAP dataset was collected with a Titan Krios microscope (Thermo Fisher) operating at 300 kV equipped with a K3 detector (Gatan) in counting mode with GIF BioQuantum energy filter (slit width 20 eV), using the Serial-EM automated data acquisition program. Movie datasets were collected at a nominal magnification of 81,000 × with a pixel size of 0.5295 Å/pix in super-resolution mode. Each movie contains 50 frames over a 2.4 s exposure time, using a dose rate of about 18.5 e − /Å 2 /s, resulting in the total accumulated dose of ~45 e − /Å 2 . The nominal defocus range was set from −0.8 to −1.9 μm.
Cryo-EM data processing
All datasets were processed using a similar procedure. Beam-induced motion correction and dose-weighing were performed using MotionCor2 53 . For TRPV14C,APO, TRPV148C,APO and TRPV148C,CAP datasets, the movies are 2× fourier-binned to 1.079 Å per pixel (TRPV14C,APO and TRPV148C,APO) and 1.059 Å per pixel (TRPV148C,CAP), respectively. The motion corrected micrographs were then subjected to contast transfer function (CTF)estimation using Gctf 54 . Micrographs were subsequently selected based on CTF fit quality and CTF estimated resolution. An initial set of particles were manually picked and subjected to a reference-free 2D classification (k=10, T=2), from which the best 3-5 classes were selected as reference for automated particle picking in RELION 3.0 55 . Particles were extracted by 4x4 Fourier binning with 4.32 Å/pix pixel size and 64 pixel box size. Reference-free 2D classification (k=50, T=2) was performed in RELION and classes showing clear secondary structure features of TRPV1 were selected. These particles were subsequently subjected to 3D auto-refinement in RELION, using a previously published TRPV1 map (EMD-8118, low-passed filtered to 30 Å) as reference without masking. Refined particles were re-extracted, re-centered and un-binned and subjected to another round of 3D refinement, using the result of the previous 3D refinement as a reference. Several rounds of 3D classification without image alignment were then performed using the output from the un-binned 3D refinement, with a soft solvent mask covering the best resolved region of the channel. A single class showing the clearest and the best resolved features was selected and subjected to 3D auto-refinement. If needed, another round of 3D classification was performed followed by 3D refinement in cryoSPARC 56 . Several rounds of CTF refinement and Bayesian polishing were performed, which improved resolution and map quality. Local resolution was calculated using RELION 3.1 or cryoSPARC 56 . Pixel size calibration was performed with the final maps. Model building, refinement, and alignment The model-building process is similar for all structures reported in this paper. A previously published TRPV1 structure (PDB 5IRZ) was used as a reference. During model building the register assignment was guided by the presence of large aromatic side chains. The placement of individual structural elements was performed by rigid body fitting and the structures were manually refined using real space refinement in Coot with ideal geometry restrains 57 . The restraints for lipids and ligands, including POPC, POPE, POPG, and capsaicin, were calculated in Elbow (as implemented in Phenix 58 ) from isomeric SMILES strings and optimized using the REEL QM2 method (as implemented in the Phenix suite 58 ). These were then inspected and adjusted manually to ensure correct stereochemistry before being fitted into the cryo-EM maps in Coot. The MolProbity 59 server ( http://molprobity.biochem.duke.edu ) was utilized to identify problematic regions in the models, which were then manually adjusted in Coot. The final refinement was performed using the phenix-real_space_refine function with global minimization and secondary structure restrains as implemented in the Phenix suite 58 . The Fourier shell correlation of the half- and full-maps against the model, calculated in Phenix, were in good agreement, indicating that the models were not over-refined. Structural analyses and illustrations were performed using PYMOL (Schrödinger) 60 and UCSF Chimera 61 . Structure alignments and cryo-EM density map alignments was performed by Fit In Map in UCSF Chimera. Based on the aligned map, each structural model was aligned to its corresponding map by Fit In Map. Two-electrode voltage clamp electrophysiology in X. laevis oocytes The WT rat TRPV1 DNA was subcloned into the pGEM-HE vector, and the construct was linearized wih SphI, and complementary RNA (cRNA) was synthesized by in vitro transcription using T7 RNA polymerase (Thermo Fisher). All defolliculated oocytes were ordered from Ecocyte (Austin, Texas). Rat TRPV1 cRNA was injected to Xenopus laevis oocytes and incubated at 17°C for 3-4 days in a solution containing (in mM) 96 NaCl, 2 KCl, 1 MgCl 2 , 1.8 CaCl 2 , 5 HEPES, pH 7.6 (with NaOH). For the two-electrode voltage clamp (TEVC) recording, oocyte membrane voltage was controlled using an OC-725C oocyte clamp (Warner Instruments, Hamden, CT). Data were filtered at 1–3 kHz and digitized at 20 kHz using pClamp software (Molecular Devices, Sunnyvale, CA) and a Digidata 1440A digitizer (Axon Instruments). Microelectrode resistances were 0.1–1 MΩ when filled with 3 M KCl. The external recording solution contained 100 mM KCl, 2 mM MgCl 2 , 10 mM HEPES, pH 7.6 (with KOH) and 0.01 mM 2-[(4-methoxy)-2-naphthalenyl)amino]-5-nitro-benzoic acid (Tocris), and 0.01 mM flufenamic acid were added to the recording solution to minimize calcium-activated chloride currents. Capsaicin and Ruthenium Red (RR) were applied using a gravity-fed perfusion system. Voltage was initially held at −60 mV and ramped to +60 mV for 300 ms every 0.5 s. Heat stimuli were achieved by passing the external recording solution through glass capillary coils immersed in a water bath maintained at about 70-80°C, and recordings were performed during constant perfusion with temperature measured using a thermistor (TA-29, Warner Instruments). The thermistor was connected to the digitizer via a temperature controller (TC-324B, Warner Instruments). All data analysis was carried out using Igor Pro 6.3 (Wavemetrics, Portland, OR). Q 10 values were calculated using the equation Q 10 = 10 10 × ( − S A r r h e ) T 1 × T 2 where S Arrhe is the slope of linear fit to Arrhenius plotted data between absolute temperatures T 1 and T 2 62 .
Patch clamp electrophysiology
Whole-cell patch clamp recordings from transiently transfected HEK293T cells were performed at room temperature (22–24°C) and with heat (up to ~50°C) followed. Current responses were low-pass filtered at 2 kHz (Axopatch 200B), digitally sampled at 5–10 kHz (Digidata 1440A), converted to digital files in Clampex10.7 (Molecular Devices) and stored on an external hard drive for offline analyses (Clampfit10.7, Molecular Devices; Excel 2010, Microsoft Office; Igor Pro 6.34A, Wavemetrics). Pipettes were pulled from borosilicate glass and heat-polished to final resistances between 3 and 7 MΩ. Electrodes were filled with an intracellular solution containing (in mM) 140 NaCl, 5 MgCl 2 , 10 HEPES, 5 EGTA, and adjusted to pH 7.4 (NaOH). MgCl 2 was included to both increase the quality of the seals and to block endogenous HEK293T channels. The extracellular solution consisted of (in mM): 140 NaCl, 10 HEPES, 5 EDTA, pH 7.4 (NaOH). For heat activation, we used the same method as described in oocyte temperature recordings above.
Calculation of Solvent Accessible Area
Apolar and polar solvent-accessible surface area (SASA) per residue for the TRPV1 25C,CAP , TRPV1 48C,CAP,INT , and TRPV1 48C,CAP,OPEN structures were calculated using the GETAREA server ( http://curie.utmb.edu/getarea.html ) 63 . Calculations were not done on residues whose side chains could not be built. Heat capacity change, ΔC P , was calculated by the Makhatadze and Privalov’s equation below 46 , using the change in solvent-accessible surface area for non-polar and polar residues (ΔASA npol and ΔASA pol , respectively). Δ C p ( M P ) = 2.14 × Δ A S A n p o l − 0.88 × Δ A S A p o l
📊 Figures
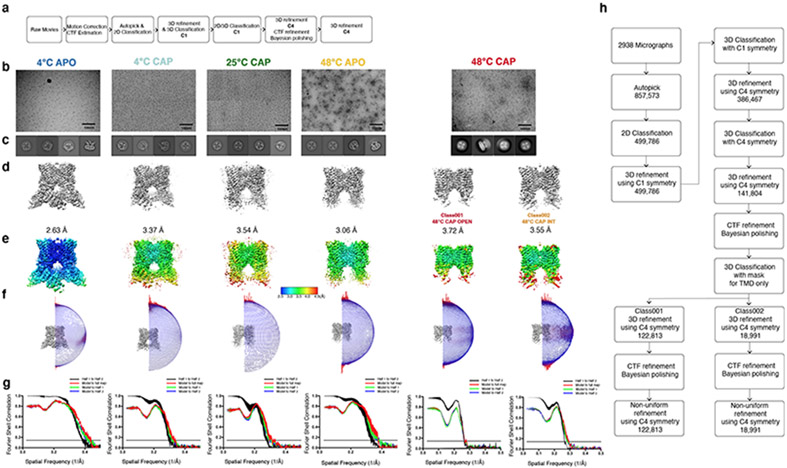
Extended Data Fig. 1
TRPV1 data collection and processing.
Data processing procedures, a , Data processing flow chart for TRPV1 4C,APO , TRPV1 4C,CAP , TRPV1 25C,CAP , TRPV1 48C,APO . b , representative micrographs, see Table 1 for details. c , 2D classificat...
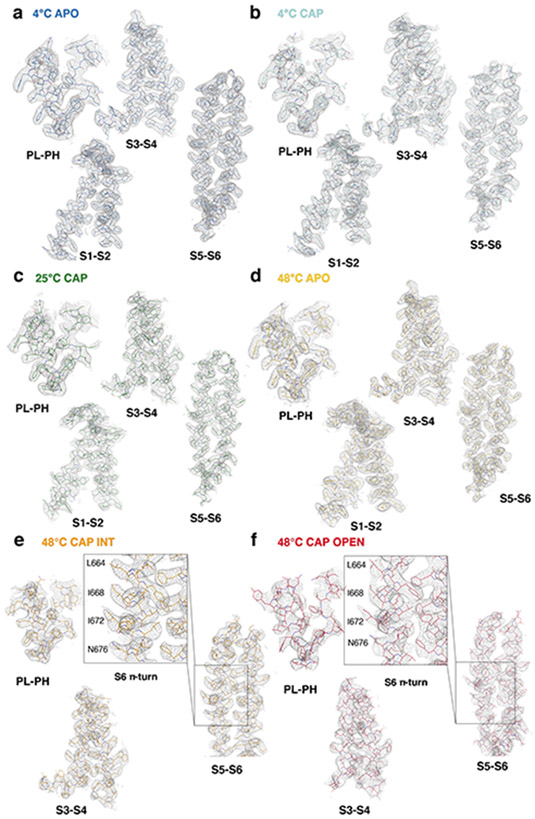
Extended Data Fig. 2
Representative Cryo-EM density of the TRPV1 structures.
a-f , cryo-EM density for subdomains in TRPV1 4C,APO (a , thresholding 0.014), TRPV1 4C,CAP (b , thresholding 0.014), TRPV1 25C,CAP ( c , thresholding 0.025), TRPV1 48C,APO (d , thresholding 0.019), T...
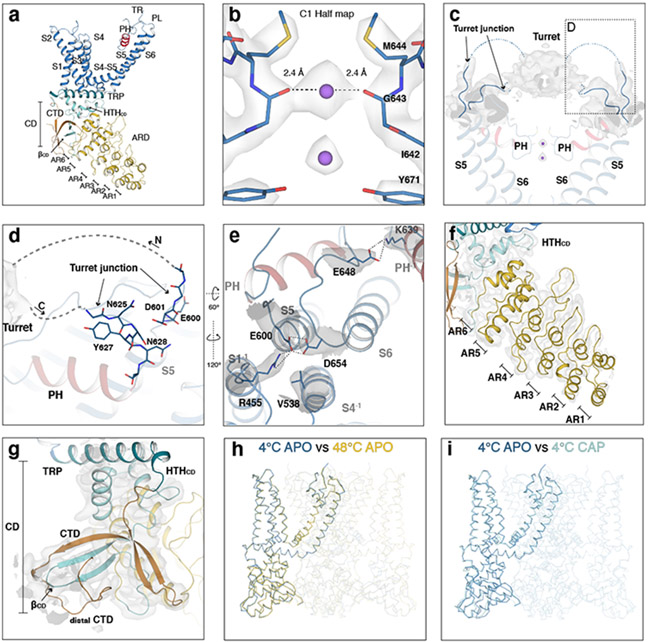
Extended Data Fig. 3
Structural features of the full-length TRPV1.
a , Architecture of the TRPV1 protomer with subdomains indicated: ankyrin repeat domain (ARD), coupling domain (CD), transmembrane helices S1-S6, TRP helix, and C-terminal domain (CTD). b , Cryo-EM de...
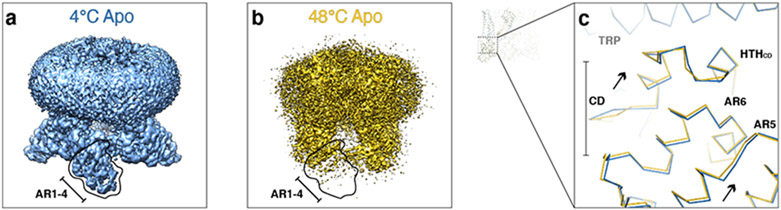
Extended Data Fig. 4
Comparison of TRPV1 4C,APO and TRPV1 48C,APO .
a , b , Cryo-EM 3D reconstructions of TRPV1 4C,APO ( a , blue) and TRPV1 48C,APO ( b , gold), respectively. Outlines indicate AR1-AR4. c , Close-up comparison of the cytoplasmic domains between TRPV1 ...
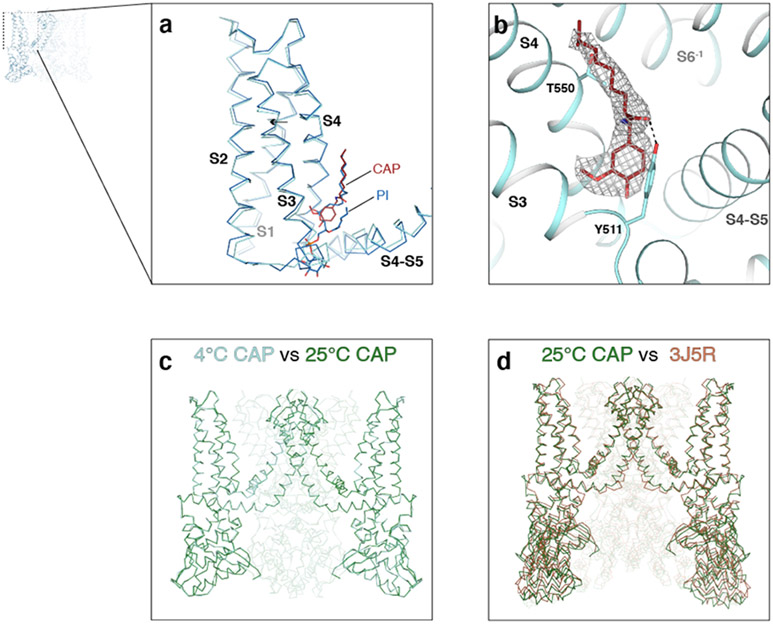
Extended Data Fig. 5
Comparison of TRPV1 4C,APO , TRPV1 4C,CAP , TRPV1 25C,CAP and the published structure of TRPV1 in the presence of capsaicin.
a , Close-up view of the S1-S4 domain of TRPV1 4C,APO (blue) and TRPV1 4C,CAP (cyan). Capsaicin (red) and phosphatidyl inositol (blue) molecules are shown as sticks. b , Close-up view of capsaicin in ...
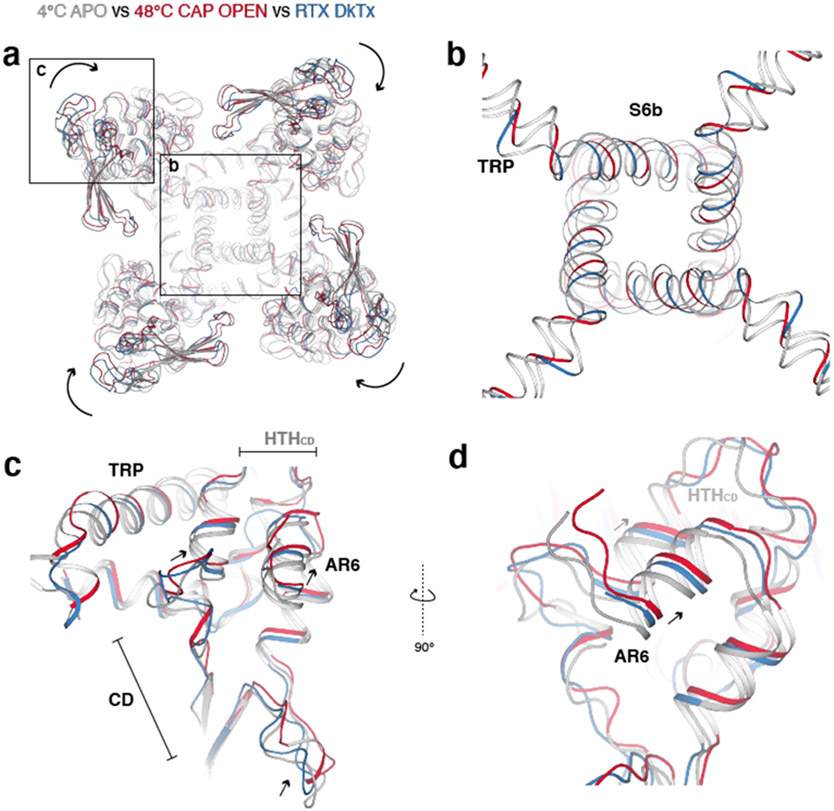
Extended Data Fig. 6
Comparison between the overall structures of TRPV1 4C,APO , TRPV1 48C,CAP,OPEN and DkTx/RTx-bound TRPV1.
a , Comparison of TRPV1 4C,APO (silver), TRPV1 48C,CAP,OPEN (red), and DkTx/RTx-TRPV1 (blue) viewed from the intracellular side. ARD/CD movement occurs at an individual protomer level. b , Comparison ...
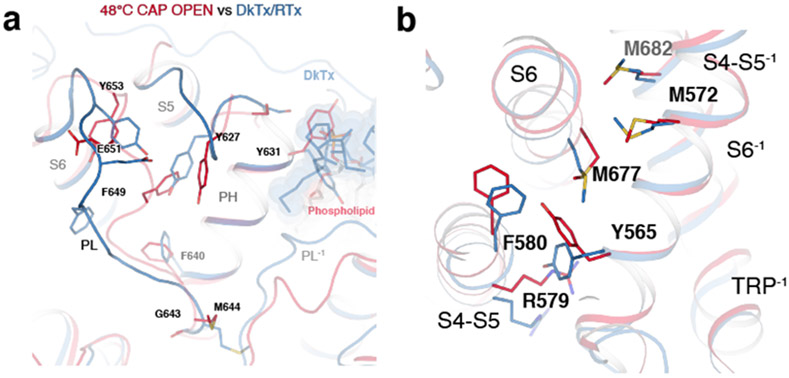
Extended Data Fig. 7
Comparison of TRPV1 48C,CAP,OPEN and DkTx/RTx-bound TRPV1 structures.
a , The overlapping locations of phospholipid (TRPV1 48C,CAP,OPEN , red) and DkTx (DkTx/RTx-TRPV1, blue), shown as sticks and spheres, between the pore loop and pore helix. Several side chains are sho...
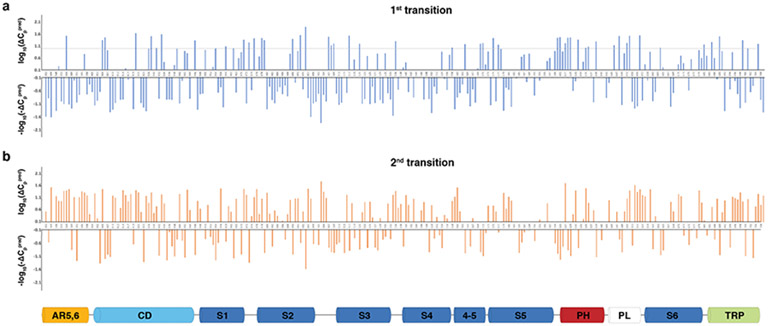
Extended Data Fig. 8
Solvent accessible surface area-based heat capacity change plots for the first and the second transitions.
a , b , u0394C P pred plots for the first ( a ) and second ( b ) transitions. For each transition, residues exhibiting positive u0394C P pred are plotted in the upper graph using log 10 (u0394C P pred...
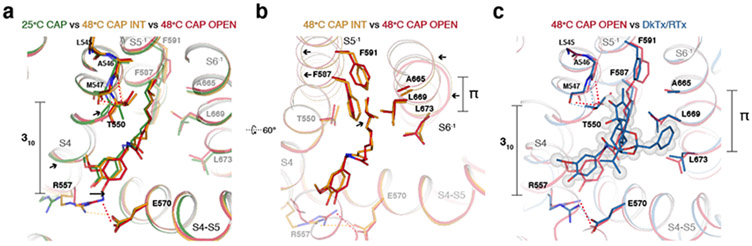
Extended Data Fig. 9
Rearrangement in the vanilloid pocket during the heat-dependent transitions.
a , Close-up view of the vanilloid binding sitein TRPV1 25C,CAP (green), TRPV1 48C,CAP,INT (orange), and TRPV1 48C,CAP,OPEN (red). Several key residues in capsaicin are shown as sticks. Dotted lines d...
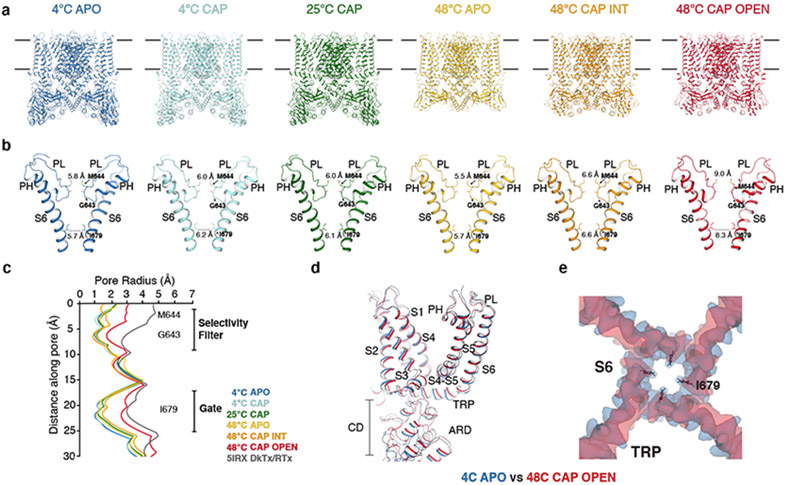
Fig. 1.
Structures of the full-length TRPV1 at six conditions.
a, Structures of TRPV1 determined at 4u00b0C (TRPV1 4C,APO , blue), at 4u00b0C with capsaicin (TRPV1 4C,CAP , sky blue), 25u00b0C with capsaicin (TRPV1 25C,CAP , green), 48u00b0C (TRPV1 48C,APO , gold...
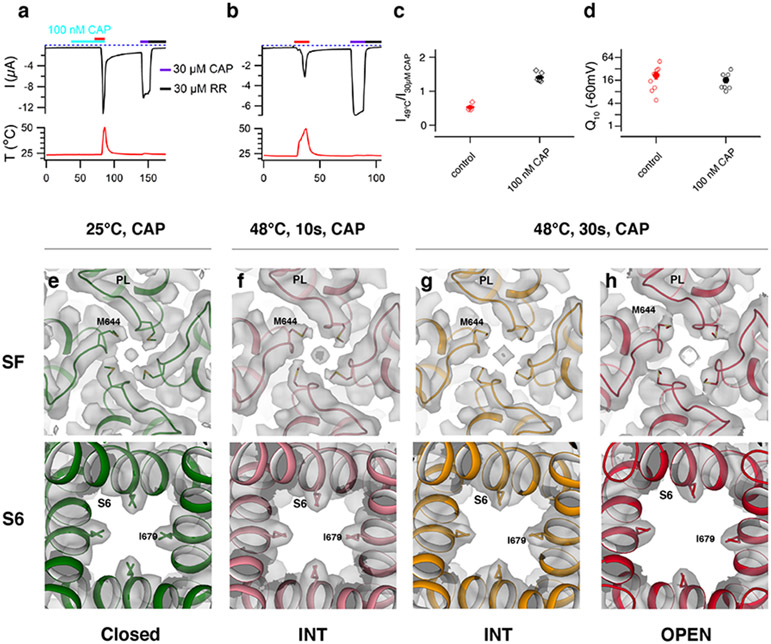
Fig. 2.
TRPV1 retains sensitivity to noxious heat after capsaicin sensitization and opens in a stepwise manner
a, b, Representative time course current traces of TRPV1-expressing oocytes with heat ramp and 100 nM capsaicin (CAP, turquoise) pre-treatment ( a ) or heat ramp (red) alone ( b ). Subsequent applicat...
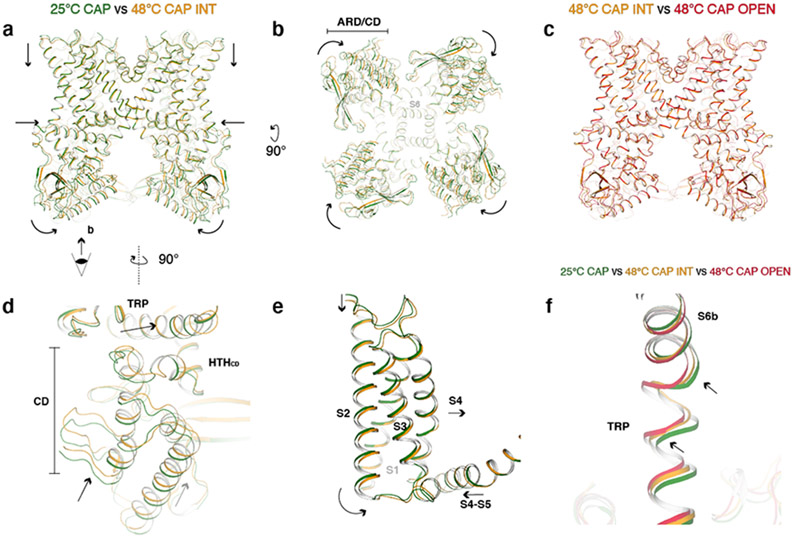
Fig. 3.
Global conformational changes of the first noxious heat-induced transition.
a, Comparison of TRPV1 25C,CAP (green) and TRPV1 48C,CAP,INT (orange) viewed from the membrane. Arrows indicate movements of the ARD, CD, S1-S4 domain, and TRP helix. b, The same as ( a ) , viewed fro...
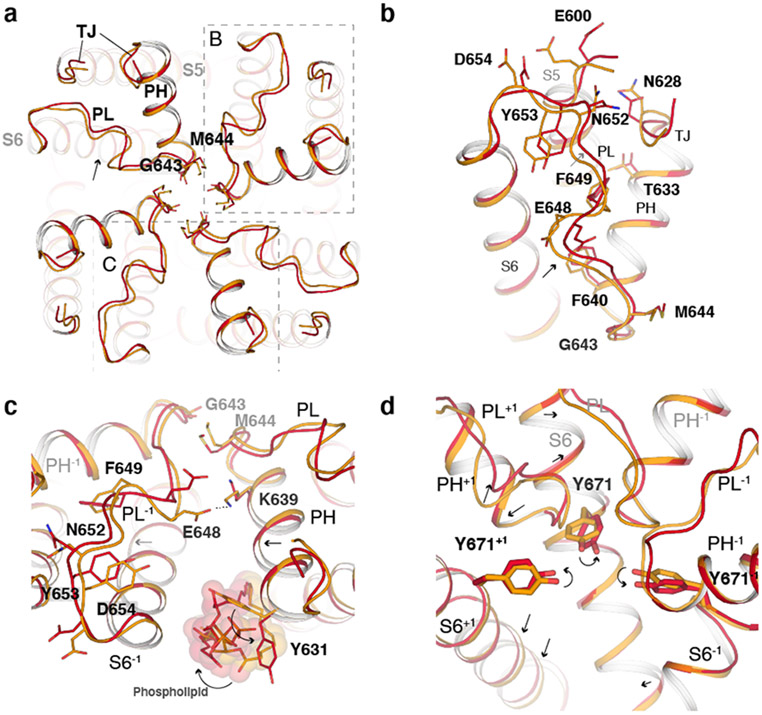
Fig. 4.
Conformational changes in the outer pore during the second transition.
a, Extracellular view comparing the pore region in TRPV1 48C,CAP,INT (orange) and TRPV1 48C,CAP,OPEN (red). b, Close-up view of the outer pore. c, Close-up view of the pore loop and pore helix interfa...
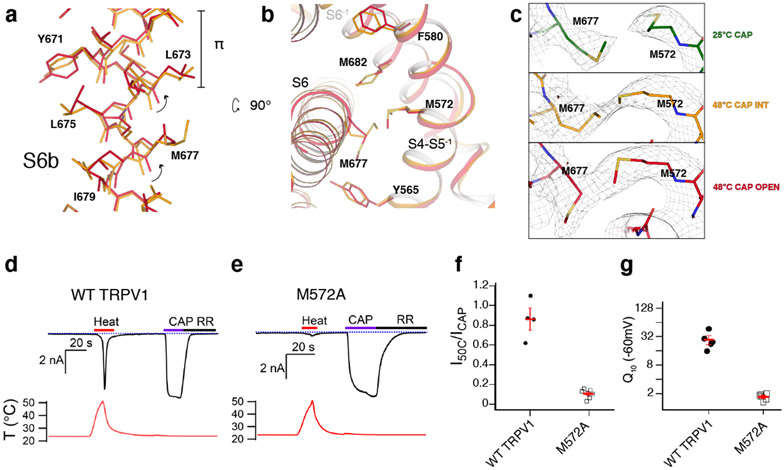
Fig. 5.
Conformational changes in the S6 gate during the second transition.
a, Rearrangement of the S6 u03c0 bulge (u03c0) between TRPV1 48C,CAP,INT (orange) and TRPV1 48C,CAP,OPEN (red). b, Side chain rearrangements between S6 and the S4-S5 linker of the neighboring subunit....
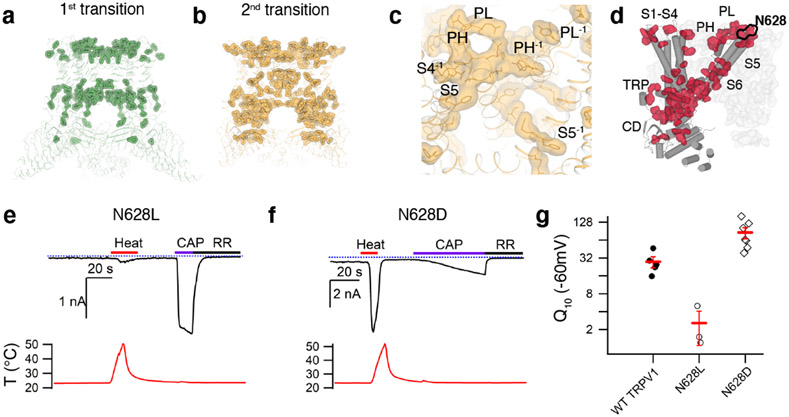
Fig. 6.
Structure mapping of SASA-based heat capacity changes
a, Amino acid residues with relatively large heat capacity change (u0394C P pred > 15 J mol u22121 K u22121 ) during the first transition are highlighted as sticks and surfaces on the TRPV1 4C,APO str...
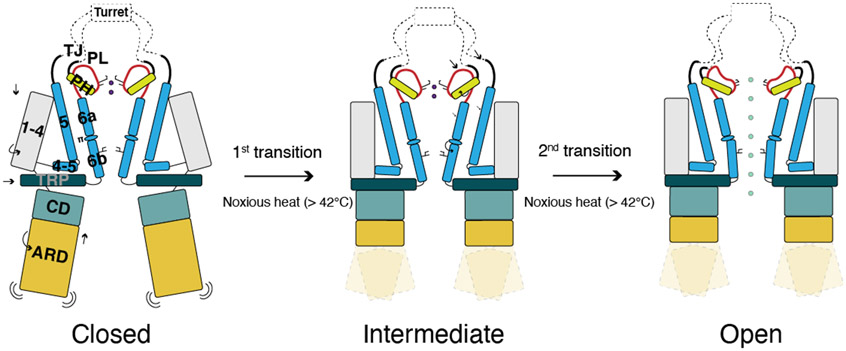
Fig 7.
Working model of TRPV1 heat-activation.
In the 1 st transition, all subdomains (ARD/CD, S1-S4, and TRP) become contracted. In the 2 nd transition, local conformational changes of the outer pore and S6 result in dilation of the selectivity f...
Figure images are served from the NIH/NLM PubMed Central Open Access Subset or Europe PMC; copyright remains with the publishers and authors.
💬 Discussion
0 commentsNo comments yet. Be the first to start a discussion!
Leave a Comment