Abstract
Abstract Background Despite the wide spread application of confocal and multiphoton laser scanning microscopy in plant biology, leaf phenotype assessment still relies on two-dimensional imaging with a limited appreciation of the cells' structural context and an inherent inaccuracy of cell measurements. Here, a successful procedure for the three-dimensional imaging and analysis of plant leaves is presented. Results The procedure was developed based on a range of developmental stages, from leaf initiation to senescence, of soil-grown Arabidopsis thaliana (L.) Heynh. Rigorous clearing of tissues, made possible by enhanced leaf permeability to clearing agents, allowed the optical sectioning of the entire leaf thickness by both confocal and multiphoton microscopy. The superior image quality, in resolution and contrast, obtained by the latter technique enabled the three-dimensional visualisation of leaf morphology at the individual cell level, cell segmentation and the construction of structural models. Image analysis macros were developed to measure leaf thickness and tissue proportions, as well as to determine for the epidermis and all layers of mesophyll tissue, cell density, volume, length and width. For mesophyll tissue, the proportion of intercellular spaces and the surface areas of cells were also estimated. The performance of the procedure was demonstrated for the expanding 6th leaf of the Arabidopsis rosette. Furthermore, it was proven to be effective for leaves of another dicotyledon, apple (Malus domestica Borkh.), which has a very different cellular organisation. Conclusions The pipeline for the three-dimensional imaging and analysis of plant leaves provides the means to include variables on internal tissues in leaf growth studies and the assessment of leaf phenotypes. It also allows the visualisation and quantification of alterations in leaf structure alongside changes in leaf functioning observed under environmental constraints. Data obtained using this procedure can further be integrated in leaf development and functioning models.
🔬 Techniques
🔭 Microscopes
🧬 Organisms
💻 Software
✨ Fluorophores
🧪 Sample Preparation
🏭 Microscope Brands
🧪 Reagent Suppliers
🔴 Lasers
🔎 Objectives
🎨 Filters
💻 Software Details
🏛️ Research Organizations (ROR)
Affiliated research institutions:
📋 Methods
Plant material and growth conditions Arabidopsis Col-4 (N933, http://Arabidopsis.org.uk was grown in a mixture (1:1) of a loamy soil and organic compost in the PHENOPSIS phenotyping platform [ 42 , 43 ] under controlled environmental conditions: air temperature of 21°C, 8 h photoperiod, incident light intensity of 230 μmol m 2 s -1 provided by a bank of cool-white fluorescent tubes and HQI lamps, 70% air humidity and 40% soil humidity. Arabidopsis leaf growth assessment Leaf 6 samples were collected every 2-3 days from leaf initiation until the end of expansion. Leaf 6 surface area was determined for five rosettes per time point, first under a stereomicroscope (Leica Wild F8Z, http://www.leica-microsystems.com at magnification 160 × using dedicated image analysis software (Bioscan-Optimas V 4.10; Edmonds, WA, USA) and afterwards on scans of leaves of dissected rosettes using an ImageJ macro [ 43 ]. Two times six leaf samples per time point were harvested for the measurement of leaf thickness and other growth variables by histological sectioning and three-dimensional imaging. Fixation, clearing and staining procedure for three-dimensional imaging Whole seedlings or leaves were fixed in 5-8 ml of an aged solution of ethanol:acetic acid (3:1) (stored for a minimum of 4 months at 4°C) or a solution of ethanol:acetic anhydride (3:1) with a drop of Tween-20 (50 μl). They were put under vacuum for 1 h and left on a shaker at 4°C for 48 h. Afterwards, they were rinsed in 50% and 70% ethanol. Leaf samples were conserved in 70% ethanol at 4°C. The procedure for clearing and staining was independent of leaf age or rank and included the following steps: (i) day 1, 10 min chloroform treatment, rinse in 70% ethanol and progressive rehydration for a transition to water-based treatments, 15 min clearing in SDS/NaOH, rinse in water and overnight amylase treatment at 37°C; (ii) day 2, rinse in water, 40 min periodic acid treatment, rinse in water and 6 h of staining in pseudo-schiff-propidium iodide followed by an overnight rinse in water; (iii) day 3, clearing in chloral hydrate (min 4 h) and montage in Hoyer's solution, if required. The products and concentrations were: absolute chloroform, 1% SDS and 200 mM NaOH, 20 mM PBS pH 7.0, 2 mM NaCl and 0.25 mM CaCl 2 , 0.01% amylase in PBS (SIGMA A4551, http://www.sigmaaldrich.com , 1% periodic acid, freshly prepared pseudo-schiff consisting of 100 mM Na 2 S 2 O 5 and 0.15 N HCl, 0.01% propidium iodide added to the pseudo-schiff solution at the time of staining, saturated chloral hydrate solution (200 g chloral hydrate, 20 ml glycerol and 30 ml water), Hoyer's solution (10 g arabic gum, 40 ml MilliQ water, 10 ml glycerol, 100 g chloral hydrate). Leaves were positioned on cover slips and then turned and mounted on microscope slides. This was done to limit the distance between the sample and cover slip, thereby optimising for the limitation imposed by the working distance of the objective and the path of the laser and emitted light.
Show full methods section
Plant material and growth conditions Arabidopsis Col-4 (N933, http://Arabidopsis.org.uk was grown in a mixture (1:1) of a loamy soil and organic compost in the PHENOPSIS phenotyping platform [ 42 , 43 ] under controlled environmental conditions: air temperature of 21°C, 8 h photoperiod, incident light intensity of 230 μmol m 2 s -1 provided by a bank of cool-white fluorescent tubes and HQI lamps, 70% air humidity and 40% soil humidity. Arabidopsis leaf growth assessment Leaf 6 samples were collected every 2-3 days from leaf initiation until the end of expansion. Leaf 6 surface area was determined for five rosettes per time point, first under a stereomicroscope (Leica Wild F8Z, http://www.leica-microsystems.com at magnification 160 × using dedicated image analysis software (Bioscan-Optimas V 4.10; Edmonds, WA, USA) and afterwards on scans of leaves of dissected rosettes using an ImageJ macro [ 43 ]. Two times six leaf samples per time point were harvested for the measurement of leaf thickness and other growth variables by histological sectioning and three-dimensional imaging. Fixation, clearing and staining procedure for three-dimensional imaging Whole seedlings or leaves were fixed in 5-8 ml of an aged solution of ethanol:acetic acid (3:1) (stored for a minimum of 4 months at 4°C) or a solution of ethanol:acetic anhydride (3:1) with a drop of Tween-20 (50 μl). They were put under vacuum for 1 h and left on a shaker at 4°C for 48 h. Afterwards, they were rinsed in 50% and 70% ethanol. Leaf samples were conserved in 70% ethanol at 4°C. The procedure for clearing and staining was independent of leaf age or rank and included the following steps: (i) day 1, 10 min chloroform treatment, rinse in 70% ethanol and progressive rehydration for a transition to water-based treatments, 15 min clearing in SDS/NaOH, rinse in water and overnight amylase treatment at 37°C; (ii) day 2, rinse in water, 40 min periodic acid treatment, rinse in water and 6 h of staining in pseudo-schiff-propidium iodide followed by an overnight rinse in water; (iii) day 3, clearing in chloral hydrate (min 4 h) and montage in Hoyer's solution, if required. The products and concentrations were: absolute chloroform, 1% SDS and 200 mM NaOH, 20 mM PBS pH 7.0, 2 mM NaCl and 0.25 mM CaCl 2 , 0.01% amylase in PBS (SIGMA A4551, http://www.sigmaaldrich.com , 1% periodic acid, freshly prepared pseudo-schiff consisting of 100 mM Na 2 S 2 O 5 and 0.15 N HCl, 0.01% propidium iodide added to the pseudo-schiff solution at the time of staining, saturated chloral hydrate solution (200 g chloral hydrate, 20 ml glycerol and 30 ml water), Hoyer's solution (10 g arabic gum, 40 ml MilliQ water, 10 ml glycerol, 100 g chloral hydrate). Leaves were positioned on cover slips and then turned and mounted on microscope slides. This was done to limit the distance between the sample and cover slip, thereby optimising for the limitation imposed by the working distance of the objective and the path of the laser and emitted light.
Microscope and imaging conditions
Samples were imaged on a Zeiss Axiovert 200 M LSM Meta 510 NLO http://www.zeiss.com/micro equipped with a Coherent Ti:Sa laser Chameleon Ultra II http://www.coherent.com at the Montpellier RIO imaging platform http://www.mri.cnrs.fr . Propidium iodide was excited with the 488 nm Ar laser line of the confocal system or 790 nm of the chameleon laser of the multiphoton system. Parameters for confocal acquisition were: HFT KP 700/488 multiple beam splitter, NFT 545 dichroic beam splitter, LP560. Parameters for multiphoton acquisition were: HFT KP 650 main dichroic beam splitter, non-descanned detection KP 685 secondary dichroic beam splitter, FT 560 filter wheel, BP575-640. A C-Apochromat 40 ×/1.2 W Corr objective lens was routinely used. Scans were performed at 1024 × 1024 pixels, 8-bit, using bi-directional scanning and a pixel-time of 3.2 μs. No line or frame averaging was applied. Scans were performed at 0.8 μm intervals in depth, which gave a voxel size of 0.22*0.22*0.8 μm (xyz). Imaging of the entire thickness of a leaf, 50 to 200 μm, took 4 to 17 min. Image stacks were produced routinely for the leaf base, middle or tip along the longitudinal axis, and approximately midway between the leaf midvein and margin.
Visualisation and image analysis
Visualisation of image stacks was done in ImageJ [ 34 ] or the MedINRIA's ImageViewer module [ 35 ]. For the latter, tiff format images were converted into the NIfTI format by means of a bat file performing the conversion using a dedicated program (P. Fillard, INRIA, Sophia-Antipolis, France). For the quantitative analysis of tissue and cell dimensions in image stacks, specifically developed ImageJ macros and R scripts [ 36 ] were used. These are available from the corresponding author on request.
Histological sectioning
Leaves were cut into small pieces, fixed in 1% glutaraldehyde, 2% paraformaldehyde, 1% caffeine in 0.1 M PBS pH 7.0 for 24 h at 4°C, rinsed twice in 70% ethanol and conserved in 70% ethanol at 4°C. Because of their small size, leaf pieces were mounted in 1.7% agar before dehydration in ethanol and inclusion in resin. Transverse sections of 3.5 μm were cut on a Leica microtome RM2255 http://www.leica-microsystems.com and stained in 1% alcian blue 8GX in a sodium citrate/HCl pH 3.5 buffer. They were documented using a 20 × or 10 × objective lens on a Leica DM 4500 brightfield microscope http://www.leica-microsystems.com equipped with a Hamamatsu camera http://www.hamamatsu.com and Volocity imaging software http://www.cellularimaging.com . For each leaf piece, taken at approximately 50% between the leaf base and tip along the longitudinal axis, a central zone between the leaf midvein and leaf margin was photographed. Thickness was measured using a dedicated ImageJ macro (M. Lartaud, CIRAD, Montpellier, France).
Plant material and growth conditions Arabidopsis Col-4 (N933, http://Arabidopsis.org.uk was grown in a mixture (1:1) of a loamy soil and organic compost in the PHENOPSIS phenotyping platform [ 42 , 43 ] under controlled environmental conditions: air temperature of 21°C, 8 h photoperiod, incident light intensity of 230 μmol m 2 s -1 provided by a bank of cool-white fluorescent tubes and HQI lamps, 70% air humidity and 40% soil humidity.
Fixation, clearing and staining procedure for three-dimensional imaging Whole seedlings or leaves were fixed in 5-8 ml of an aged solution of ethanol:acetic acid (3:1) (stored for a minimum of 4 months at 4°C) or a solution of ethanol:acetic anhydride (3:1) with a drop of Tween-20 (50 μl). They were put under vacuum for 1 h and left on a shaker at 4°C for 48 h. Afterwards, they were rinsed in 50% and 70% ethanol. Leaf samples were conserved in 70% ethanol at 4°C. The procedure for clearing and staining was independent of leaf age or rank and included the following steps: (i) day 1, 10 min chloroform treatment, rinse in 70% ethanol and progressive rehydration for a transition to water-based treatments, 15 min clearing in SDS/NaOH, rinse in water and overnight amylase treatment at 37°C; (ii) day 2, rinse in water, 40 min periodic acid treatment, rinse in water and 6 h of staining in pseudo-schiff-propidium iodide followed by an overnight rinse in water; (iii) day 3, clearing in chloral hydrate (min 4 h) and montage in Hoyer's solution, if required. The products and concentrations were: absolute chloroform, 1% SDS and 200 mM NaOH, 20 mM PBS pH 7.0, 2 mM NaCl and 0.25 mM CaCl 2 , 0.01% amylase in PBS (SIGMA A4551, http://www.sigmaaldrich.com , 1% periodic acid, freshly prepared pseudo-schiff consisting of 100 mM Na 2 S 2 O 5 and 0.15 N HCl, 0.01% propidium iodide added to the pseudo-schiff solution at the time of staining, saturated chloral hydrate solution (200 g chloral hydrate, 20 ml glycerol and 30 ml water), Hoyer's solution (10 g arabic gum, 40 ml MilliQ water, 10 ml glycerol, 100 g chloral hydrate). Leaves were positioned on cover slips and then turned and mounted on microscope slides. This was done to limit the distance between the sample and cover slip, thereby optimising for the limitation imposed by the working distance of the objective and the path of the laser and emitted light.
Supplementary Material Additional file 1 Image stack of an Arabidopsis leaf early in leaf blade expansion .
Optical sectioning of an Arabidopsis
Col-4 leaf 6 at 9 days after initiation (16 h photoperiod) using multiphoton microscopy. Click here for file Additional file 2 Image stack of an Arabidopsis leaf near the end of leaf blade expansion .
Optical sectioning of an Arabidopsis
Col-4 leaf 6 at 16 days after initiation (16 h photoperiod) using multiphoton microscopy. Click here for file Additional file 3 Three-dimensional imaging of Arabidopsis leaves using multiphoton microscopy . Single optical sections in, from top to bottom, the adaxial epidermis, the palisade mesophyll, the spongy mesophyll and the abaxial epidermis, taken from image stacks of leaf 6 of the Arabidopsis rosette at 8-22 days after initiation (dai). Click here for file Additional file 4 Image stack of an apple leaf early in leaf blade expansion . Optical sectioning of the third leaf from the top of an apple graft (Granny Smith) using multiphoton microscopy. Click here for file Additional file 5 Image stack of a fully expanded apple leaf . Optical sectioning of the ninth leaf from the top of an apple graft (Granny Smith) using multiphoton microscopy. Click here for file Additional file 6 Three-dimensional imaging of apple leaves using multiphoton microscopy . (a) Single optical sections in, from left to right, the adaxial epidermis, the palisade mesophyll, the spongy mesophyll and the abaxial epidermis, taken from an image stack of a young (the first unfolded leaf on the axis of a Starkrimson graft, top row) and mature apple leaf (the ninth leaf from the top of the same axis, bottom row) (scale bar of 50 μm for all images). (b) Orthogonal views (xz) of the same image stacks: young (left) and mature (right) apple leaf (scale bar of 25 μm for both images). Click here for file
📊 Figures
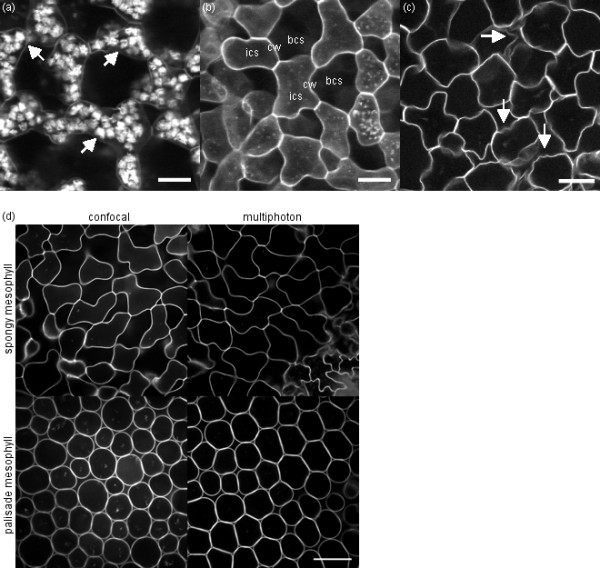
Figure 1
Leaf image problems and image quality difference between confocal and multiphoton systems . (a-c) Problems encountered upon three-dimensional imaging of leaves include: (a) starch granules (some indic...
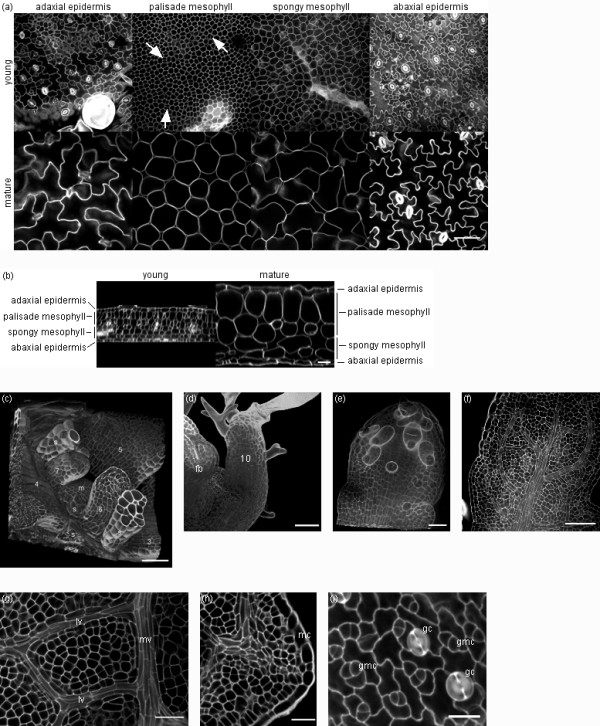
Figure 2
Three-dimensional imaging of Arabidopsis leaves at different developmental stages using multiphoton microscopy . (a) Single optical sections in, from left to right, the adaxial epidermis, the palisade...
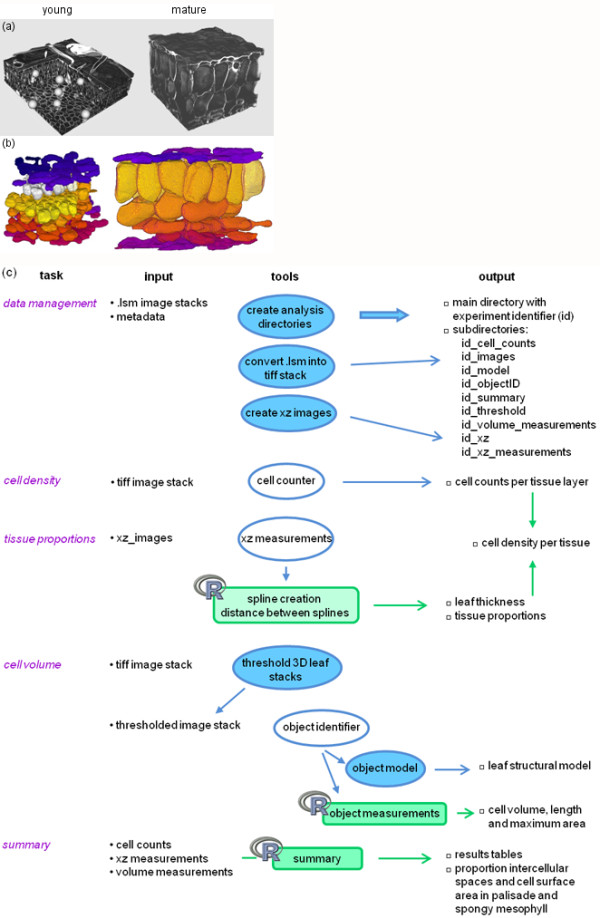
Figure 3
Three-dimensional visualisation and image analysis . (a) Three-dimensional visualisation in the MedINRIA ImageViewer software of a young (leaf 6, 8 days after initiation, left) and a mature Arabidopsi...
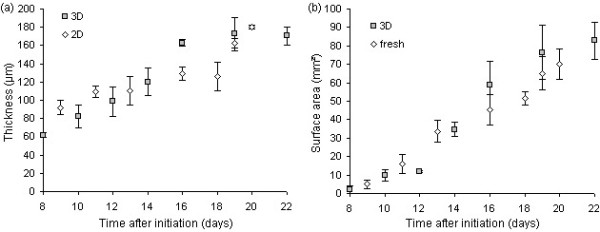
Figure 4
Thickness and surface area of expanding leaves measured by different techniques . (a) Thickness (average u00b1 standard deviation) measured in the middle of leaf 6 of the Arabidopsis rosette on transv...
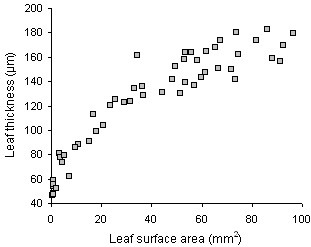
Figure 5
Leaf expansion in surface area and thickness . Scatter plot of thickness versus surface area of individual leaves (leaf 6 of the Arabidopsis rosette) between 8 and 22 days after leaf initiation.
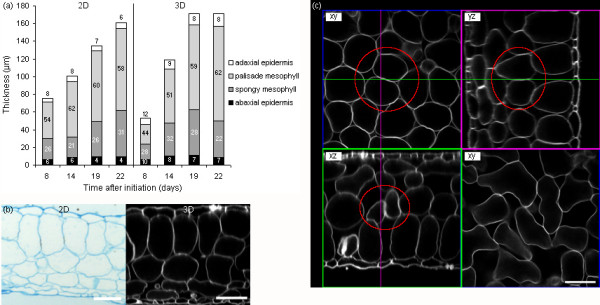
Figure 6
Leaf tissue expansion measured on two- and three-dimensional images . (a) Thickness and proportions of leaf thickness (average %, indicated inside bars) occupied by, from top to bottom, the adaxial ep...
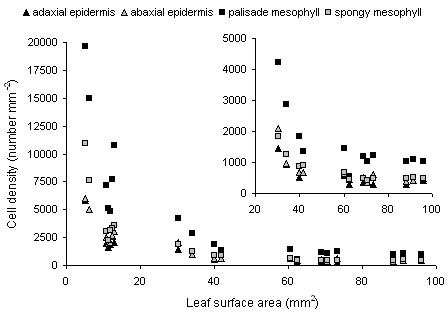
Figure 7
Cell density determined for both epidermal and mesophyll tissues . Scatter plot of cell density versus leaf surface area of individual leaves (leaf 6 of the Arabidopsis rosette, between 8 and 22 days ...
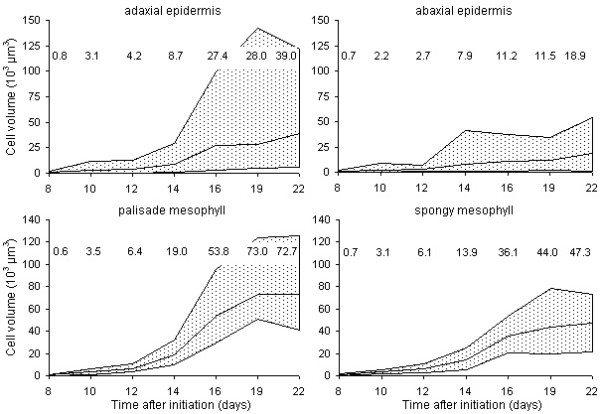
Figure 8
Cell volumes measured in both epidermal and mesophyll tissues . Range of cell volumes observed during expansion in the adaxial epidermis (top left), the abaxial epidermis (top right), the palisade mes...
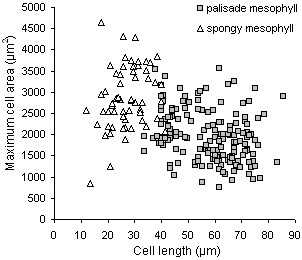
Figure 9
Length and area of mesophyll cells in fully expanded leaves . Scatter plot of cell length versus maximum cell area of individual cells in the palisade and spongy mesophyll of leaf 6 of the Arabidopsis...
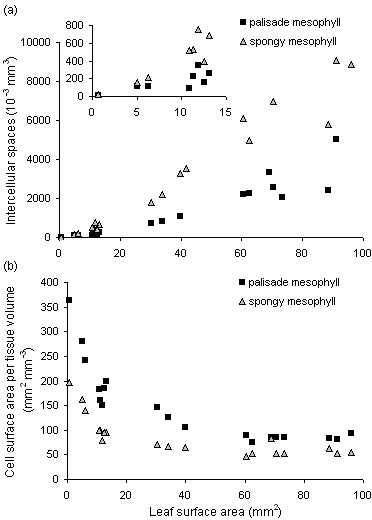
Figure 10
Intercellular spaces and cell surface area in the palisade and spongy mesophyll . Scatter plot of the volume of intercellular spaces (a) and cell surface area per tissue volume (b) versus leaf surface...
Figure images are served from the NIH/NLM PubMed Central Open Access Subset or Europe PMC; copyright remains with the publishers and authors.
💬 Discussion
0 commentsNo comments yet. Be the first to start a discussion!
Leave a Comment