Abstract
Substrate rigidity profoundly impacts cellular behaviors such as migration, gene expression, and cell fate. Total Internal Reflection Fluorescence (TIRF) microscopy enables selective visualization of the dynamics of substrate adhesions, vesicle trafficking, and biochemical signaling at the cell-substrate interface. Here we apply high-refractive-index silicone gels to perform TIRF microscopy on substrates with a wide range of physiological elastic moduli and simultaneously measure traction forces exerted by cells on the substrate.
🔬 Techniques
🔬 Cell Lines
🏭 Microscope Brands
🧪 Reagent Suppliers
🏛️ Research Organizations (ROR)
Affiliated research institutions:
📋 Methods
To prepare the gel layers, the components of the HRI gel pre-polymers, parts A and B of QGel 920 and parts A and B of QGel 903 (both by Quantum Silicones LLC, Richmond VA; refractive index of 1.49 when cured), were mixed in various proportions ( Table 1 ) and coated onto 25 mm no. 1 round cover glasses using a home-built spin-coater rotating at 1920 rpm. Each cover glass was baked at 100°C for 2 hr to create a layer of cured gel on it with a thickness, µm. After baking, the gels on the cover glasses were treated with 3-aminopropyl trimethoxysilane for 5 minutes and incubated for 10 minutes at room temperature under a suspension of 40 nm carboxylated far-red fluorescent beads (excitation/emission 690/720 nm, by Invitrogen, Carlsbad, CA) in a 100 µg/ml solution of 1-Ethyl-3-(3-dimethylaminopropyl) carbodiimide (EDC) in water to covalently link beads to the gel surface. This technique made it possible to have all beads in one plane corresponding to the surface of the gel. Therefore, the beads could be imaged under wide-field (epi-fluorescence illumination) with minimal background and their displacements reflected the deformation of the very top of the substrate. To promote cell adhesion, fibronectin (FN) was covalently linked to the gel surface by incubation in 50 µg/ml of FN with 100 µg/ml EDC in PBS, pH 7.4 for 30 min at room temperature. 10.1371/journal.pone.0023807.t001 Table 1 Relative amounts of parts A and B of QGel 920 (by mass) and parts A and B of QGel 903 (both by Quantum Silicones) used to prepare silicone gels with different elastic moduli, E (in kPa). E (kPa) 0.4 0.7 3.7 18 30 54 130 920A 1 1 1 1 1 1 1 920B 0.95 1 1.1 2 1 1 2 903A – – – – 0.13 0.19 0.22 903B – – – – 0.13 0.19 0.22 The elastic moduli were measured with accuracies of 5–10% by applying a known shear hydrodynamic stress using a microfluidic device and measuring the resulting shear strain [26] . The gels with E = 0.4–18 kPa were prepared using QGel 920 only, whereas the gels with E = 30–130 kPa were prepared with a mixture of QGel 920 and QGel 903 components. The experiments with HUVEC were only performed on gel substrates with E of 0.4, 3.7, 18, and 130 kPa. The elastic modulus (Young's modulus), E , of the gels was evaluated by applying a known hydrodynamic shear stress, τ , to the gel surface using a custom-built microfluidic device, measuring the resulting bead displacement, , calculating the shear of the gel, , and applying the equation , where ν is the Poisson ratio, as explained in detail elsewhere [26] . Because the Poisson ratio of silicone gels is nearly equal to 0.5 [27] , the equation was reduced to . To measure the gel thickness, , a small amount of the 40 nm far-red fluorescent beads was deposited on the cover glass surface before it was coated with the gel pre-polymer. The fluorescence microscope was first focused on beads on the glass surface and then on those on the gel surface and the difference in the readings of the nosepiece ( z -axis) knob was recorded (with a correction for the mismatch between the refractive indices of the gel and immersion liquid), resulting in ∼1 µm accuracy. The shear, , was found to be a zero-crossing linear function of τ for of up to at least 3 µm (greater than produced by HUVECs; see below) for all gels, with no sign of plastic deformations (see also [26] ), thus validating the use of the equation , which applies to linear materials. Furthermore, measurements of vs. at different constant values of τ resulted in linear dependencies, indicating homogeneity of mechanical properties of the gel layers.
Show full methods section
To prepare the gel layers, the components of the HRI gel pre-polymers, parts A and B of QGel 920 and parts A and B of QGel 903 (both by Quantum Silicones LLC, Richmond VA; refractive index of 1.49 when cured), were mixed in various proportions ( Table 1 ) and coated onto 25 mm no. 1 round cover glasses using a home-built spin-coater rotating at 1920 rpm. Each cover glass was baked at 100°C for 2 hr to create a layer of cured gel on it with a thickness, µm. After baking, the gels on the cover glasses were treated with 3-aminopropyl trimethoxysilane for 5 minutes and incubated for 10 minutes at room temperature under a suspension of 40 nm carboxylated far-red fluorescent beads (excitation/emission 690/720 nm, by Invitrogen, Carlsbad, CA) in a 100 µg/ml solution of 1-Ethyl-3-(3-dimethylaminopropyl) carbodiimide (EDC) in water to covalently link beads to the gel surface. This technique made it possible to have all beads in one plane corresponding to the surface of the gel. Therefore, the beads could be imaged under wide-field (epi-fluorescence illumination) with minimal background and their displacements reflected the deformation of the very top of the substrate. To promote cell adhesion, fibronectin (FN) was covalently linked to the gel surface by incubation in 50 µg/ml of FN with 100 µg/ml EDC in PBS, pH 7.4 for 30 min at room temperature. 10.1371/journal.pone.0023807.t001 Table 1 Relative amounts of parts A and B of QGel 920 (by mass) and parts A and B of QGel 903 (both by Quantum Silicones) used to prepare silicone gels with different elastic moduli, E (in kPa). E (kPa) 0.4 0.7 3.7 18 30 54 130 920A 1 1 1 1 1 1 1 920B 0.95 1 1.1 2 1 1 2 903A – – – – 0.13 0.19 0.22 903B – – – – 0.13 0.19 0.22 The elastic moduli were measured with accuracies of 5–10% by applying a known shear hydrodynamic stress using a microfluidic device and measuring the resulting shear strain [26] . The gels with E = 0.4–18 kPa were prepared using QGel 920 only, whereas the gels with E = 30–130 kPa were prepared with a mixture of QGel 920 and QGel 903 components. The experiments with HUVEC were only performed on gel substrates with E of 0.4, 3.7, 18, and 130 kPa. The elastic modulus (Young's modulus), E , of the gels was evaluated by applying a known hydrodynamic shear stress, τ , to the gel surface using a custom-built microfluidic device, measuring the resulting bead displacement, , calculating the shear of the gel, , and applying the equation , where ν is the Poisson ratio, as explained in detail elsewhere [26] . Because the Poisson ratio of silicone gels is nearly equal to 0.5 [27] , the equation was reduced to . To measure the gel thickness, , a small amount of the 40 nm far-red fluorescent beads was deposited on the cover glass surface before it was coated with the gel pre-polymer. The fluorescence microscope was first focused on beads on the glass surface and then on those on the gel surface and the difference in the readings of the nosepiece ( z -axis) knob was recorded (with a correction for the mismatch between the refractive indices of the gel and immersion liquid), resulting in ∼1 µm accuracy. The shear, , was found to be a zero-crossing linear function of τ for of up to at least 3 µm (greater than produced by HUVECs; see below) for all gels, with no sign of plastic deformations (see also [26] ), thus validating the use of the equation , which applies to linear materials. Furthermore, measurements of vs. at different constant values of τ resulted in linear dependencies, indicating homogeneity of mechanical properties of the gel layers.
Supporting Information Figure S1 TIRF background of a gel coated coverslip vs. blank coverslip. (a) and (b) TIRF images of the surface of a blank coverslip and a coverslip coated with high-refractive index silicone gel, respectively, with 300×300 pixels in each image. The images were taken at identical illumination and acquisition conditions using a 100×/1.46 Olympus TIRF objective and a cooled Hamamatsu camera, with a 1 sec exposure time and a maximal gain. The images are not completely dark because of a combination of the read-out noise and dark current of the camera (amplified by the gain), the incomplete blockage of the excitation light by the fluorescence filters (combined with the reflection and scattering of light from the glass and gel surfaces), and autofluorescence of the coverslip and gel. Small dots seen on the surface of the gel are possibly due to scattering of light at small defects in the gel and residual autofluorescence of microparticles stuck to the gel surface during its preparation. (c) Histograms of the pixel values of the images in (a) and (b) are shown by red and blue dots, respectively. The mean values of the pixels were 59.5 and 64.7 for the blank and gel-coated coverslip, respectively. Therefore, the TIRF background of the gel-coated coverslip was
📊 Figures
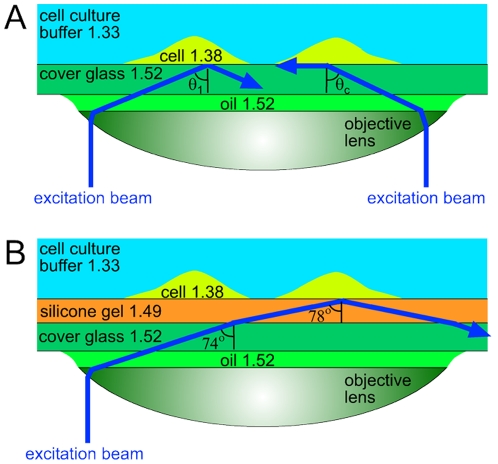
Figure 1
Schematic optical diagrams of through-the-lens TIRF microscopy.
Excitation beams are shown in blue. Numbers indicate refractive indices of different materials found in the setup. (a) TIRF microscopy of adherent cells ( ) on a cover glass ( ). Excitation beam on th...
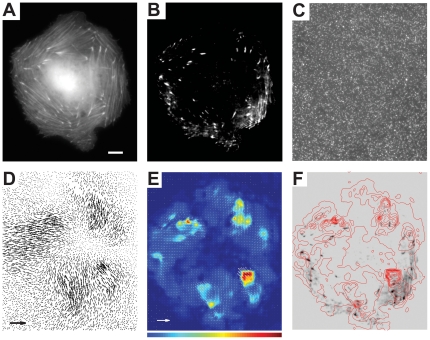
Figure 2
Concurrent TIRF and traction force microscopy of a HUVEC plated on a 34 u00b5m thick layer of a silicone gel with a refractive index of 1.49 and E of 3.7 kPa.
(a) Epi-fluorescence and (b) TIRF micrographs of fluorescently labeled F-actin in the cell. (c) Epi-fluorescence micrograph of 40nm far-red fluorescent beads covalently linked to the gel surface. (d) ...
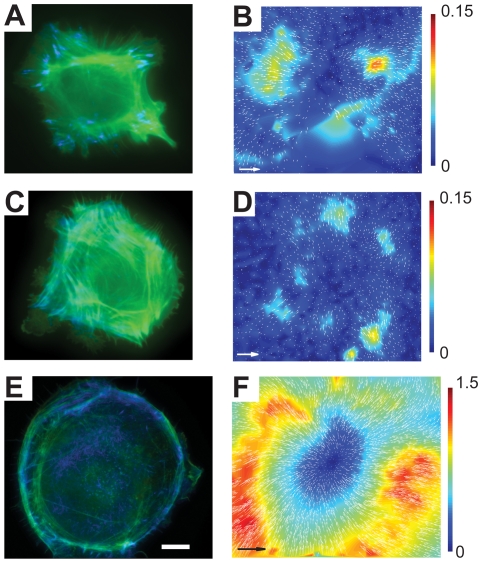
Figure 3
HUVECs on silicone gel substrates of various elastic moduli, E .
(a), (c), and (e) Superimposed epi-fluorescence (false green) and TIRF (false blue) images of cells on gels with E =u200a130, 18, and 0.4 kPa, respectively. (b), (d), and (f) Arrow maps of displacemen...
Figure images are served from the NIH/NLM PubMed Central Open Access Subset or Europe PMC; copyright remains with the publishers and authors.
💬 Discussion
0 commentsNo comments yet. Be the first to start a discussion!
Leave a Comment