Abstract
Optical imaging has become a powerful tool for studying brains in vivo. The opacity of adult brains makes microendoscopy, with an optical probe such as a gradient index (GRIN) lens embedded into brain tissue to provide optical relay, the method of choice for imaging neurons and neural activity in deeply buried brain structures. Incorporating a Bessel focus scanning module into two-photon fluorescence microendoscopy, we extended the excitation focus axially and improved its lateral resolution. Scanning the Bessel focus in 2D, we imaged volumes of neurons at high-throughput while resolving fine structures such as synaptic terminals. We applied this approach to the volumetric anatomical imaging of dendritic spines and axonal boutons in the mouse hippocampus, and functional imaging of GABAergic neurons in the mouse lateral hypothalamus in vivo.
🔬 Techniques
✨ Fluorophores
🧪 Sample Preparation
🔬 Cell Lines
🏭 Microscope Brands
🧪 Reagent Suppliers
🔴 Lasers
🔎 Objectives
💻 Software Details
💾 Data Repositories
🏛️ Research Organizations (ROR)
Affiliated research institutions:
📋 Methods
Animals
All animal experiments were conducted according to the United States National Institutes of Health guidelines for animal research. Procedures and protocols were approved by the Institutional Animal Care and Use Committee at Janelia Research Campus, Howard Hughes Medical Institute.
Male and female mice
(C57BL/6J background, Strain 664, The Jackson Laboratory, ME, USA) aged two months and older were used in this study: Gad2-IRES-cre ( Network NNBCD, 2009 ; Taniguchi et al., 2011 ), Thy1-GFP line M ( Feng et al., 2000 ), Ai93(24107)×ACTB tTA×Kcnd2 IRES-Cre 3G5 ( Madisen et al., 2015 ; Li et al., 2010 ), Vgat-cre ( Vong et al., 2011 ). Prior to stereotaxic surgery, mice were group housed with littermates in temperature and humidity-controlled rooms with ad libitum access to water and rodent chow (PicoLab Rodent Diet 20, 5053 tablet, LabDiet/Land O’Lakes Inc., MO, USA) on a 12 hr reverse light/dark cycle (9 p.m.−9 a.m. light cycle and 9 a.m− 9 p.m. dark cycle).
Two-photon excitation fluorescence microendoscopy
A homebuilt two-photon excitation fluorescence microscope was used for microendoscopic imaging and was described in detail previously ( Ji et al., 2010 ). 940 nm output from a femtosecond pulsed laser source with a built-in dispersion compensation unit (InSight DeepSee, Spectra Physics, CA, USA) was used to provide two-photon excitation. A 10×/0.45NA microscope objective (CFI Plan Apo Lambda 10X, Nikon, Tokyo, Japan) was used in conjunction with 0.5-NA singlet GRIN lenses, whereas a 4×/0.2NA objective (CFI Plan Apo Lambda 4X, Nikon) was used with doublet GRIN lenses to match their NA on the image side. Microscope control and data acquisition were executed using custom-written LabVIEW software. Alignment of GRIN lenses Obtaining optimal image quality from GRIN-lens-based microendoscopes requires the GRIN lens to share the same optical axis as the microscope objective and the excitation light. For the in vitro characterization, the GRIN lens was held with a custom-built clip mounted onto a tilt/tip adjustment platform mount (KM100B, Thorlabs, NJ, USA). The tilt/tip platform was further mounted onto a motorized 3D translational stage (3DMS, Sutter Instrument Company, CA, USA), which allowed us to adjust the tilt/tip and translational position of the GRIN lens. Looking through the eyepiece and the 10×/0.45NA objective, we adjusted the tilt/tip of the GRIN lens so that the entire top surface of the GRIN lens came into focus simultaneously, indicating that the optical axes of the GRIN lens and the objective were parallel. Failure to do this causes the excitation light to experience severe optical aberrations and degradation of image quality. To make the GRIN lens and the objective coaxial, we switched to Bessel mode with the excitation light forming an annular illumination pattern when entering the GRIN lens. We then adjusted the translational position of the GRIN lens until the annular illumination transmitted through the lens remained symmetrical when the GRIN lens was translated axially, indicating that the GRIN lens was coaxial with the microscope objective. We then recorded the position of the GRIN lens within the eyepiece field of view (FOV). For in vivo experiments, the mouse was mounted on a tilt/tip platform and was adjusted below the 10×/0.45NA objective until the top surface of the GRIN lens was in focus. We then translated the mouse until the GRIN lens occupied the same position as recorded during the in vitro alignment. For doublet GRIN lenses, tip/tilt alignment was established using the 10×/0.45NA objective due to its smaller depth of field; this objective was then replaced by the 4×/0.2NA objective prior to adjustment of translational position and the imaging experiments to follow. In vitro characterization of GRIN lenses The imaging resolution and FOV of 10 commercially available GRIN lenses (GRINTECH GMbH, Inscopix, Go!Foton) were characterized. Prior to the experiment, precise alignment of each GRIN lens was completed as described above. For doublet GRIN lenses with 0.19 NA on the image side and 0.5 NA on the sample side, data were collected with the image WD within a 2000 µm range. For singlet GRIN lenses, data were collected with the image WD within a 400 µm range. For all the GRIN lenses tested, the sample WD versus image WD followed a linear relationship with a fitted slope k . For in vivo experiments, the change of the sample WD ( i.e. , focal shift in the brain), Δ d sample , was calculated as Δ d sample = k × Δ d image , where Δ d image is the change of image WD (e.g., the axial shift of the brain and the GRIN lens) and k is the slope determined by fitting the image WD and sample WD relationship ( Figure 2C ).
Show full methods section
Animals
All animal experiments were conducted according to the United States National Institutes of Health guidelines for animal research. Procedures and protocols were approved by the Institutional Animal Care and Use Committee at Janelia Research Campus, Howard Hughes Medical Institute.
Male and female mice
(C57BL/6J background, Strain 664, The Jackson Laboratory, ME, USA) aged two months and older were used in this study: Gad2-IRES-cre ( Network NNBCD, 2009 ; Taniguchi et al., 2011 ), Thy1-GFP line M ( Feng et al., 2000 ), Ai93(24107)×ACTB tTA×Kcnd2 IRES-Cre 3G5 ( Madisen et al., 2015 ; Li et al., 2010 ), Vgat-cre ( Vong et al., 2011 ). Prior to stereotaxic surgery, mice were group housed with littermates in temperature and humidity-controlled rooms with ad libitum access to water and rodent chow (PicoLab Rodent Diet 20, 5053 tablet, LabDiet/Land O’Lakes Inc., MO, USA) on a 12 hr reverse light/dark cycle (9 p.m.−9 a.m. light cycle and 9 a.m− 9 p.m. dark cycle).
Two-photon excitation fluorescence microendoscopy
A homebuilt two-photon excitation fluorescence microscope was used for microendoscopic imaging and was described in detail previously ( Ji et al., 2010 ). 940 nm output from a femtosecond pulsed laser source with a built-in dispersion compensation unit (InSight DeepSee, Spectra Physics, CA, USA) was used to provide two-photon excitation. A 10×/0.45NA microscope objective (CFI Plan Apo Lambda 10X, Nikon, Tokyo, Japan) was used in conjunction with 0.5-NA singlet GRIN lenses, whereas a 4×/0.2NA objective (CFI Plan Apo Lambda 4X, Nikon) was used with doublet GRIN lenses to match their NA on the image side. Microscope control and data acquisition were executed using custom-written LabVIEW software. Alignment of GRIN lenses Obtaining optimal image quality from GRIN-lens-based microendoscopes requires the GRIN lens to share the same optical axis as the microscope objective and the excitation light. For the in vitro characterization, the GRIN lens was held with a custom-built clip mounted onto a tilt/tip adjustment platform mount (KM100B, Thorlabs, NJ, USA). The tilt/tip platform was further mounted onto a motorized 3D translational stage (3DMS, Sutter Instrument Company, CA, USA), which allowed us to adjust the tilt/tip and translational position of the GRIN lens. Looking through the eyepiece and the 10×/0.45NA objective, we adjusted the tilt/tip of the GRIN lens so that the entire top surface of the GRIN lens came into focus simultaneously, indicating that the optical axes of the GRIN lens and the objective were parallel. Failure to do this causes the excitation light to experience severe optical aberrations and degradation of image quality. To make the GRIN lens and the objective coaxial, we switched to Bessel mode with the excitation light forming an annular illumination pattern when entering the GRIN lens. We then adjusted the translational position of the GRIN lens until the annular illumination transmitted through the lens remained symmetrical when the GRIN lens was translated axially, indicating that the GRIN lens was coaxial with the microscope objective. We then recorded the position of the GRIN lens within the eyepiece field of view (FOV). For in vivo experiments, the mouse was mounted on a tilt/tip platform and was adjusted below the 10×/0.45NA objective until the top surface of the GRIN lens was in focus. We then translated the mouse until the GRIN lens occupied the same position as recorded during the in vitro alignment. For doublet GRIN lenses, tip/tilt alignment was established using the 10×/0.45NA objective due to its smaller depth of field; this objective was then replaced by the 4×/0.2NA objective prior to adjustment of translational position and the imaging experiments to follow. In vitro characterization of GRIN lenses The imaging resolution and FOV of 10 commercially available GRIN lenses (GRINTECH GMbH, Inscopix, Go!Foton) were characterized. Prior to the experiment, precise alignment of each GRIN lens was completed as described above. For doublet GRIN lenses with 0.19 NA on the image side and 0.5 NA on the sample side, data were collected with the image WD within a 2000 µm range. For singlet GRIN lenses, data were collected with the image WD within a 400 µm range. For all the GRIN lenses tested, the sample WD versus image WD followed a linear relationship with a fitted slope k . For in vivo experiments, the change of the sample WD ( i.e. , focal shift in the brain), Δ d sample , was calculated as Δ d sample = k × Δ d image , where Δ d image is the change of image WD (e.g., the axial shift of the brain and the GRIN lens) and k is the slope determined by fitting the image WD and sample WD relationship ( Figure 2C ).
Stereotaxic surgery and brain slice preparation
GABAergic neurons were labeled by in vivo injection of AAV2/1-Syn-Flex-GCaMP6s (1:2 diluted by PBS from stock solution with the titer of 2.7 × 10 13 GC/ml made by viral services at Janelia Research Campus, Howard Hughes Medical Institute) into the primary visual cortex of the Gad2-ires-Cre mouse (JAX, stock#010802). Thirty nanoliters of viral solution was injected at the following coordinate: Bregma, −3.80 mm; midline:+2.50 mm; depth 0.5 mm. Four weeks later, mice were perfused by 4% paraformaldehyde and the brain was cut using a vibratome (Leica VT1200S) into 100 µm-thick brain slices. Brain slices with positively labeled neurons were mounted with mounting medium (Vectashield, Vector Laboratory) onto slides for long-term preservation of the fluorescent signal. The same slice preparation procedure was followed for Thy1-GFP-M mice (JAX stock #007788).
Stereotaxic surgery for in vivo imaging
All surgeries were performed using a stereotaxic apparatus (Model 1900, David Kopf Instruments, CA, USA) and aseptic technique. A stereotaxic cannula holder (SCH_2.5, Doric Lenses Inc., Québec, Canada) attached with a custom adapter (OD = 15.8 mm; ID = 7.9 mm, Doric Lenses Inc.) to a Model 1900–54-A tool block assembly (David Kopf Instruments) was used to insert a polyimide guide cannula into the brain. Guide cannulae ( Bocarsly et al., 2015 ) (Doric Lenses Inc) were custom designed for hippocampus surgeries. The cannula body was made of a thin-walled polyimide tube (0.25 µm wall thickness). The sample-side end was sealed with a 0.13-mm-thick cover glass. The open end of the tube was surrounded by a cap (2.5-mm-diameter body, 3.5-mm-diameter base) that allowed the cannula to be held during implantation and provided a large surface for secure attachment to the skull by dental cement. To fit the 1-mm-diameter GRIN lenses, the polyimide tubes had an inner diameter of 1.07 mm and an outer diameter of 1.12 mm. The length of the polyimide tube was selected such that, with the bottom of the cap contacting the skull, the glass bottom of the cannula was positioned above the deep nuclei of interest (lengths from the bottom of the cap to the glass bottom: 1.55 mm).
Hippocampus surgery
Thy1-GFP line M mice were anesthetized with 1.5% isoflurane and the skull was exposed. After both medial-lateral and anterior-posterior alignment of mouse head at Bregma, the coordinate of implantation center on the right hemisphere (Bregma, −2.06 mm; midline:+2.71 mm) was marked. The animal was then tilted mid-laterally by 10 degrees toward the left hemisphere to slightly compensate for the oblique surface of the hippocampus. Then a 1.5-mm-diameter craniotomy was made. The dura was removed with forceps, and aspiration with a 27G blunt needle was used to slowly remove the cortex and clear a 1.2-mm-diameter pathway within the craniotomy. Each aspiration (50–100 μm-thick tissue removed per aspiration) was followed by repeated irrigation with saline until bleeding stopped completely. These steps continued until the external capsule was exposed. The cortex and topmost layers of the external capsule were carefully aspirated with a 30G blunt needle. After bleeding stopped, a guide cannula was inserted and cemented to the skull using C&B Metabond Cement System (Parkell, Inc., NY, USA). A titanium head-post was attached to the skull with cyanoacrylate glue and Metabond. The open end of the cannula was sealed with a small piece of Parafilm covered by Kwik-Sil (World Precision Instruments, LLC, FL, USA), and after the silicone cured, mice recovered from anesthesia. After one month of recovery from the surgery and habituation to head fixation, we inserted a 1-mm-diameter doublet GRIN lens into the cannula for in vivo imaging in anesthetized mice and removed the GRIN lens at the end of imaging. The cannula was resealed with Parafilm and Kwik-Sil to prevent debris from entering the guide tube.
Lateral hypothalamus surgery
Surgeries were performed as previously described ( Bocarsly et al., 2015 ), except 0.5-mm-diameter singlet GRIN lenses (Go!Foton Corporation) were directly implanted into the brains of Vgat-Cre mice (JAX stock #028862) without guide cannulae (Bregma, −1.4 mm; midline,+0.85 mm; dorsal surface: −5.0 mm; 50 nl AAV2/1-Syn-Flex-GCaMP6s virus) ( Bocarsly et al., 2015 ; Chen et al., 2013 ). Mice were returned to their reverse light cycle holding room after recovery from anesthesia. After post-surgical recovery and habituation to head fixation for at least four weeks, neuronal activity was monitored in awake mice at the end of the light cycle (9 a.m.) ( i.e. , after a period of low food intake) and at the end of the dark cycle (11 p.m.) ( i.e. , after a period of high food intake). Each mouse was imaged during two sessions daily (light cycle end and dark cycle end) with 10 hr between sessions to record neuronal activity when the mice were in native metabolic states similar to hunger and satiety (light cycle end and dark cycle end, respectively). These two sessions were repeated twice with at least 3 days between repetitions.
Immunohistochemistry characterization of the implant site
After data acquisition, mice were anesthetized with an overdose of isoflurane and transcardially perfused with phosphate buffered saline (PBS) followed by 4% paraformaldehyde in PBS. Brains were postfixed in the same fixative overnight and stored at 4˚C for later histological process. Brains were coronally sectioned (50 µm thickness) with a Leica VT1200S vibratome. Alternate brain sections were either immunostained with the astrocyte marker, anti-glial fibrillary acidic protein (GFAP, Sigma Aldrich), or stained with NeuroTrace 530/615 red fluorescent Nissl Stain (ThermoFisher). Consecutive brain sections encompassing the implant site were mounted on glass slides using VECTASHIELD mounting medium with DAPI (Vector Laboratories) and coverslipped for imaging with TissueFAXS 200 (TissueGnostics) at wide-field mode using a 20× objective. In the example brain ( Figure 9 ), only the thin layer of tissue right next to the implant site exhibited enhanced staining for GFAP, in agreement with a previous study ( Bocarsly et al., 2015 ). Nissl staining showed some tissue deformation in the hippocampal structures below the implant site. However, CA1 pyramidal neurons within the imaging FOV (indicated by the green bars in Figure 9 ) maintained laminar distribution. This is consistent with the in vivo imaging results in Figure 8 (same brain as in Figure 9 ), in which the GFP + dendrites and axons were found to have normal morphology and were devoid of signs of cell death (e.g., fragmented axons).
Image processing and analysis
Imaging data were processed with Fiji ( Schindelin et al., 2012 ; Schneider et al., 2012 ) and MATLAB (Mathworks, MA, USA). Raw images were presented with standard color bars in Fiji without further processing, with the exception of Bessel images in Figure 8A,B in which, due to the overwhelmingly bright somata, gamma correction (γ = 0.7 and γ = 0.85, respectively) was applied to enhance the visibility of dendrites. Functional images were registered with TurboReg plugin ( Thévenaz et al., 1998 ) in Fiji for rigid motion and with a non-rigid motion correction algorithm in MATLAB ( Pnevmatikakis and Giovannucci, 2017 ). ROIs were selected and outlined manually in Fiji. The averaged fluorescent signal within the ROI was then extracted with custom MATLAB codes (available online as a source code file) and used to calculate calcium transients. The traces in Figure 10 were smoothed with a constrained deconvolution (CD) method in MATLAB ( Pnevmatikakis et al., 2016 ).
Additional files 10.7554/eLife.40805.014 Transparent reporting form Data availability Almost all data needed to evaluate the conclusions in the paper are present in the paper or the supplementary materials; Raw image data for Figs. 2-10 are available from Dryad, 10.5061/dryad.pr4t978 The following dataset was generated: Meng G Liang Y 2019 Data from: High-throughput synapse-resolving two-photon fluorescence microendoscopy for deep-brain volumetric imaging in vivo Dryad 10.5061/dryad.pr4t978 PMC6338462 30604680
📊 Figures
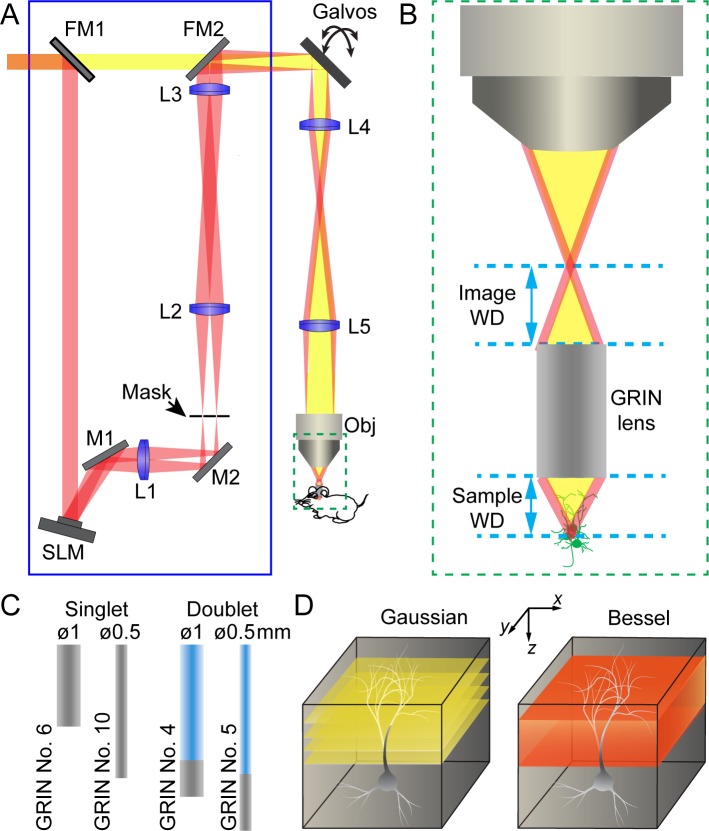
Figure 1.
Schematics of two-photon excitation fluorescence microendoscopy with a Bessel focus scanning module.
( A ) A Bessel focus scanning module (blue rectangle) made of a spatial light modulator (SLM), a lens (L1), and an annular mask is incorporated into a two-photon fluorescence microendoscopy system. L2...
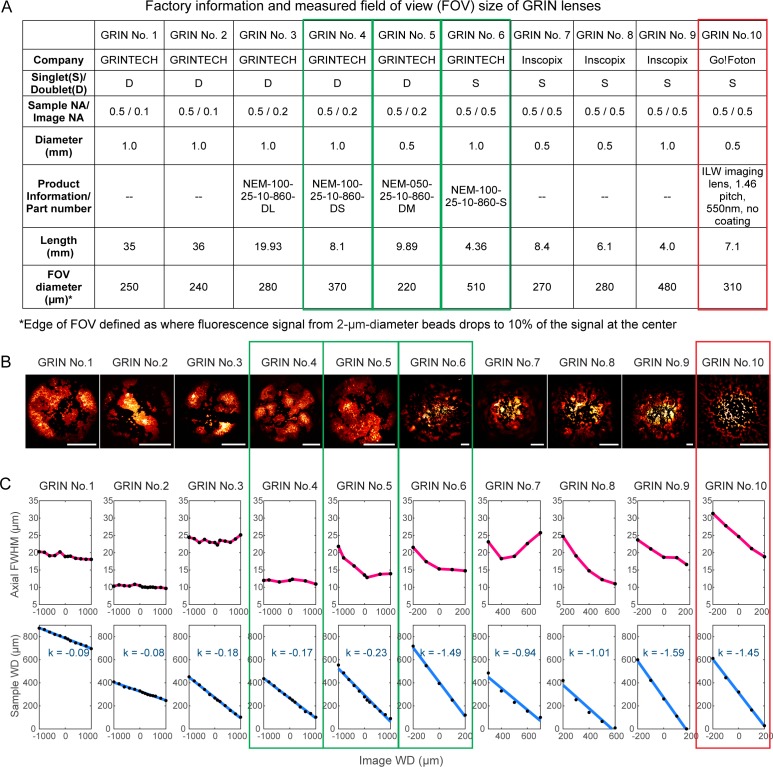
Figure 2.
Characterization of ten GRIN lenses.
( A ) Factory information and field of view (FOV) sizes of ten GRIN lenses. ( B ) Maximal intensity projections of 3D image stacks of 2-u00b5m-diameter fluorescent beads obtained under conventional Ga...
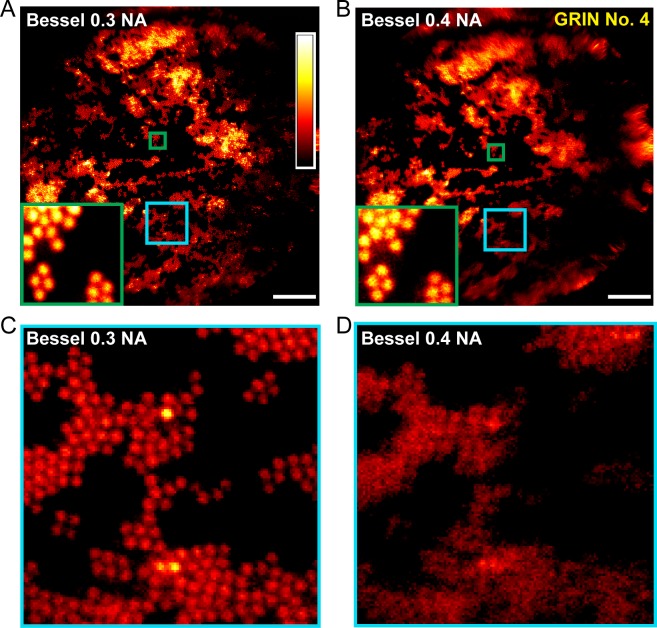
Figure 3.
0.3-NA Bessel foci achieves better imaging performance than 0.4-NA Bessel foci.
( A,B ) Images of 2-u03bcm-diameter fluorescent beads obtained with Bessel foci of 0.3 NA, 51 u00b5m axial FWHM and 0.4 NA, 45 u00b5m axial FWHM, respectively. Insets show enlarged views of beads at F...
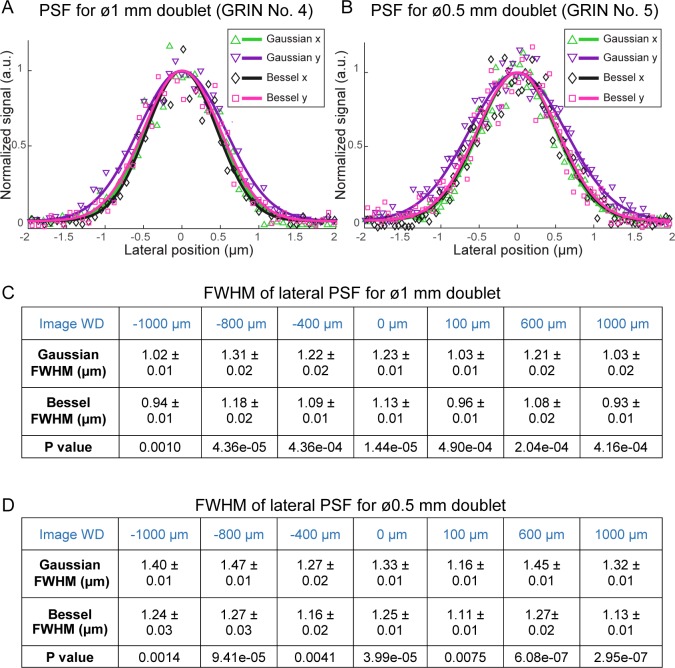
Figure 4.
0.3-NA Bessel foci have higher lateral resolution than 0.5-NA Gaussian foci through GRIN lenses.
( A,B ) Lateral point spread functions (PSFs) of 0.3-NA Bessel foci (axial FWHM: 57 u00b5m) and 0.5-NA Gaussian foci measured with 0.2-u00b5m-diameter fluorescent beads through 1 mm and 0.5 mm doublet...
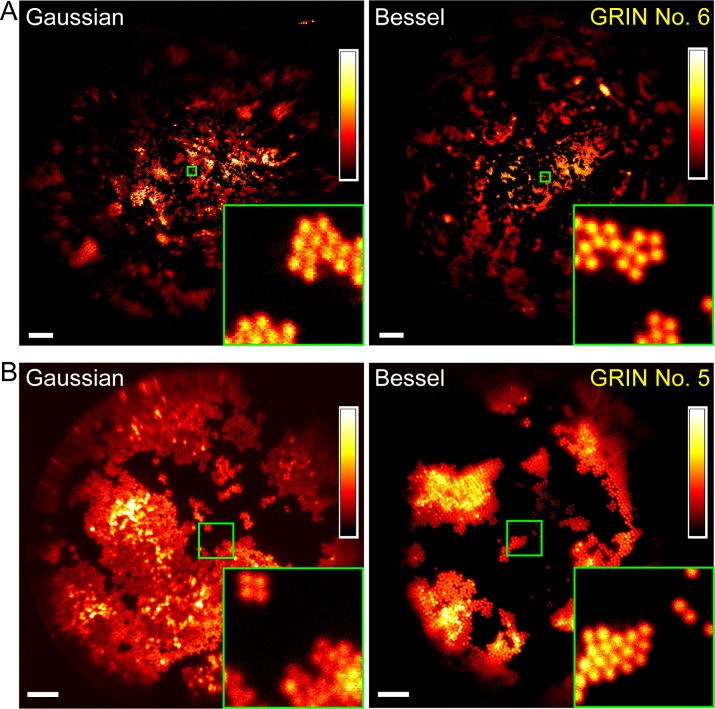
Figure 5.
Bessel focus scanning produces superior imaging performance to Gaussian focus scanning.
( A ) Through a 1-mm-diameter singlet GRIN lens, Bessel focus scanning has a larger FOV and resolves 2-u00b5m-diameter beads at the central FOV. ( B ) Through a 0.5-mm-diameter doublet GRIN lens, Bess...
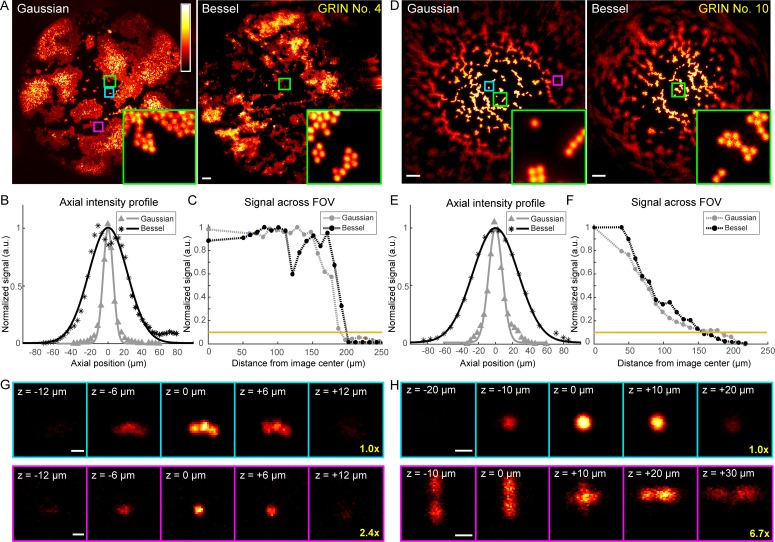
Figure 6.
Higher quality GRIN lenses produce superior images with both Gaussian and Bessel foci.
( A ) Images of 2-u00b5m-diameter fluorescent beads obtained with a 0.5-NA Gaussian and a 0.3-NA Bessel focus, respectively, through a 1-mm-diameter doublet GRIN lens. Insets: zoomed-in views of beads...
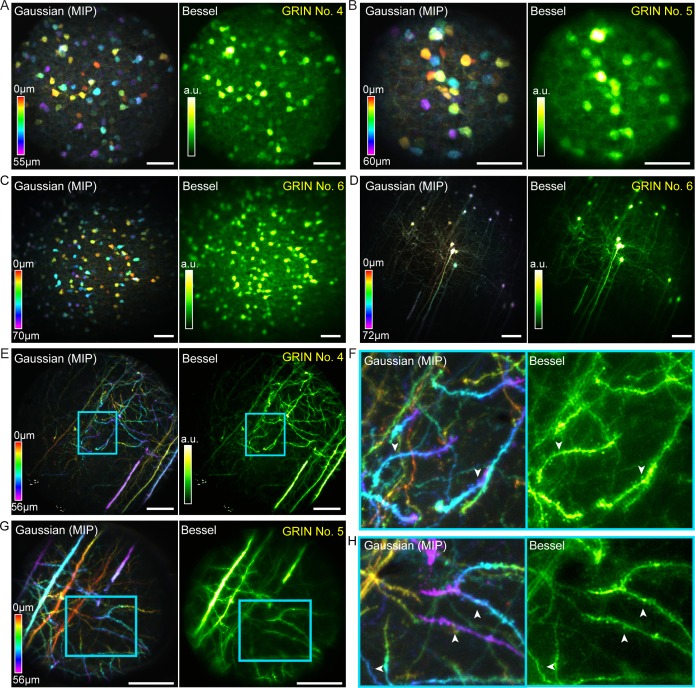
Figure 7.
Bessel focus scanning improves imaging throughput and lateralu00a0resolution of two-photon fluorescence microendoscopy in fixed brain tissue.
( A ) Left: GABAergic neurons in a 370u00a0u00d7u00a0370u00a0u00d7u00a055 u00b5m 3 volume color-coded by depth, imaged via 12 2D scans of a Gaussian focus through GRIN No. 4. Right: A single 2D scan o...
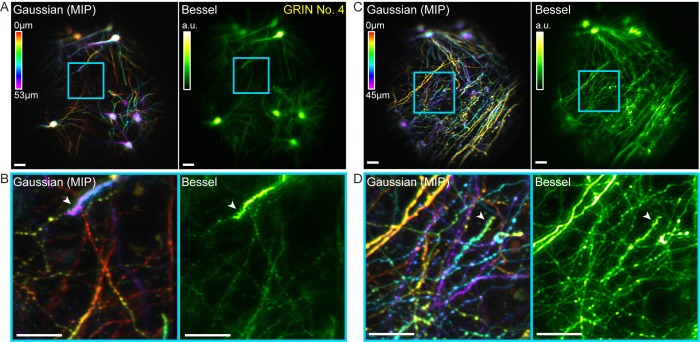
Figure 8.
Bessel focus scanning allows volumetric microendoscopic imaging of dendritic spines and axonal boutons in mouse hippocampus in vivo.
( A ) Left panel: Hippocampal neurons and neurites within a 370 u03bcmu00a0u00d7u00a0370 u03bcm u00d7 53 u03bcm volume color-coded by depth, imaged via 14 2D scans of a Gaussian focus through a 1-mm-d...
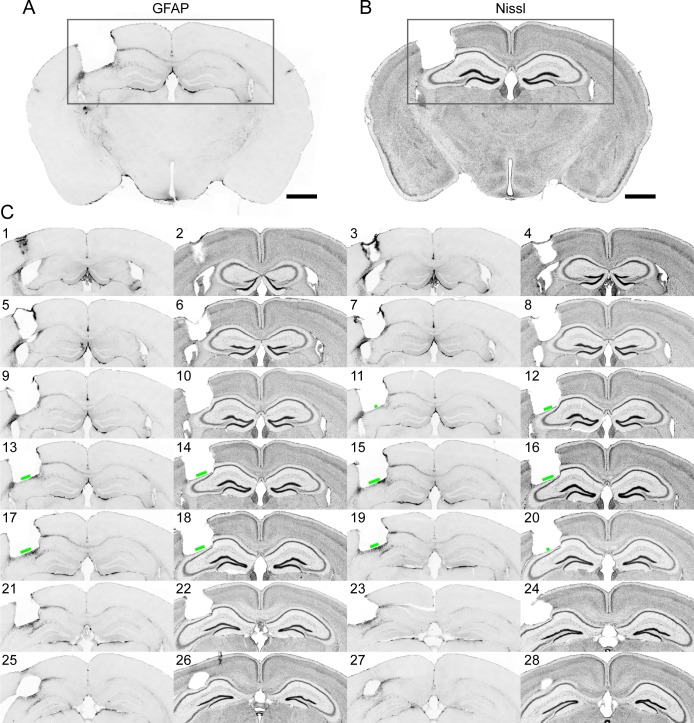
Figure 9.
Immunohistochemistry on brain sections surrounding the GRIN lens implantation site.
( A ) and ( B ) Representative brain slices labeled with GFAP antibody and Nissl staining, respectively. ( C ) Consecutive sections of a brain alternately stained against GFAP (odd number labels) and ...
Video 1.
Example volumetric microendoscopy recordings of GCaMP6s+u00a0lateral hypothalamic GABAergic neurons in Figure 10A (Mouse 1).
All the neurons within the 310 u00b5mu00a0u00d7u00a0310 u00b5m u00d7 63 u00b5m volume were in focus throughout the recording, indicating the absence of axial motion artifact via Bessel focus scanning....
Video 2.
Example volumetric microendoscopy recordings of GCaMP6s+u00a0lateral hypothalamic GABAergic neurons in Figure 10B (Mouse 2).
All the neurons within the 310 u00b5mu00a0u00d7u00a0310 u00b5m u00d7 63 u00b5m volume were in focus throughout the recording, indicating the absence of axial motion artifact via Bessel focus scanning....
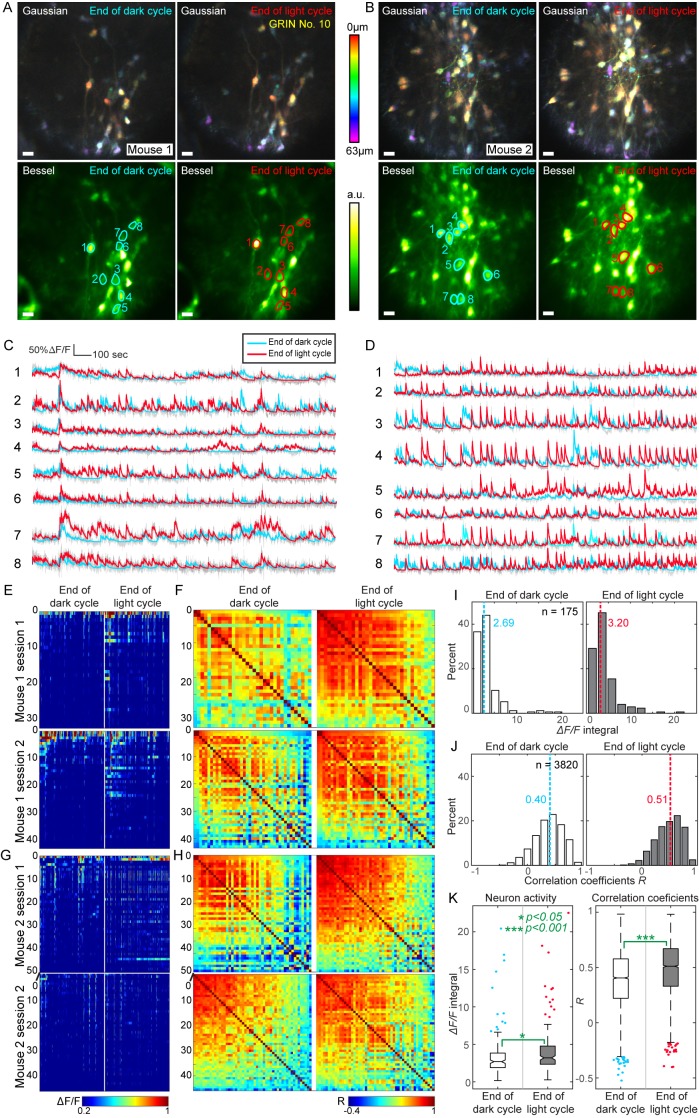
Figure 10.
High throughput functional imaging via Bessel focus scanning enables monitoring of 3D population dynamics of GABAergic neurons in lateral hypothalamus during different metabolic states.
( A, B ) In two mice, Gaussian stacks were taken through a 0.5-mm-diameter singlet GRIN lens of neurons in a 310 u03bcmu00a0u00d7u00a0310 u03bcm u00d7 63 u03bcm volume (top panels, color-coded by dept...
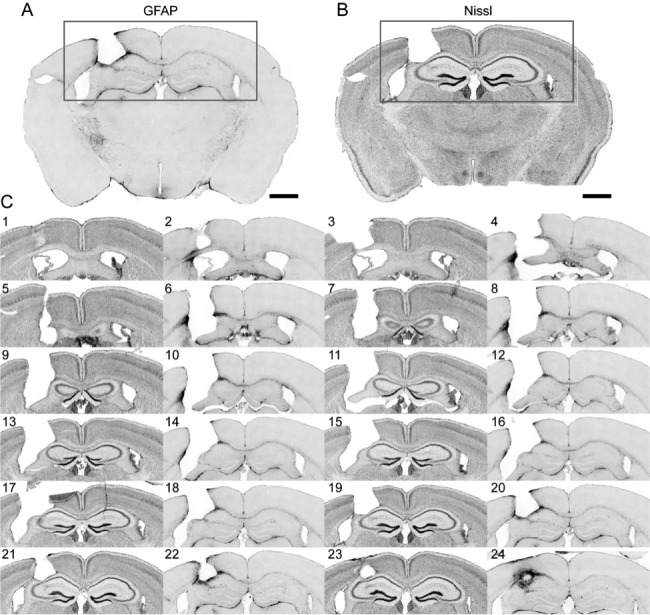
Author response image 1.
Immunohistochemistry on brain sections surround the GRIN lens implantation site.
( A ) and ( B) Representative brain slices labeled with GFAP antibody and Nissl staining, respectively. ( C ) Consecutive sections of a brain alternately stained against GFAP (even number labels) and ...
Figure images are served from the NIH/NLM PubMed Central Open Access Subset or Europe PMC; copyright remains with the publishers and authors.
💬 Discussion
0 commentsNo comments yet. Be the first to start a discussion!
Leave a Comment