Abstract
AbstractMany filamentous plant pathogens exhibit high levels of genomic variability, yet the impact of this variation on host–pathogen interactions is largely unknown. We have addressed host specialization in the wheat pathogen Zymoseptoria tritici. Our study builds on comparative analyses of infection and gene expression phenotypes of three isolates and reveals the extent to which genomic variation translates into phenotypic variation. The isolates exhibit genetic and genomic variation but are similarly virulent. By combining confocal microscopy, disease monitoring, staining of ROS, and comparative transcriptome analyses, we conducted a detailed comparison of the infection processes of these isolates in a susceptible wheat cultivar. We characterized four core infection stages: establishment, biotrophic growth, lifestyle transition, and necrotrophic growth and asexual reproduction that are shared by the three isolates. However, we demonstrate differentiated temporal and spatial infection development and significant differences in the expression profiles of the three isolates during the infection stages. More than 20% of the genes were differentially expressed and these genes were located significantly closer to transposable elements, suggesting an impact of epigenetic regulation. Further, differentially expressed genes were enriched in effector candidates suggesting that isolate‐specific strategies for manipulating host defenses are present in Z. tritici. We demonstrate that individuals of a host‐specialized pathogen have highly differentiated infection programs characterized by flexible infection development and functional redundancy. This illustrates how high genetic diversity in pathogen populations results in highly differentiated infection phenotypes, which fact needs to be acknowledged to understand host–pathogen interactions and pathogen evolution.
🔬 Techniques
🔭 Microscopes
🧬 Organisms
💻 Software
✨ Fluorophores
🧪 Sample Preparation
🏭 Microscope Brands
🧪 Reagent Suppliers
💻 Software Details
💾 Data Repositories
🏛️ Research Organizations (ROR)
Affiliated research institutions:
📋 Methods
Isolates and growth conditions
We used three Zymoseptoria tritici isolates for all experiments: Zt05 (Thygesen, Jørgensen, Jensen, & Munk, 2008 ), Zt09 (≙ IPO323ΔChr18, a derivate of the reference strain IPO323 (Goodwin et al., 2011 ) that lost chromosome 18 (Kellner et al., 2014 )), and Zt10 (Stukenbrock, Banke, Javan‐Nikkhah, & McDonald, 2007 ) (Supporting Information Table S1 ). Fungal cells were inoculated from glycerol stocks onto YMS agar (0.4% [w/v] yeast extract, 0.4% [w/v] malt extract, 0.4% [w/v] sucrose, 2% [w/v] bacto agar) and grown at 18°C for 5 days. Single cells were grown in liquid YMS (200 rpm, 18°C) for 2 days and harvested by centrifugation (3,500 rpm for 10 min).
Plant infection experiments
We conducted all plant infection experiments in controlled plant growth chambers and inoculated 14‐day‐old seedlings of the winter wheat ( Triticum aestivum ) cultivar Obelisk (Wiersum Plantbreeding, Winschoten, Netherlands). Fungal inoculum was adjusted to 1 × 10 8 cells/ml in 0.1% [v/v] Tween 20 (Roth, Karlsruhe, Germany) and brushed onto labeled areas (8 to 12 cm) of the second leaves. The same treatment without fungal cells was applied for mock controls. Plants were incubated for 48 hr at 22°C [day]/20°C [night] and 100% humidity with a 16‐hr light period. Subsequently, humidity was reduced to 70%. Plants were grown for three or four weeks after inoculation, depending on the experiment. In planta phenotypic assays To compare quantitative virulence of Zt05, Zt09, and Zt10 on wheat, we performed three independent, randomized infection experiments with blinded inoculation and evaluation. Inoculated leaf areas of 460 leaves (Zt05: 116, Zt09: 118, Zt10: 118, mock control: 108) were evaluated at 28 days post infection (dpi) by scoring the observed disease symptoms based on the percentage of leaf area covered by necrosis and pycnidia (Poppe, Dorsheimer, Happel, & Stukenbrock, 2015 ). We differentiated six categories (Supporting Information Figure S1 ): 0 (no visible symptoms), 1 (1%–20%), 2 (21%–40%), 3 (41%–60%), 4 (61%–80%), and 5 (81%–100%). Statistical differences were evaluated by Mann–Whitney U test considering differences significant if p ≤ 0.01. To compare the temporal disease development, we manually inspected 40 inoculated leaves per isolate between 9 and 27 dpi and registered the occurrence of first visible symptoms every two days. Individual leaves were documented using a Leica S8APO equipped with a Leica DFC450 camera. To localize and visualize the reactive oxygen species H 2 O 2 within infected leaf tissue, we conducted 3,3′‐diaminobenzidine (DAB) staining (Thordal‐Christensen, Zhang, Wei, & Collinge, 1997 ) at 2, 4, 7–11, 14, 16, 18, and 21 dpi and quantified the reddish‐brown precipitate in cleared leaves which indicates an accumulation of H 2 O 2 (Supporting Information Text S1 ). Leaves were documented prior and post staining.
Show full methods section
Isolates and growth conditions
We used three Zymoseptoria tritici isolates for all experiments: Zt05 (Thygesen, Jørgensen, Jensen, & Munk, 2008 ), Zt09 (≙ IPO323ΔChr18, a derivate of the reference strain IPO323 (Goodwin et al., 2011 ) that lost chromosome 18 (Kellner et al., 2014 )), and Zt10 (Stukenbrock, Banke, Javan‐Nikkhah, & McDonald, 2007 ) (Supporting Information Table S1 ). Fungal cells were inoculated from glycerol stocks onto YMS agar (0.4% [w/v] yeast extract, 0.4% [w/v] malt extract, 0.4% [w/v] sucrose, 2% [w/v] bacto agar) and grown at 18°C for 5 days. Single cells were grown in liquid YMS (200 rpm, 18°C) for 2 days and harvested by centrifugation (3,500 rpm for 10 min).
Plant infection experiments
We conducted all plant infection experiments in controlled plant growth chambers and inoculated 14‐day‐old seedlings of the winter wheat ( Triticum aestivum ) cultivar Obelisk (Wiersum Plantbreeding, Winschoten, Netherlands). Fungal inoculum was adjusted to 1 × 10 8 cells/ml in 0.1% [v/v] Tween 20 (Roth, Karlsruhe, Germany) and brushed onto labeled areas (8 to 12 cm) of the second leaves. The same treatment without fungal cells was applied for mock controls. Plants were incubated for 48 hr at 22°C [day]/20°C [night] and 100% humidity with a 16‐hr light period. Subsequently, humidity was reduced to 70%. Plants were grown for three or four weeks after inoculation, depending on the experiment. In planta phenotypic assays To compare quantitative virulence of Zt05, Zt09, and Zt10 on wheat, we performed three independent, randomized infection experiments with blinded inoculation and evaluation. Inoculated leaf areas of 460 leaves (Zt05: 116, Zt09: 118, Zt10: 118, mock control: 108) were evaluated at 28 days post infection (dpi) by scoring the observed disease symptoms based on the percentage of leaf area covered by necrosis and pycnidia (Poppe, Dorsheimer, Happel, & Stukenbrock, 2015 ). We differentiated six categories (Supporting Information Figure S1 ): 0 (no visible symptoms), 1 (1%–20%), 2 (21%–40%), 3 (41%–60%), 4 (61%–80%), and 5 (81%–100%). Statistical differences were evaluated by Mann–Whitney U test considering differences significant if p ≤ 0.01. To compare the temporal disease development, we manually inspected 40 inoculated leaves per isolate between 9 and 27 dpi and registered the occurrence of first visible symptoms every two days. Individual leaves were documented using a Leica S8APO equipped with a Leica DFC450 camera. To localize and visualize the reactive oxygen species H 2 O 2 within infected leaf tissue, we conducted 3,3′‐diaminobenzidine (DAB) staining (Thordal‐Christensen, Zhang, Wei, & Collinge, 1997 ) at 2, 4, 7–11, 14, 16, 18, and 21 dpi and quantified the reddish‐brown precipitate in cleared leaves which indicates an accumulation of H 2 O 2 (Supporting Information Text S1 ). Leaves were documented prior and post staining.
Analysis of Z. tritici wheat infection by confocal microscopy
Development of Z. tritici isolates within and on the surface of wheat leaves was analyzed by confocal laser scanning microscopy. We harvested infected wheat leaves at 3–14, 17, 19–21, 24, 25, and 28 dpi and analyzed the interactions between fungal hyphae and wheat tissue. Likewise, we analyzed infected leaves to determine the infection stage of leaf samples used for RNA extraction (see below). In total, we studied 37 infected wheat leaves for Zt05, 34 for Zt09, and 30 for Zt10 (Supporting Information Table S1 ), analyzed at least 15 infection events per leaf sample by confocal microscopy, and created a total of 113 confocal image z‐stacks. Cleared leaf material was stained with wheat germ agglutinin conjugated to fluorescein isothiocyanate (WGA‐FITC) in combination with propidium iodide (PI) (Supporting Information Text S1 for staining protocol). Microscopy was conducted using a Leica TCS SP5 (Leica Microsystems, Germany) and a Zeiss LSM880 (Carl Zeiss Microscopy, Germany). FITC was excited at 488 nm (argon laser) and detected between 500 and 540 nm. PI was excited at 561 nm (diode‐pumped solid‐state laser) and detected between 600 and 670 nm. Analyses, visualization, and processing of image z‐stacks were performed using Leica Application Suite Advanced Fluorescence (Leica Microsystems, Germany), ZEN black and Zen blue (Carl Zeiss Microscopy, Germany), and AMIRA ® (FEI TM Visualization Science Group, Germany). Animations of image z ‐stacks are .avi format and can be played in VLC media player (available at http://www.videolan.org/vlc/ ).
Transcriptome analyses of Z. tritici isolates during wheat infection Total
RNA from Z. tritici ‐infected wheat material collected during one infection experiment was isolated using the TRIzol™ reagent (Invitrogen, Karlsruhe, Germany) according to the manufacturer's instructions. One biological sample consists of material from three inoculated second leaves that were pooled and homogenized in liquid nitrogen. One hundred milligram of the resulting powder was used for RNA extraction. Because our analyses revealed isolate‐specific differences in the temporal infection development, we used independent sampling schedules for each isolate to be able to compare their transcriptomes during the same infection stage (Supporting Information Table S2 ). We collected infected leaf material at up to nine time points per isolate and assigned infection stages by examining central sections (1–2 cm) of each leaf by confocal microscopy (Supporting Information Figure S2 ). Per isolate and infection stage, the two most representative samples were selected as biological replicates for transcriptome sequencing (Table 1 ).
Preparation of strand‐specific
RNA‐seq libraries including polyA enrichment was performed at the Max Planck Genome Center, Cologne, Germany ( http://mpgc.mpipz.mpg.de ), using the NEBNext Ultra TM Directional RNA Library Prep Kit for Illumina according to the manufacturer's protocol (New England Biolabs, Frankfurt/Main, Germany) with an input of 1 µg total RNA. Sequencing, performed using an Illumina HiSeq 2,500 platform, generated strand‐specific, 100‐base, single‐end reads with an average yield of 112 million reads per sample (Supporting Information Table S3 ). Table 1 Summary of the stage‐specific transcriptomes (A–D) of the three Zymoseptoria tritici isolates Isolate Infection stage Sample Time point (dpi) No. of filtered reads No. of reads mapped to genome % reads mapped to genome No. of genes RPKM ≥2 a No. of genes RPKM ≥10 a Zt05 b A Zt05_Ta_A_01 3 107,507,137 15,213,307 14.15 9,302 7,455 Zt05_Ta_A_02 81,479,903 10,509,515 12.90 B Zt05_Ta_B_01 8 113,732,295 15,057,425 13.24 9,404 7,623 Zt05_Ta_B_02 128,271,704 14,856,314 11.58 C Zt05_Ta_C_01 13 91,298,814 26,756,807 29.31 9,538 7,982 Zt05_Ta_C_02 135,198,719 34,329,884 25.39 D Zt05_Ta_D_01 20 86,100,462 41,871,582 48.63 9,585 7,914 Zt05_Ta_D_02 119,101,106 76,123,086 63.91 Zt09 c A Zt09_Ta_A_01 4 129,342,007 5,868,572 4.54 9,435 7,482 Zt09_Ta_A_02 92,711,865 5,582,561 6.02 B Zt09_Ta_B_01 11 96,767,482 5,034,677 5.20 9,718 7,910 Zt09_Ta_B_02 103,428,015 5,964,566 5.77 C Zt09_Ta_C_01 13 121,529,652 31,264,373 25.73 9,892 8,220 Zt09_Ta_C_02 93,253,633 27,790,773 29.80 D Zt09_Ta_D_01 20 110,296,264 84,263,562 76.40 9,867 7,949 Zt09_Ta_D_02 101,757,635 75,044,880 73.75 Zt10 d A Zt10_Ta_A_01 6 93,557,587 4,895,650 5.23 8,814 7,219 Zt10_Ta_A_02 91,111,840 4,836,535 5.31 B Zt10_Ta_B_01 11 94,828,793 5,951,869 6.28 9,068 7,407 Zt10_Ta_B_02 110,255,245 7,896,227 7.16 C Zt10_Ta_C_01 13 86,652,710 20,804,110 24.01 9,241 7,742 Zt10_Ta_C_02 91,070,127 8,620,099 9.47 D Zt10_Ta_D_01 24 98,493,807 29,939,216 30.40 9,062 7,308 Zt10_Ta_D_02 93,690,628 34,607,371 36.94 Note Overview of RNA‐seq datasets including time point of sampling, number of sequenced reads post filtering, number of mapped reads, percentage of mapped reads, and numbers of transcribed genes. a RPKM values were calculated using Cuffdiff2 and are normalized over all infection stages within the respective isolate (normalization method: geometric, dispersion method: per‐condition). b 11,138 genes of IPO323 (94.08%) found by nucleotide blast for Zt05. c 11,754 of the 11,839 genes predicted and annotated for IPO323 (Grandaubert et al., 2015 ); 85 genes located on chromosome 18 were not considered. d 10,745 genes of IPO323 (90.76%) found by nucleotide blast for Zt10. John Wiley & Sons, Ltd We assessed the quality of the sequencing data with FastQC v0.11.2 ( http://www.bioinformatics.babraham.ac.uk/projects/fastqc/ ) and applied a stringent trimming and filtering protocol using FASTX‐toolkit v0.0.14 ( http://hannonlab.cshl.edu/fastx_toolkit/ ) and Trimmomatic (Bolger, Lohse, & Usadel, 2014 ) v0.33 (Supporting Information Text S1 for details). The resulting 88‐bp reads were mapped against the genome of the respective isolate with TopHat2 v2.0.9 (Kim et al., 2013 ). Read alignments were stored in SAM format, and indexing, sorting, and conversion to BAM format were performed using SAMtools v0.1.19 (Li et al., 2009 ). Relative abundance of transcripts for predicted genes was calculated in RPKM by Cuffdiff2 v2.2.1 (Trapnell et al., 2013 ). Raw read counts per gene were estimated with HTSeq v0.6.1p1 (Anders, Pyl, & Huber, 2015 ). Gene coordinates in the Zt05 (Supporting Information Table S4 ) and Zt10 (Supporting Information Table S5 ) genomes were obtained by mapping the predicted genes of IPO323 using nucleotide BLAST alignments ( e ‐value cutoff 1 e −3 , identity ≥90%, query coverage 90%–110%). Differential gene expression analyses between Z. tritici infection stages and isolates were performed in R (R Core Team, 2017 ) using the Bioconductor package DESeq2 v1.10.1 (Love, Huber, & Anders, 2014 ). Significant signals of differential expression for the most strongly changing genes were determined with p adj ≤0.01 and |log 2 fold change ≥2| as recommended for RNA‐seq experiments with a low number of replicates (Schurch et al., 2016 ). The R package topGO (Alexa, Rahnenführer, & Lengauer, 2006 ) was used to perform Gene Ontology (GO) term enrichment analyses. p Values for each GO term (Grandaubert, Bhattacharyya, & Stukenbrock, 2015 ) were calculated using Fischer's exact test applying the topGO algorithm “weight01” considering GO term hierarchy. We reported categories significant with p ≤ 0.01 for the ontology “Biological Process.” PFAM domain enrichment analyses were performed using a custom python script, and p values were calculated using chi‐square tests. To analyze genomic distances between differentially expressed genes and transposable elements (TEs), we annotated TEs as described in Grandaubert et al. ( 2015 ) for Zt05 (Supporting Information Table S6 ) and Zt10 (Supporting Information Table S7 ) and used the published TE annotation of IPO323 for Zt09 (Grandaubert et al., 2015 ). Distances between genes of interest and the closest annotated TEs were calculated with bedtools v2.26 (Quinlan & Hall, 2010 ). Likewise, we used ChIP‐seq peak data (Schotanus et al., 2015 ) to calculate distances between genes and the closest H3K9me3 and H3K27me3 peaks. Statistical analyses were performed in R. For a detailed overview, see Supporting Information Text S1 .
Pulsed‐field gel electrophoresis
A non‐protoplast protocol (Supporting Information Text S1 ) was used to produce DNA plugs for separation of small chromosomes (~0.2 to 1.6 Mb) by pulsed‐field gel electrophoresis (PFGE) (Stukenbrock et al., 2010 ). Chromosomal DNA of Saccharomyces cerevisiae (Bio‐Rad, Munich, Germany) was used as standard size marker. Gels were stained in 1 µg/ml ethidium bromide solution, and chromosome bands were detected with Thyphoon Trio™ (GE Healthcare, Munich, Germany).
De novo genome assemblies of Z. tritici isolates
Zt05 and Zt10 and synteny analyses
DNA of Zt05 and Zt10 was extracted from single cells using the CTAB extraction protocol (Allen, Flores‐Vergara, Krasynanski, Kumar, & Thompson, 2006 ) and used as input to prepare Pacific Biosciences (PacBio) SMRTbell libraries. Single‐molecule real‐time (SMRT) sequencing was performed on four SMRT cells and run on a PacBio RS II instrument at the Max Planck Genome Center. Genome assemblies of Zt05 and Zt10 based on the generated reads were done as previously described (Plissonneau, Stürchler, & Croll, 2016 ) using HGAP (Chin et al., 2013 ) v3.0 included in SMRTanalysis suite v2.3.0. For further details, see Supporting Information Text S1 . Synteny of Z. tritici reference strain IPO323 and the Zt05 and Zt10 unitigs was compared using SyMAP v4.2 (Soderlund, Bomhoff, & Nelson, 2011 ) applying default settings and considering all unitigs ≥1,000 bp (Zt05) and ≥10,000 bp (Zt10). To estimate the amount of unique DNA in Zt05 and Zt10 in comparison with IPO323 and Zt09, respectively, we generated pairwise genome alignments with Mugsy v1.r2.2 (Angiuoli & Salzberg, 2011 ) applying default settings. Alignments were analyzed using a custom python script to extract unique DNA blocks with a minimum length of 1 bp.
Supporting information Click here for additional data file. Click here for additional data file. Click here for additional data file. Click here for additional data file. Click here for additional data file. Click here for additional data file. Click here for additional data file. Click here for additional data file. Click here for additional data file. Click here for additional data file. Click here for additional data file. Click here for additional data file. Click here for additional data file. Click here for additional data file. Click here for additional data file. Click here for additional data file. Click here for additional data file. Click here for additional data file. Click here for additional data file. Click here for additional data file. Click here for additional data file. Click here for additional data file. Click here for additional data file. Click here for additional data file. Click here for additional data file. Click here for additional data file. Click here for additional data file. Click here for additional data file.
📊 Figures
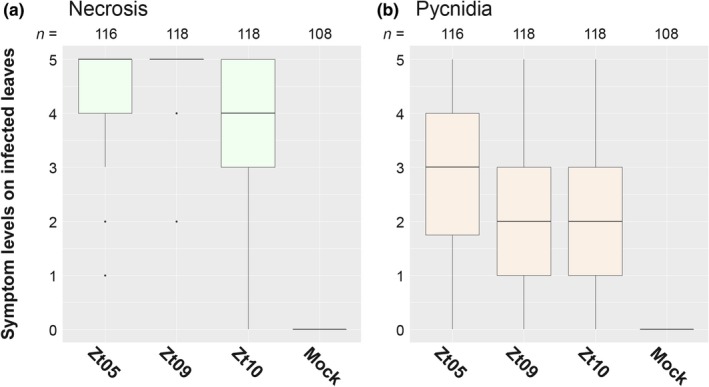
Figure 1
In planta phenotypic assay demonstrates similar pycnidia levels of Zymoseptoria tritici isolates on the susceptible wheat cultivar Obelisk. Quantitative differences in (a) necrosis and (b) pycnidia co...
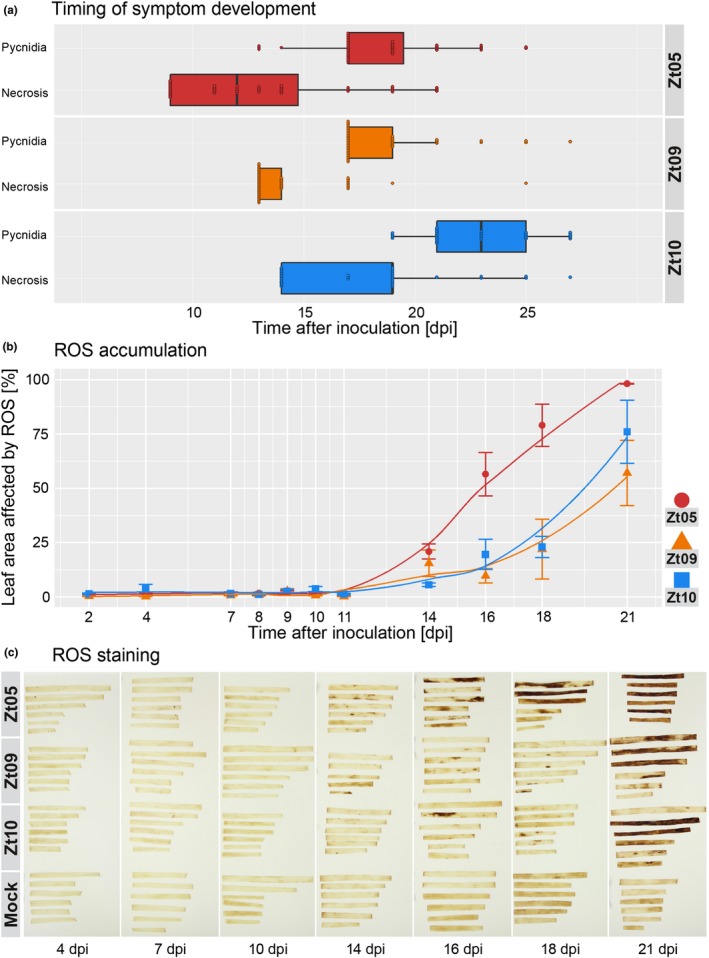
Figure 2
Timing of disease symptom development and H 2 O 2 accumulation varies between wheat leaves infected with different Zymoseptoria tritici isolates. (a) Temporal disease progression for infections with Z...
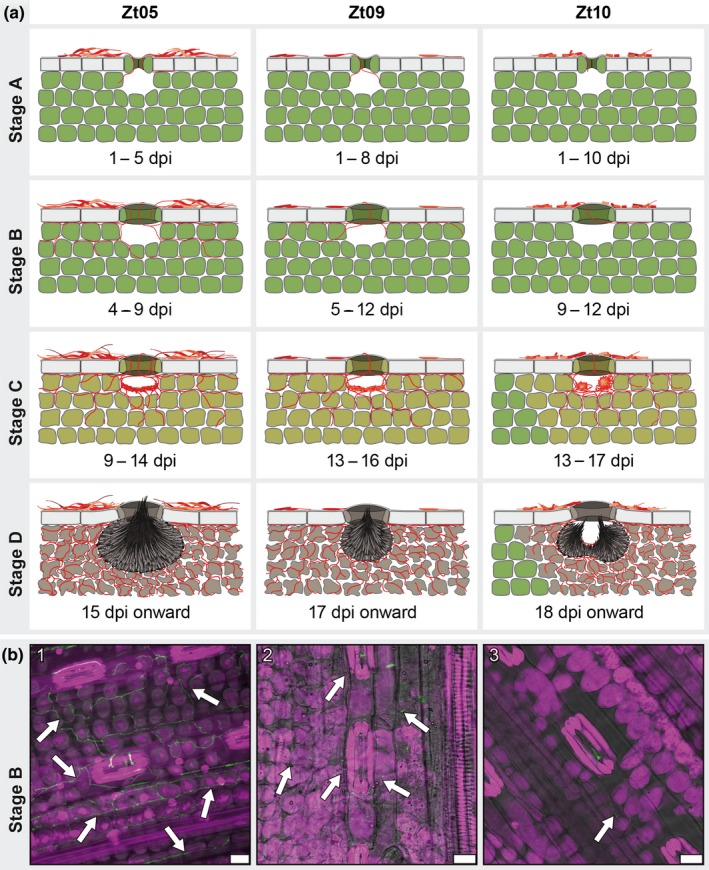
Figure 3
Zymoseptoria tritici wheat infections are characterized by four distinct infection stages and isolateu2010specific infection development. (a) Schematic drawings of the key features that characterize t...
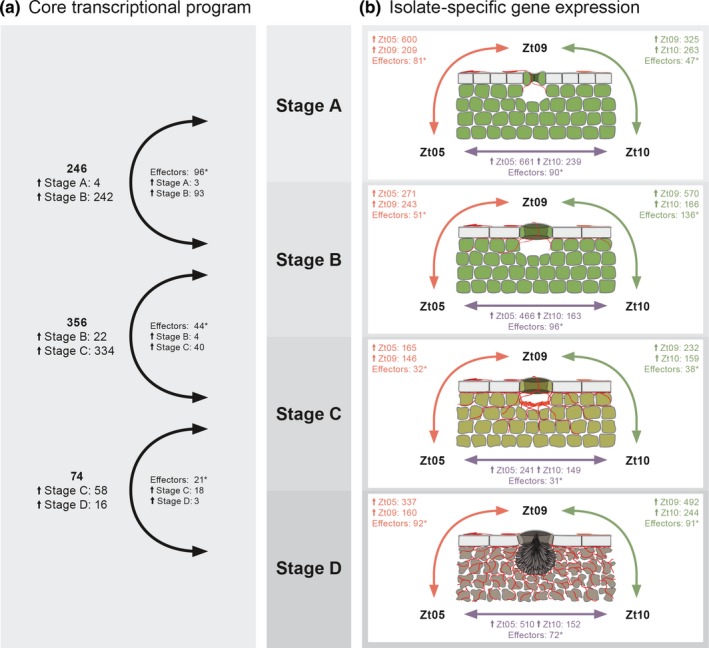
Figure 4
Zymoseptoria tritici core transcriptional program during wheat infection and isolateu2010specific expression during the four infection stages. Numbers of significantly differentially expressed genes a...
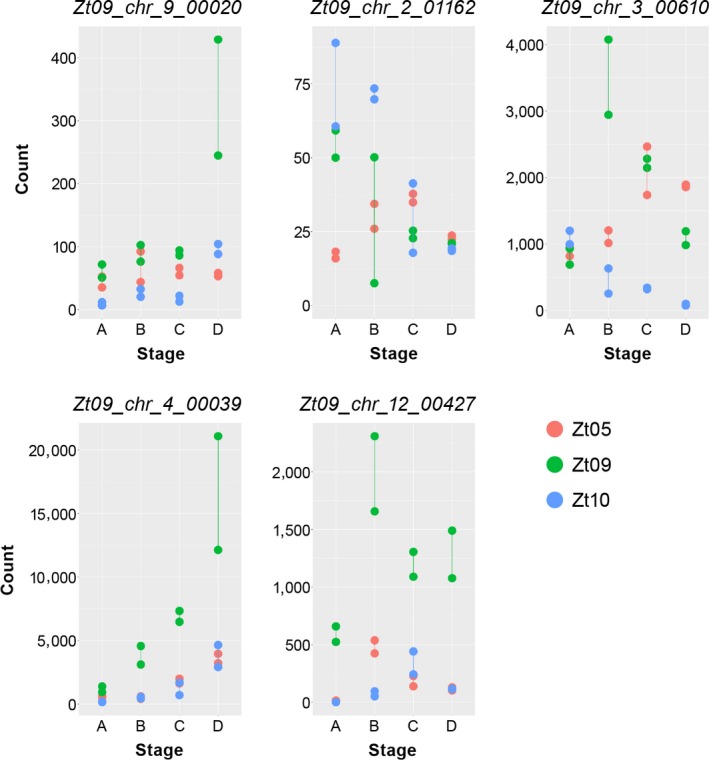
Figure 5
Five effector candidates with highly differentiated expression profiles in the three isolates during wheat infection. The plots display normalized read counts for five effector candidate genes for the...
Figure images are served from the NIH/NLM PubMed Central Open Access Subset or Europe PMC; copyright remains with the publishers and authors.
💬 Discussion
0 commentsNo comments yet. Be the first to start a discussion!
Leave a Comment