Abstract
Endothelial cells in straight sections of vessels are known to elongate and align in the direction of flow. This phenotype has been replicated in confluent monolayers of bovine aortic endothelial cells and human umbilical vein endothelial cells (HUVECs) in cell culture under physiological shear stress. Here we report on the morphological response of human brain microvascular endothelial cells (HBMECs) in confluent monolayers in response to shear stress. Using a microfluidic platform we image confluent monolayers of HBMECs and HUVECs under shear stresses up to 16 dyne cm(-2). From live-cell imaging we quantitatively analyze the cell morphology and cell speed as a function of time. We show that HBMECs do not undergo a classical transition from cobblestone to spindle-like morphology in response to shear stress. We further show that under shear stress, actin fibers are randomly oriented in the cells indicating that there is no cytoskeletal remodeling. These results suggest that HBMECs are programmed to resist elongation and alignment under shear stress, a phenotype that may be associated with the unique properties of the blood-brain barrier.
🔬 Techniques
💻 Software
✨ Fluorophores
🧪 Sample Preparation
🔬 Cell Lines
🏭 Microscope Brands
🧪 Reagent Suppliers
💻 Software Details
🏛️ Research Organizations (ROR)
Affiliated research institutions:
📋 Methods
Microfluidic platform The microfluidic device ( Fig. 1a–b ) was fabricated from polydimethylsiloxane (PDMS, Sylgard) using a machined aluminum mold with four rectangular channels connected in series. Each channel was 4 mm wide and 50 mm long, with heights of 390 μm, 450 μm, 550 μm, and 770 μm, respectively. PDMS was poured to fill half of the mold and partially cured at 100°C for 15 min. Nylon spacers (5mm ID, McMaster) forming the bubble traps were placed on top of the PDMS and sealed with a second layer of PDMS cured at 100 °C for 45 min. The PDMS blocking the bubble traps was removed using a 5 mm inner diameter hole punch and the inlets and outlets were made using a 1.50 mm hole punch. The PDMS channels were then plasma bonded to a 50 mm × 75 mm glass microscope slide (Corning). 6.35 mm ID silicon tubing (McMaster) was used to connect the nylon inserts to the caps of the bubble traps, which was a male Luer to hosebarb connector with a female Luer cap (Cole Parmer). For Poiseuille flow in a rectangular channel, the wall shear stress was given by τ = 6Qμ/h 2 w where Q was volumetric flow rate, μ was dynamic viscosity, h was channel height, and w was channel width. The channel heights were chosen such that the shear stress in the four channels scales in the ratio 1:2:3:4. The flow setup was composed of a custom machined Teflon media reservoir connected to 1/8″ ID silicon tubing (McMaster) ( Fig. 1a–c ). Media from the Teflon reservoir passed through a 1.5 m coil of silicon tubing located in a gas exchange chamber (In Vivo Scientific) of humidified 5% CO 2 . The flow was then directed through the microfluidic device and returns to the media reservoir via the programmable peristaltic pump (New Era Pumps, NE-9000). Teflon tubing was used for the return flow from the peristaltic pump to the media reservoir. The peristaltic pump was programmed to gradually increase flow stepwise from 1.25 to 7.5 mL min −1 over the first 6 h, increasing by 1.25 mL min −1 every hour. After the 6 h ramp up, the flow was maintained at 10 mL min −1 which equates to a time average shear stress of 4, 8, 12, and 16 dyne cm −2 within four channels respectively. Flow was applied to HBMECs for 36 h and HUVECs for 72 h. Characterization of the flow produced from the peristaltic pump confirms it was pulsatile (see Supplementary Information ). The flow rates were verified using a flow meter (Liquid Flowmeter NIST-traceable calibration, Cole Parmer) that measured the output from the microfluidic device to verify the time averaged flow rate. The flow profile was verified by measuring the velocity of fluorescent beads at different heights in the channels (see Supplementary Information for details). For static experiments, cells were seeded into a device and allowed to grow to confluence for 24 h. To avoid depletion of nutrients, the media was briefly circulated approximately every 8 h.
Show full methods section
Microfluidic platform The microfluidic device ( Fig. 1a–b ) was fabricated from polydimethylsiloxane (PDMS, Sylgard) using a machined aluminum mold with four rectangular channels connected in series. Each channel was 4 mm wide and 50 mm long, with heights of 390 μm, 450 μm, 550 μm, and 770 μm, respectively. PDMS was poured to fill half of the mold and partially cured at 100°C for 15 min. Nylon spacers (5mm ID, McMaster) forming the bubble traps were placed on top of the PDMS and sealed with a second layer of PDMS cured at 100 °C for 45 min. The PDMS blocking the bubble traps was removed using a 5 mm inner diameter hole punch and the inlets and outlets were made using a 1.50 mm hole punch. The PDMS channels were then plasma bonded to a 50 mm × 75 mm glass microscope slide (Corning). 6.35 mm ID silicon tubing (McMaster) was used to connect the nylon inserts to the caps of the bubble traps, which was a male Luer to hosebarb connector with a female Luer cap (Cole Parmer). For Poiseuille flow in a rectangular channel, the wall shear stress was given by τ = 6Qμ/h 2 w where Q was volumetric flow rate, μ was dynamic viscosity, h was channel height, and w was channel width. The channel heights were chosen such that the shear stress in the four channels scales in the ratio 1:2:3:4. The flow setup was composed of a custom machined Teflon media reservoir connected to 1/8″ ID silicon tubing (McMaster) ( Fig. 1a–c ). Media from the Teflon reservoir passed through a 1.5 m coil of silicon tubing located in a gas exchange chamber (In Vivo Scientific) of humidified 5% CO 2 . The flow was then directed through the microfluidic device and returns to the media reservoir via the programmable peristaltic pump (New Era Pumps, NE-9000). Teflon tubing was used for the return flow from the peristaltic pump to the media reservoir. The peristaltic pump was programmed to gradually increase flow stepwise from 1.25 to 7.5 mL min −1 over the first 6 h, increasing by 1.25 mL min −1 every hour. After the 6 h ramp up, the flow was maintained at 10 mL min −1 which equates to a time average shear stress of 4, 8, 12, and 16 dyne cm −2 within four channels respectively. Flow was applied to HBMECs for 36 h and HUVECs for 72 h. Characterization of the flow produced from the peristaltic pump confirms it was pulsatile (see Supplementary Information ). The flow rates were verified using a flow meter (Liquid Flowmeter NIST-traceable calibration, Cole Parmer) that measured the output from the microfluidic device to verify the time averaged flow rate. The flow profile was verified by measuring the velocity of fluorescent beads at different heights in the channels (see Supplementary Information for details). For static experiments, cells were seeded into a device and allowed to grow to confluence for 24 h. To avoid depletion of nutrients, the media was briefly circulated approximately every 8 h.
Cell culture
Immortalized human brain microvascular endothelial cells (HBMECs) ( Nizet et al., 1997 ) were cultured in M199 (Sigma-Aldrich) supplemented with 10% fetal bovine serum (FBS) (Invitrogen, Carlsbad, CA) and 1% penicillin streptomycin (Invitrogen). In a comparison of four immortalized human brain microvascular endothelial cell lines, this cell line showed the highest transendothelial electrical resistance values and was determined to be the most suitable for an in vitro blood–brain barrier model ( Eigenmann et al., 2013 ). Human umbilical vein endothelial cells (HUVECs) (Promocell, Heidelberg, Germany) were grown in endothelial cell growth medium (EGM-2, Promocell) containing endothelial basal medium (EBM), 2% fetal calf serum (FCS), and 1% penicillin streptomycin, hEGF, hydrocortisone, VEGF, hbFGF, R3 IGF, AA-500, and Heparin. Both cell lines were cultured under physiological conditions on uncoated tissue culture polystyrene flasks (Sarstedt). Before introducing the cells into the microfluidic device, cells were thoroughly washed twice with PBS without Ca 2+ or Mg 2+ (Lonza) and removed from their culture surface using 0.5% EDTA/trypsin (Invitrogen) for 3 min at 37 °C. Prior to seeding cells, the interior walls of the channels were coated with 62.5 μg mL −1 fibronectin (BD Biosciences, San Jose, CA) for 1 h at room temperature. HBMECs and HUVECs were introduced at concentrations of 1,500,000 cells mL −1 and 2,000,000 cells mL −1 , respectively, and grown to confluence in their respective culture media. Each channel was seeded with 100 μL of cell suspension, resulting in 150,000 cells for HBMEC channels and 200,000 cells for HUVEC channels. Prior to applying shear stress, the media was changed to reduced growth factor media composed of EBM supplemented with 2% FCS. The microfluidic device was mounted in a live-cell chamber (In Vivo Scientific) on the microscope, maintained at 37 °C and 5% CO 2 . Static experiments were conducted using a similar procedure. Cells were seeded into a device and allowed to grow to confluence for 24 h. At confluence, the flow loop was connected and the media changed to reduced growth factor media. Approximately every 8 h the pump was temporarily activated to slowly circulate nutrients and replace the volume of media within the four channels.
Live-cell and immunofluorescence imaging
Imaging was performed using a Nikon TE-2000U inverted microscope controlled by NIS Elements software (Nikon, Japan). Phase-contrast images were captured every 20 min at three locations in each 50 mm channel: at the center and 10 mm from each end ( Fig. 1d ). Before each time lapse image the locations were defined using NIS Elements software. The first location is set such that it is 10 mm from the inlet of the channel and directly in the center of the flow, roughly 2 mm from the side walls to avoid edge effects ( Fig. 1d ). Subsequent locations are spaced 10 mm from each other, resulting in three imaging locations spaced equally over the length of the channel in the laminar flow region. Images were obtained using a 10× Nikon Plan Fluor objective. Each image was 1.5 mm × 1.2 mm and contained 1000–2000 cells. Autofocus adjustment using NIS-Elements is performed before each image capture to account for any z-drift. Monolayers of endothelial cells within the device were prepared for immunofluorescence staining immediately following the flow experiment by washing with warm PBS with Ca 2+ and Mg 2+ and fixing in 4% formaldehyde (Fisher Scientific) in PBS. Cells were subsequently washed with PBS and permeabilized with 0.1% Triton-X 100 (Sigma Aldrich). Samples were blocked using 10% goat serum in PBS, and incubated with anti-zonula occluden-1 (ZO-1) antibody (rabbit monoclonal 1:200, Invitrogen) for 1 h at room temperature, washed, and incubated with a goat anti-rabbit secondary antibody (1:200, Alexa Fluor 568, Invitrogen). Samples were subsequently stained for F-actin using AlexaFluor 488 phalloidin (Invitrogen) and for nuclei using DAPI (1:2500, Roche Applied Science). Immunofluorescence images were obtained from the same locations as phase contrast images.
Image analysis
Quantitative analysis of cell morphology was performed using ImageJ (NIH, Bethesda, MD). Images of the cell monolayers from the time-lapse movies were imported into ImageJ and the cell borders were obtained automatically using a custom macro (see Supplementary Information for code and user manual). At each time point, images from the three locations were analyzed ( Fig. 1d ). Each experiment was performed at least three times. Morphological parameters of individual cells were obtained as long as more than 85% of the monolayer could be traced by this method. To validate cell morphology obtained by automated analysis of phase contrast images, the same morphological parameters were obtained by manual analysis of the cell boundaries in immunofluorescence images. Excellent agreement was obtained between the two methods (see Supplementary Information ). Cell motility was evaluated using the MATLAB-based particle image velocimetry application, OpenPIV ( Taylor et al., 2010 ). The software divides each image into a matrix of smaller regions, called interrogation windows, for analysis. Each interrogation window is compared to itself between successive images to analyze the movement of “particles”. In our case, the moving particles are the intracellular features (e.g. vacuoles and organelles) that exhibit contrast in the image and are used to collectively estimate the speed of cells within the endothelial monolayer. The same 1.5 mm × 1.2 mm images obtained at 20 min intervals were used for analysis. The interrogation window was set to 32 pixel × 32 pixel (20.5 μm × 20.5 μm), which was approximately one-fourth the area of a typical endothelial cell. The PIV tool measures velocity from the offset of intracellular features between phase-contrast images at successive time points and assigns each interrogation window a vector to describe the movement of cells within the area. The magnitudes of these vectors, regardless of direction, were averaged to obtain global cell speed within the monolayer. While PIV is not a direct measurement of cell speed, the results were compared to the speed determined by manually tracking individual cells within the endothelial monolayer. The PIV speed exhibits similar magnitude and captures the same trends as manually tracked cells (see Supplementary Information ).The influence of image analysis parameters (image size, interrogation window size, sampling time, and the space between analyzed points) on PIV magnitude was summarized in Supplementary Information . The distribution of actin stress fibers was quantified using Fourier transform analysis ( Lee and Chen, 2002 ; Ye et al., 2014 ). Cell monolayers were fixed and stained as described previously ( Ye et al., 2014 ) and the actin (green) channel of immunofluorescence images was converted to grayscale. The images were cropped to be 884 μm × 884 μm and FFTs were performed using the FFT2 routine in MATLAB. For directional textures the Fourier spectrum of the image will concentrate in certain directions, as opposed to random orientation with non-directional textures. Two eigenvalues are calculated from the Fourier spectrum and based on the ratio of these eigenvalues the directionality can be determined. For directional textures the larger eigenvalue will be much greater than the smaller eigenvalue, thus the ratio will be large ( van der Meer et al., 2010 ). The resulting intensity distributions in the frequency domain were converted to radial intensity distributions from 0 to 180° at 10° increments (see Supplementary Information ). We defined the intensity in the range 0 ± 10° as the fraction of fibers parallel to the flow direction, and the intensity in the range 90 ± 10° as the fraction of fibers perpendicular to the flow direction.
Western blot
Lysates of HBMECs and HUVECs cultured in the microfluidic device were isolated by removing the PDMS directly above each channel. The exposed channels were rinsed 3 times with ice-cold PBS (Corning) and lysed with radioimmunoprecipitation assay (RIPA, 150 mM NaCl, 1.0% IGEPAL® CA-630, 0.5% sodium deoxycholate, 0.1% SDS, and 50 mM Tris, pH 8.0) buffer supplemented with a protease inhibitor cocktail (Sigma Aldrich) containing 2 mM 4-(2-aminoethyl)benzenesulfonyl fluoride (AEBSF), 0.3 μM aprotinin, 130 μM bestatin, 1 mM ethylenediaminetetraacetic acid (EDTA), 14 μM E-64, and 1 μM leupeptin. Lysed cells were scraped from the surface of the channel and centrifuged at 25,000 rpm for 25 min at 4 °C. A solution containing 40 μL of cell lysate, 8 μL NuPage (LifeTech) 10× sample reducing buffer, and 16 μL NuPage (Life Technologies, Frederick, MD) 4× LDS sample buffer was incubated for 15 min in a 90 °C water bath. Protein samples were separated on a 4–15% Bio-Rad Mini-Protean TGX gel in a Bio-Rad Mini-Protean Tetra System gel electrophoresis chamber and transferred to a nitrocellulose membrane using the Bio-Rad Transblot Turbo system. The membranes were blocked at room temperature for 1 h in tris-buffered saline containing 0.5% Tween 20 (TBST) and 5% non-fat dry milk. The membranes were then incubated in the blocking solution with primary antibodies overnight at 4 °C. Immunoblotting was performed using 1:500 polyclonal rabbit anti-ZO-1 (Invitrogen), 1:1000 monoclonal mouse anti-beta-catenin (BD Biosciences), and 1:1000 polyclonal rabbit anti-beta-actin (Cell Signaling Technology) as a loading control. The membranes were washed three times with TBST and incubated with 1:3000 anti-mouse and anti-rabbit horseradish peroxidase secondary antibody for 1 h at room temperature. The membranes were washed three times with TBST and incubated for 3 min in SuperSignal West Pico Chemiluminescent Substrate. The membranes were then imaged using the Bio-Rad Chemidoc molecular imaging station.
Supplementary Material 1 2 3
📊 Figures
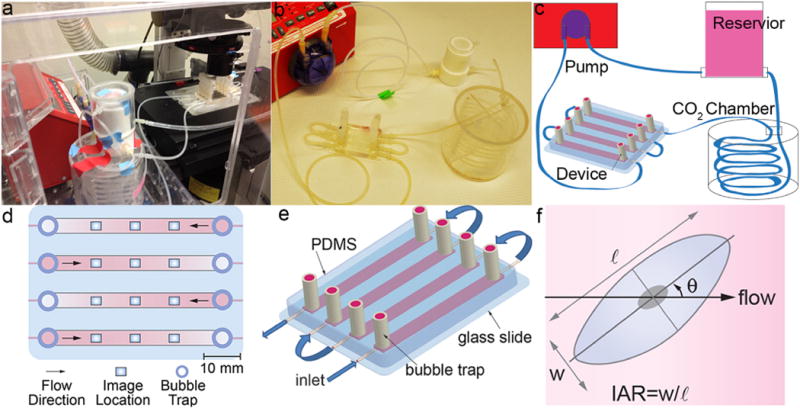
Fig. 1
(a) Flow system assembled on the microscope stage in the live cell chamber. (b) Flow system assembled on a lab bench. (c) Schematic illustration of the flow system. (d) Schematic illustration of the d...
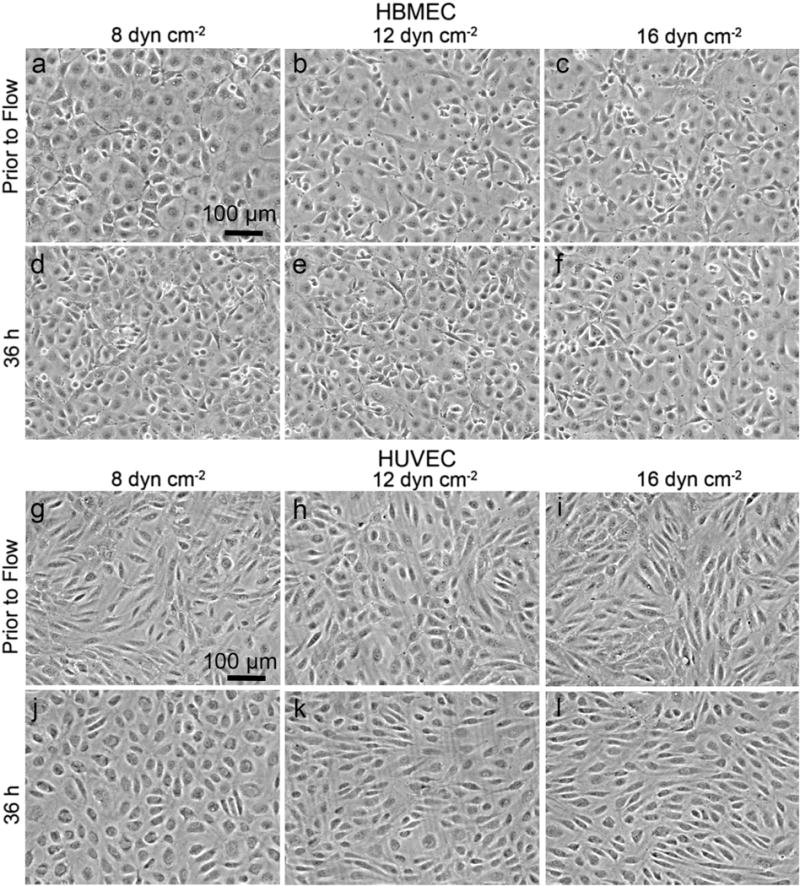
Fig. 2
Influence of shear stress on confluent monolayers of HBMECs and HUVECs. Phase contrast images of HBMECs and HUVECs: (au2013f) HBMECs before and after 36 h of flow at 8, 12, and 16 dyne cm u22122 , and...
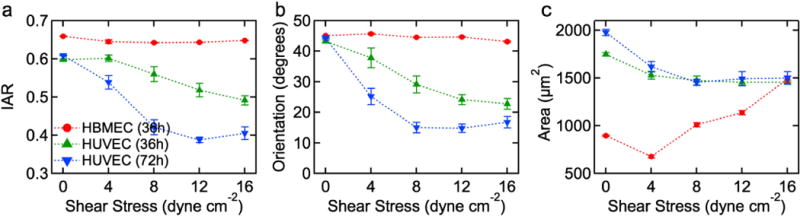
Fig. 3
HBMECs do not show the characteristic elongation and alignment in response to shear stress. Summary of the morphology of HBMECs and HUVECs in confluent monolayers after exposure to a sustained shear s...
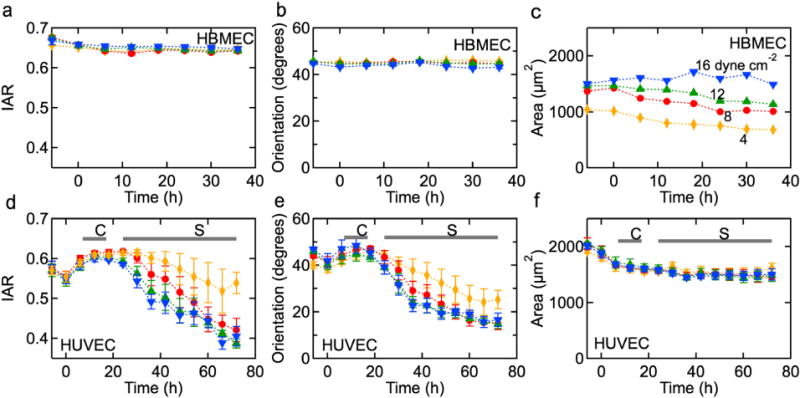
Fig. 4
Representative time dependence of morphology parameters under 4, 8, 12, and 16 dyne cm u22122 shear stress. HBMECs: (a) inverse aspect ratio (IAR), (b) average angular orientation (u03b8), and (c) ave...
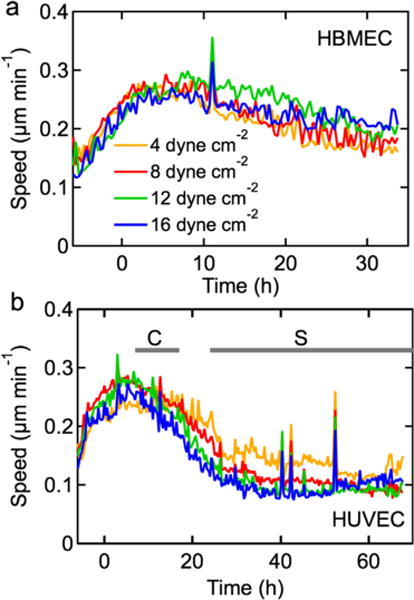
Fig. 5
Average speed in confluent monolayers exposed to a shear stress of 4, 8, 12, and 16 dyne cm u22122 . (a) HBMECs, and (b) HUVECs. Data were obtained from analysis of images from time-lapse videos at 20...
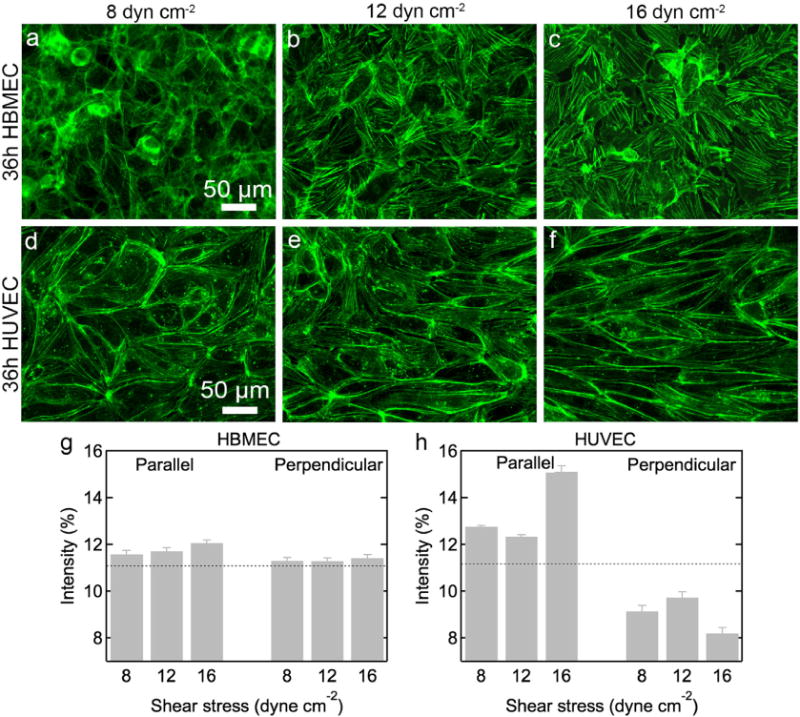
Fig. 6
Actin filaments in HBMECs are not aligned in the direction of flow under shear stress. Immunofluorescence images and quantitative analysis of actin filament orientation in HBMECs and HUVECs after 36 h...
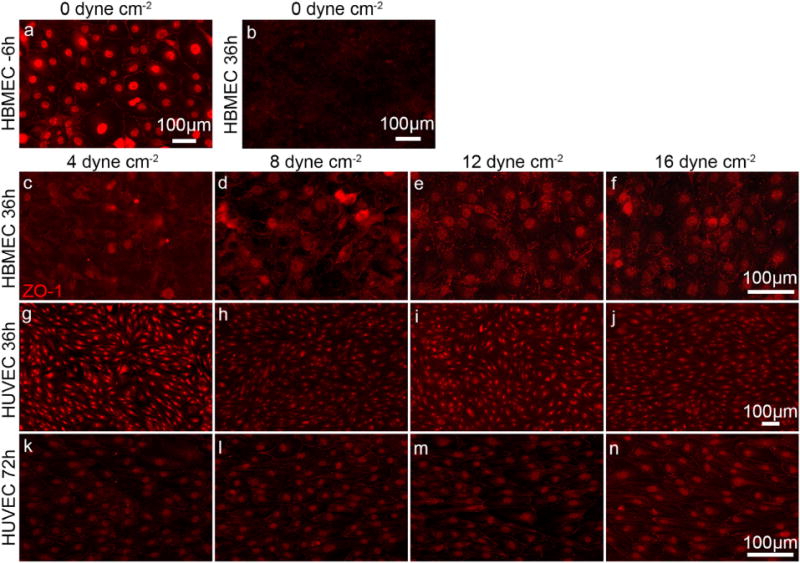
Fig. 7
Immunofluorescence images showing ZO-1 expression in HBMECs and HUVEC monolayers. HBMECs: (a) on reaching confluence and (b) after 36 h under static conditions. HBMECs after 36 h at (c) 4, (d) 8, (e) ...
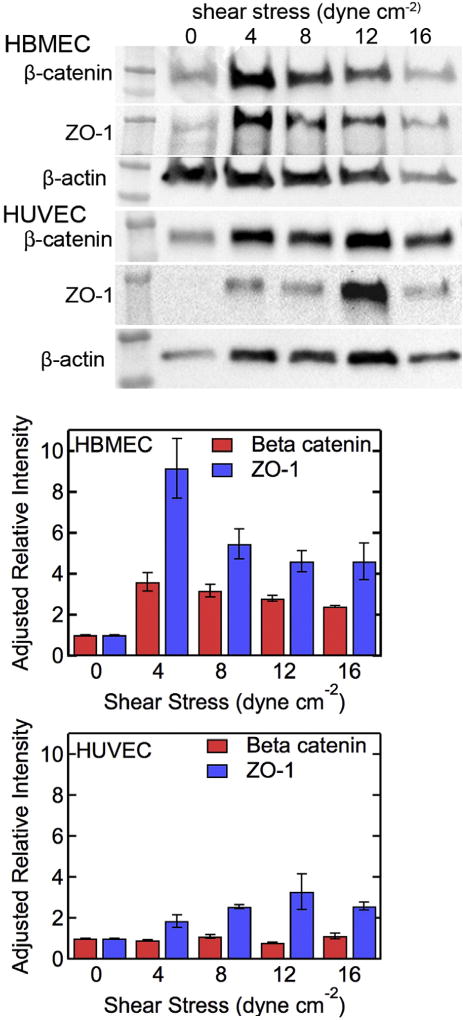
Fig. 8
Expression of beta-catenin and ZO-1 in HBMEC and HUVEC monolayers. Western blot for (a) beta-catenin, (b) ZO-1, and (c) beta-actin loading control in HBMECs after 36 h under static conditions and unde...
Figure images are served from the NIH/NLM PubMed Central Open Access Subset or Europe PMC; copyright remains with the publishers and authors.
💬 Discussion
0 commentsNo comments yet. Be the first to start a discussion!
Leave a Comment