Abstract
The universally conserved enzyme CTP synthase (CTPS) forms filaments in bacteria and eukaryotes. In bacteria, polymerization inhibits CTPS activity and is required for nucleotide homeostasis. Here we show that for human CTPS, polymerization increases catalytic activity. The cryo-EM structures of bacterial and human CTPS filaments differ considerably in overall architecture and in the conformation of the CTPS protomer, explaining the divergent consequences of polymerization on activity. The structure of human CTPS filament, the first structure of the full-length human enzyme, reveals a novel active conformation. The filament structures elucidate allosteric mechanisms of assembly and regulation that rely on a conserved conformational equilibrium. The findings may provide a mechanism for increasing human CTPS activity in response to metabolic state and challenge the assumption that metabolic filaments are generally storage forms of inactive enzymes. Allosteric regulation of CTPS polymerization by ligands likely represents a fundamental mechanism underlying assembly of other metabolic filaments.
🔬 Techniques
🔭 Microscopes
🧬 Organisms
💻 Software
✨ Fluorophores
🧪 Sample Preparation
🏭 Microscope Brands
🧪 Reagent Suppliers
📷 Detectors
💻 Software Details
💾 Data Repositories
🏛️ Research Organizations (ROR)
Affiliated research institutions:
📋 Methods
Purification of ecCTPS
Wild-type ecCTPS was purified as described previously. 3 , 14 The ecCTPS CC mutant was purified in the same manner, except 10 mM DTT was included throughout the purification. Purification of hCTPS1 hCTPS1 was expressed in S. cerevisiae strain GHY55, as described by Han et al. 2005. 32 This strain lacks the endogenous S. cerevisiae CTPS genes URA7 and URA8, and contains plasmid pDO105-hCTPS1, which directs expression of 6His-tagged (C-terminal) hCTPS1 from the ADH1 promoter. GHY55 cells were grown in 4× YPD media and harvested by freezing cell pellets in liquid nitrogen. Cell pellets were ground to a powder while frozen, and 15g of cell powder was resuspended in 100 mL of lysis buffer (50 mM Tris-HCl, 200 mM NaCl, 0.3M sucrose, 20 mM imidazole, 0.5 mM PMSF, pH 8.0). Lysates were clarified by centrifugation at 14,000 RPM for 40 minutes at 4°C in a Thermo Scientific Fiberlite F14-14×50cy rotor. Clarified lysates were applied to a 5mL HisTrap FF Crude column (GE) on an ÄKTA Start chromatography system (GE), and the column was washed with 30 column volumes (CV) wash buffer (20 mM Tris-HCl, 0.5M NaCl, 45 mM imidazole, 10% glycerol, pH 7.9). Protein was eluted as 1mL fractions with 5CV elution buffer (20 mM Tris-HCl, 0.5M NaCl, 250 mM imidazole, 10% glycerol, pH 7.9). Fractions containing hCTPS1 were pooled and dialyzed into storage buffer (20 mM Tris-HCl, 0.5M NaCl, 10% glycerol, 7 mM β-mercaptoethanol, pH 7.9) using Snakeskin 3500 MWCO dialysis tubing (Thermo Scientific). Dialyzed protein was concentrated ∼6-fold by centrifugation in a 3 kDa cut-off centrifugal filter unit (Millipore). hCTPS1 prepared for cryoEM was purified in the same manner, except protein was concentrated prior to dialysis, and then dialyzed into 20 mM Tris-HCl, 50 mM NaCl, 7 mM β-mercaptoethanol, pH 7.9. The hCTPS1-H355A mutant was generated by site-directed mutagenesis of plasmid pDO105-hCTPS1, and purified in the same manner as wild-type hCTPS1.
Show full methods section
Purification of ecCTPS
Wild-type ecCTPS was purified as described previously. 3 , 14 The ecCTPS CC mutant was purified in the same manner, except 10 mM DTT was included throughout the purification. Purification of hCTPS1 hCTPS1 was expressed in S. cerevisiae strain GHY55, as described by Han et al. 2005. 32 This strain lacks the endogenous S. cerevisiae CTPS genes URA7 and URA8, and contains plasmid pDO105-hCTPS1, which directs expression of 6His-tagged (C-terminal) hCTPS1 from the ADH1 promoter. GHY55 cells were grown in 4× YPD media and harvested by freezing cell pellets in liquid nitrogen. Cell pellets were ground to a powder while frozen, and 15g of cell powder was resuspended in 100 mL of lysis buffer (50 mM Tris-HCl, 200 mM NaCl, 0.3M sucrose, 20 mM imidazole, 0.5 mM PMSF, pH 8.0). Lysates were clarified by centrifugation at 14,000 RPM for 40 minutes at 4°C in a Thermo Scientific Fiberlite F14-14×50cy rotor. Clarified lysates were applied to a 5mL HisTrap FF Crude column (GE) on an ÄKTA Start chromatography system (GE), and the column was washed with 30 column volumes (CV) wash buffer (20 mM Tris-HCl, 0.5M NaCl, 45 mM imidazole, 10% glycerol, pH 7.9). Protein was eluted as 1mL fractions with 5CV elution buffer (20 mM Tris-HCl, 0.5M NaCl, 250 mM imidazole, 10% glycerol, pH 7.9). Fractions containing hCTPS1 were pooled and dialyzed into storage buffer (20 mM Tris-HCl, 0.5M NaCl, 10% glycerol, 7 mM β-mercaptoethanol, pH 7.9) using Snakeskin 3500 MWCO dialysis tubing (Thermo Scientific). Dialyzed protein was concentrated ∼6-fold by centrifugation in a 3 kDa cut-off centrifugal filter unit (Millipore). hCTPS1 prepared for cryoEM was purified in the same manner, except protein was concentrated prior to dialysis, and then dialyzed into 20 mM Tris-HCl, 50 mM NaCl, 7 mM β-mercaptoethanol, pH 7.9. The hCTPS1-H355A mutant was generated by site-directed mutagenesis of plasmid pDO105-hCTPS1, and purified in the same manner as wild-type hCTPS1.
Site-directed mutagenesis
Site-directed mutagenesis of the E. coli and human CTPS expression constructs was performed using the QuickChange (Agilent Technologies) and Q5 (NEB) systems, respectively.
CTPS activity assays
CTPS activity was determined at 37°C by measuring Δotimes;Abs 291nm over time using a NanoDrop 2000c spectrophotometer (Thermo Scientific). Absolute CTP production was calculated using the change in extinction coefficient between UTP and CTP at 291 nm (1338 M -1 cm -1 ). 33 Kcat values were determined from the initial linear region of the Abs 291nm versus time measurements. For ecCTPS, assays were performed with 0.5-2.5 μM ecCTPS or ecCTPS CC in a standard reaction buffer containing 50 mM Na-HEPES (pH 8.0) and 10 mM MgCl 2 , with or without 10 mM DTT as appropriate. Final substrate concentrations were 0.6 mM UTP, 1.5 mM ATP, 0.2 mM GTP and 10 mM glutamine or ammonia. Assays were carried out using the “annealing” method described by Habrian, et al 34 : ecCTPS was incubated at 21°C for 3 minutes, and then combined with pre-warmed (37°C) nucleotides. The enzyme-nucleotide mix was then incubated for a further 4 minutes at 37°C, after which pre-warmed glutamine or ammonia was added. The complete reaction mixture was then immediately transferred to a pre-warmed UV cuvette and Δotimes;Abs 291nm over time measured at 37°C. For hCTPS1, assays were performed with 8 μM hCTPS1 in a standard reaction buffer containing 20 mM Tris-HCl (pH 7.9) and 10 mM MgCl 2 , with final substrate concentrations of 2 mM UTP, 2 mM ATP, 0.2 mM GTP, and 10 mM glutamine. The annealing method described above was also used for hCTPS1 activity assays, except the enzyme-nucleotide mix was incubated for 1 hour at 37°C to allow for hCTPS1 polymerization. Negative stain EM Samples for negative stain EM were prepared by applying CTPS to carbon-coated grids and staining with 0.7% uranyl formate. For ecCTPS CC , protein was dialyzed overnight into 50 mM Na-HEPES (pH 8.0) with or without 10 mM DTT before being coated onto grids at a final concentration of 2.5 μM. For hCTPS1 and hCTPS1-H355A, samples were prepared with 2.5 μM protein in 20 mM Tris-HCl (pH 7.9) and 10 mM MgCl 2 , supplemented with appropriate nucleotides at the following concentrations: UTP (2 mM), ATP (2 mM), AMP-PNP (2mM), GTP (0.2 mM), ADP (2 mM), and CTP (2 mM). hCTPS1 was incubated with nucleotides for 1 hour at 37°C before being coated onto grids. For depolymerization experiments, glutamine (10 mM) was added following incubation with nucleotides, and negative stain samples were prepared 30 and 120 minutes following glutamine addition. Electron microscopy was performed on a Tecnai G2 Spirit (FEI co.) operating at 120 kV, and images were acquired at 52,000× magnification on a US4000 4k × 4k CCD camera (Gatan, Inc.). CryoEM Samples for cryoEM were prepared by applying protein to glow-discharged C-Flat holey-carbon grids (Protochips Inc.), blotting with a Vitrobot (FEI co.), and rapidly plunging into liquid ethane. For ecCTPS CC , protein was dialyzed into non-reducing buffer (50 mM Na-HEPES pH 8.0) to promote filament assembly. Samples for cryoEM were then prepared with 2.5 μM ecCTPS CC in the absence of nucleotides or following 1 hour incubation of filaments with 10 mM MgCl 2 in addition to UTP (0.6 mM) and ATP (1.5 mM) or CTP (0.6 mM) and ADP (1.5 mM). hCTPS1 (5 μM) was incubated for 1 hour with 10 mM MgCl 2 , 2 mM UTP, 2 mM ATP, and 0.2 mM GTP before preparing cryoEM samples. For ecCTPS tetramers, 5 μM ecCTPS was incubated with 10 mM MgCl 2 , 0.6 mM UTP, 1.5 mM AMP-PNP, 0.2 mM GTP and 10 mM glutamine before preparing cryoEM samples. CryoEM data for the wildtype ecCTPS filament were acquired in a Tecnai Polara operating at 300 kV and recorded on a K2 Summit Direct Detect camera with a total dose of ∼34 e - /Å 2 with 36 frames per exposure. For all other samples, cryoEM data was collected on a Tecnai G2 F20 (FEI co.) operating at 200 kV with a K2 Summit Direct Detect camera (Gatan Inc.) with a pixel size of 1.26 Å/pixel. Movies were acquired in counting mode with 36 frames and a total dose of ∼45 e - /Å 2 (filaments) or ∼68 e - /Å 2 (ecCTPS tetramers), and with a defocus range between 0.8 and 2.5 μm (filaments) or 1.0 and 4.5 μm (ecCTPS tetramers). Leginon software 35 was used to automate data collection.
Image processing and 3D reconstruction
Movie frames were aligned using DOSEFGPU DRIFTCORR 36 and CTF parameters were estimated using CTFFIND3 37 . For helical samples, lengths of helices were manually defined using Appion 38 manual picker, and overlapping segments were extracted along the length of each helix. Particle stacks were CTF corrected by phase flipping in SPIDER 39 , using parameters determined by CTFFIND3. 3D reconstruction of helices was performed by iterative helical real space reconstruction (IHRSR) 40 , 41 in SPIDER, using hsearch_lorentz 42 to refine helical symmetry parameters. Cylinders were used as starting models, and the D2 point group symmetry of the CTPS tetramer was enforced. Iterative gold-standard refinement was performed with increasingly smaller angular increments (minimum 1.5°). For single particle (tetramer) samples, particles were picked automatically using DoG Picker 43 and then extracted using Appion. Relion 44 was used for CTF correction (using CTFFIND3 parameters) and subsequent classification and refinement. We performed reference-free 2D classification, and selected 7700 and 39000 particles for 3D classification of the hCTPS1-H355A and ecCTPS tetramers, respectively. For 3D classification, initial reference volumes were generated from the homology model of the hCTPS1 tetramer or crystal structure of the product-bound ecCTPS tetramer. Both reference volumes were low-pass filtered to 60Å, and D2 symmetry was enforced during 3D classification. Following 3D classification, 4400 and 6400 particles were selected for hCTPS1-H355A and ecCTPS, respectively, for gold-standard 3D refinement. Again, reference volumes were low-pass filtered to 60Å and D2 symmetry was enforced during 3D refinement. The gold-standard FSC=0.143 criterion was used for estimating resolution. Raw volumes were amplitude corrected and low and high-pass filtered using SPIDER. Details of each 3D reconstruction are summarized in Table 1 .
Building and fitting of atomic models
An ecCTPS monomer (PDB 2AD5) was initially fit as a single rigid body into the cryo-EM structure of the filament. For the human filament an initial homology model of the full-length hCTPS monomer was generated from the crystal structures of the individual domains (PDB 2VO1 and 2VKT) aligned to ecCTPS (PDB 2AD5) using MODELLER 45 , then fit to cryoEM density as three rigid bodies: GAT domain, linker domain, and ALase domain. For both structures atomic models were refined with the Rosetta Relax application 46 , using the cryoEM density as a constraint. Adjacent protomers within the tetramer and at filament contacts sites were included during the Relax procedure, to allow for refinement at subunit interfaces. X-ray structure of an alternate CTP-inhibited ecCTPS conformation N-terminal His-tagged ecCTPS mutant C268A was expressed and purified using metal chelate chromatography as previously described. 16 ecCTPS(C268A) had identical k cat and CTP inhibition as wildtype. Protein for crystallization was stored in 10 mM Tris-Cl, 0.5 mM TCEP, pH 8.0 at -80°C at 10-15 mg/mL. P2 1 2 1 2 crystals isomorphous to the published apo- and CTP/ADP-liganded structures (1S1M and 2AD5) were grown using vapor diffusion from 7.5 mg/mol Ec CTPS-C268A, 0.8-1.2 M ammonium sulfate, 0.1 M Tris-Cl, pH 8.0 as previously described 14 with drops supplemented with 5 mM CTP, 5 mM magnesium sulfate and 10 mM glutamine. For cryoprotection, crystals were briefly rinsed in 1:1 mixture of 50% MPD:mother liquor (25% MPD final), wicked and flash-cooled in liquid nitrogen. Reflection data were acquired at Stanford Synchrotron Radiation Lightsource Beamline 1-5 at 100°K at a wavelength of 0.979610 Å and 1° oscillation/image, using a ADSC Quantum 315 detector. Eighty eight frames were processed using DENZO/Scalepack (HKL2000 package). Phases were derived from the water-free published CTP and ADP complex structure (PDB 2AD5). Maximum-likelihood structure factor refinement was carried out on non-hydrogen atoms using Refmac 5.6 with Babinet scaling with an anisotropic B-factor correction (BSOL fixed at 125.00 and final anisotropic scaling parameters B11 = -1.82 B22 = 2.83 B33 = -1.01 B12 = 0.00 B13 = 0.00 B23 = 0.00). Quaternary changes were accounted for by initial rigid body refinement for individual monomers and then for three separate domains of each monomer (1-266, 267-287, 288-544). Cycles of manual model building with Coot 0.6.2 and combined positional and B-factor refinement led to the final model. The distribution of favored, allowed and outlier Ramachandran angles were 94%, 5% and 1%, respectively (51 st percentile for structures at this resolution). The data collection and final model statistics are given in Table 2 .
Sequence comparison
CTPS sequences were obtained from BLAST searches 47 , and multiple sequence alignments of several hundred sequences was performed with MAFFT 48 .
Data availability
Coordinates and structure factors for the CTP-inhibited ecCTPS crystal structure have been deposited in the Protein Data Bank under accession code PDB 5TKV. EM structures and associated atomic models have been deposited in the Electron Microscopy Data Bank and Protein Data Bank with the following accession codes: ecCTPS filament (EMD-8504; PDB 5U3C), hCTPS1 filament (EMD-8474; PDB 5U03), hCTPS1-H355A tetramer (EMD-8476), ecCTPS tetramer (EMD-8475; PDB 5U05), ecCTPS-CC (apo) (EMD-8490), ecCTPS-CC (substrates) (EMD-8491), ecCTPS-CC (products) (EMD-8513; PDB 5U6R). Other data supporting this study are available from the corresponding authors upon reasonable request.
Supplementary Material 1
📊 Figures
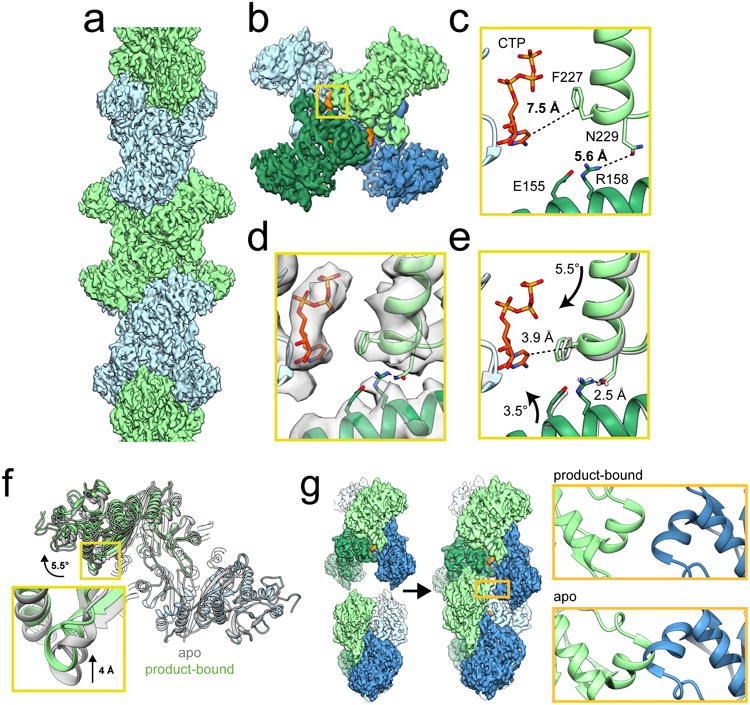
Figure 1
Mechanism of ecCTPS assembly
a, CryoEM reconstruction of ecCTPS filament at 4.6 u00c5 resolution. b, A single ecCTPS tetramer from the filament, colored by protomer (blue and green) and nucleotide density highlighted in orange. c...
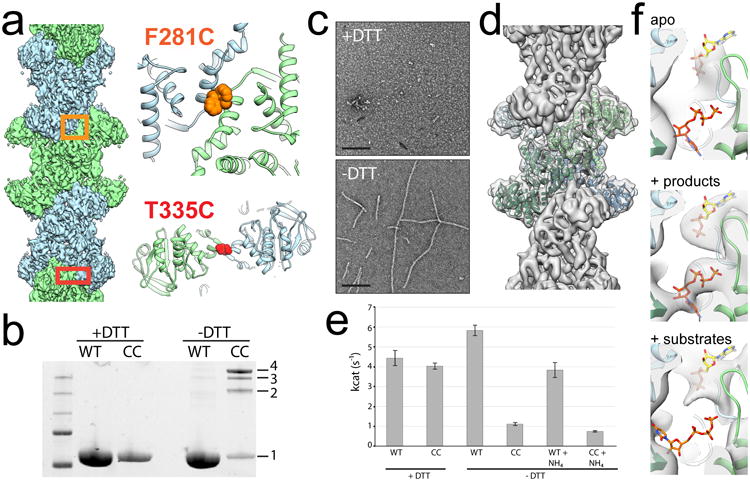
Figure 2
Engineered disulfides drive ecCTPS assembly and inhibit activity
a, Design of the ecCTPS CC construct, showing the locations of cysteine mutations at F281 and T335 in the linker-linker and GAT-GAT interfaces, respectively. b, SDS-PAGE gel of ecCTPS WT and CC constr...
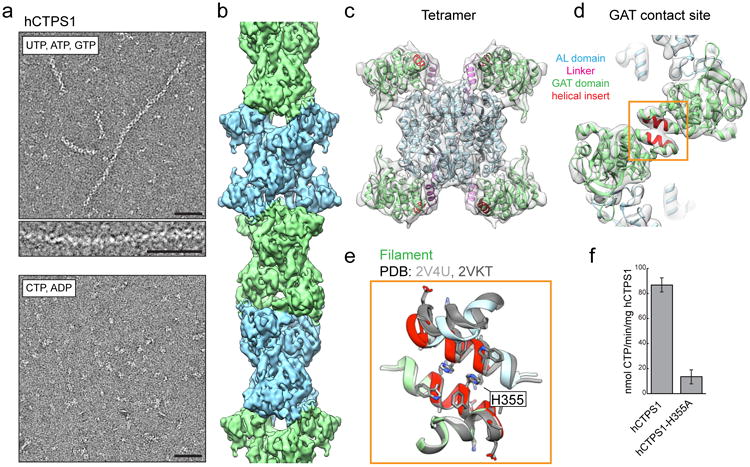
Figure 3
hCTPS1 filaments assemble with substrates and are catalytically active
a, hCTPS1 polymerizes in the presence of substrates, but not in the presence of products. b , 6.1u00c5 cryoEM map of the hCTPS1 filament, colored by tetramer subunit. c , Model of the hCTPS1 tetramer ...
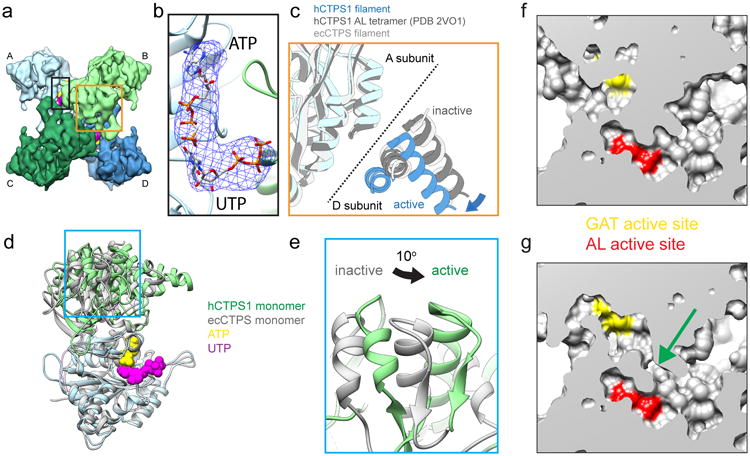
Figure 4
hCTPS1 filaments reveal the active conformation of CTP synthase
a , CryoEM structure of the hCTPS1 tetramer in the active, filament conformation. Protomers A-D are shown in different colors. b , Zoomed-in view of the black box in panel a, showing the active site w...
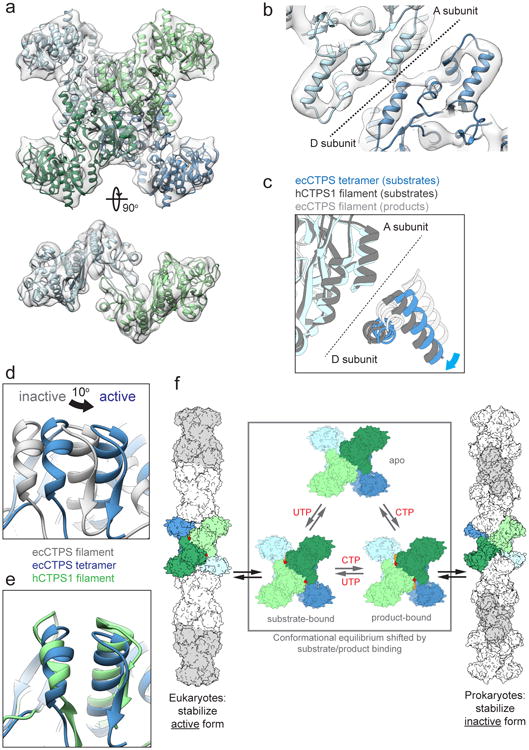
Figure 5
ecCTPS and hCTPS1 undergo a conserved conformational cycle controlled by substrate and product binding
a , 8u00c5 cryoEM map of substrate-bound ecCTPS (grey), fit with an atomic model (colored by protomer). b, The tetramer interface in the ecCTPS cryoEM map (grey) fit with an atomic model (color). Indi...
Figure images are served from the NIH/NLM PubMed Central Open Access Subset or Europe PMC; copyright remains with the publishers and authors.
💬 Discussion
0 commentsNo comments yet. Be the first to start a discussion!
Leave a Comment