Abstract
AbstractHuman histone deacetylase 6 (HDAC6) is the major deacetylase responsible for removing the acetyl group from Lys40 of α-tubulin (αK40), which is located lumenally in polymerized microtubules. Here, we provide a detailed kinetic analysis of tubulin deacetylation and HDAC6/microtubule interactions using individual purified components. Our data unequivocally show that free tubulin dimers represent the preferred HDAC6 substrate, with a K M value of 0.23 µM and a deacetylation rate over 1,500-fold higher than that of assembled microtubules. We attribute the lower deacetylation rate of microtubules to both longitudinal and lateral lattice interactions within tubulin polymers. Using TIRF microscopy, we directly visualized stochastic binding of HDAC6 to assembled microtubules without any detectable preferential binding to microtubule tips. Likewise, indirect immunofluorescence microscopy revealed that microtubule deacetylation by HDAC6 is carried out stochastically along the whole microtubule length, rather than from the open extremities. Our data thus complement prior studies on tubulin acetylation and further strengthen the rationale for the correlation between tubulin acetylation and microtubule age.
🔬 Techniques
🧬 Organisms
💻 Software
✨ Fluorophores
🧪 Sample Preparation
🔬 Cell Lines
🏭 Microscope Brands
🧪 Reagent Suppliers
📷 Detectors
🎨 Filters
💻 Software Details
🏛️ Research Organizations (ROR)
Affiliated research institutions:
📋 Methods
Chemicals and peptides
If not stated otherwise, all chemicals were purchased from Sigma-Aldrich (St. Louis, MO, USA). Peptides were synthesized commercially by KareBay (Monmouth Junction, NJ, USA) at >90% purity and their identities were confirmed by analytical LC-MS (data not shown).
Expression plasmids
The sequence encoding human HDAC6 ( NP_006035.2 , UniProtKB - Q9UBN7 ) was used as a template for cloning all HDAC6 variants used in this report. In general, a nucleotide sequence encoding a given variant was PCR amplified with a set of desired primer pairs and inserted into the pDONR221 plasmid using the BP recombination reaction (Invitrogen, Carlsbad, CA, USA), according to the manufacturer’s protocol. The identity of the resulting entry clone was confirmed by Sanger sequencing. Expression plasmids were generated via LR recombination reaction between the entry clone and a required destination vector, which typically introduced a TEV-cleavable tag at the N-terminus of the HDAC6 variant to simplify purification and/or visualization of the resulting fusion. Schematic representations of constructs used in this study are shown in Supplementary Fig. S1 . Large-scale expression of HDAC6 variants All HDAC6 variants were expressed using HEK-293/T17 cells following transient transfection mediated by linear polyethylene imine (PEI) (Polysciences Inc., Warrington, PA, USA). To this end, the suspension culture of HEK-293/T17 cells was grown in 2 L Erlenmeyer flasks in Free Style F17 medium (Thermo Fisher Scientific) supplemented by 0.1% Pluronic F-68 (Invitrogen) and 2 mM L-glutamine at 110 rpm under a humidified 5% CO 2 atmosphere at 37 °C. For large-scale expression, 0.7 mg of an expression plasmid was diluted in 17.5 ml of PBS, to which 2.1 ml of 1 mg/ml PEI was added. The mixture was vortexed briefly, incubated for 10 min at room temperature, and then added to 350 ml of cells at a concentration of 4 × 10 6 cell/ml. Four hours post-transfection, the cell suspension was diluted by an equal volume of ExCell serum-free medium. Cells were harvested 72 h post transfection by centrifugation at 500 × g for 5 min, then the cell pellet was frozen in liquid nitrogen and stored at −80 °C until further use.
Show full methods section
Chemicals and peptides
If not stated otherwise, all chemicals were purchased from Sigma-Aldrich (St. Louis, MO, USA). Peptides were synthesized commercially by KareBay (Monmouth Junction, NJ, USA) at >90% purity and their identities were confirmed by analytical LC-MS (data not shown).
Expression plasmids
The sequence encoding human HDAC6 ( NP_006035.2 , UniProtKB - Q9UBN7 ) was used as a template for cloning all HDAC6 variants used in this report. In general, a nucleotide sequence encoding a given variant was PCR amplified with a set of desired primer pairs and inserted into the pDONR221 plasmid using the BP recombination reaction (Invitrogen, Carlsbad, CA, USA), according to the manufacturer’s protocol. The identity of the resulting entry clone was confirmed by Sanger sequencing. Expression plasmids were generated via LR recombination reaction between the entry clone and a required destination vector, which typically introduced a TEV-cleavable tag at the N-terminus of the HDAC6 variant to simplify purification and/or visualization of the resulting fusion. Schematic representations of constructs used in this study are shown in Supplementary Fig. S1 . Large-scale expression of HDAC6 variants All HDAC6 variants were expressed using HEK-293/T17 cells following transient transfection mediated by linear polyethylene imine (PEI) (Polysciences Inc., Warrington, PA, USA). To this end, the suspension culture of HEK-293/T17 cells was grown in 2 L Erlenmeyer flasks in Free Style F17 medium (Thermo Fisher Scientific) supplemented by 0.1% Pluronic F-68 (Invitrogen) and 2 mM L-glutamine at 110 rpm under a humidified 5% CO 2 atmosphere at 37 °C. For large-scale expression, 0.7 mg of an expression plasmid was diluted in 17.5 ml of PBS, to which 2.1 ml of 1 mg/ml PEI was added. The mixture was vortexed briefly, incubated for 10 min at room temperature, and then added to 350 ml of cells at a concentration of 4 × 10 6 cell/ml. Four hours post-transfection, the cell suspension was diluted by an equal volume of ExCell serum-free medium. Cells were harvested 72 h post transfection by centrifugation at 500 × g for 5 min, then the cell pellet was frozen in liquid nitrogen and stored at −80 °C until further use.
Purification of HDAC6 variants
The cell pellet was lysed by sonication (24 W/1 min) in ice-cold lysis buffer (100 mM Tris-HCl, 10 mM NaCl, 5 mM KCl, 2 mM MgCl 2 , 10% glycerol; pH 8.0) supplemented with benzonase (1 U/ml; Merck, Darmstadt, Germany) and protease inhibitor coctail (Roche, Basel, Switzerland). To further assist cell lysis, Igepal-630 was added to the cell lysate to a final concentration of 0.2% (v/v) and the mixture was incubated for 20 min on ice. NaCl was added to a final concentration of 150 mM. The lysate was then cleared by centrifugation at 40,000 × g for 30 min at 4 °C and the supernatant was loaded onto a Strep-Tactin column (IBA, Gottingen, Germany) equilibrated in the lysis buffer. Following the washing step with the lysis buffer, the fusion protein was eluted using 50 mM Tris-HCl, 150 mM NaCl, 10 mM KCl, 10% glycerol and 3 mM desthiobiotin (pH 8.0). The eluted fusion protein was concentrated to approximately 1 mg/ml and (if desired) the N-terminal tag was cleaved by the addition of the 1:20 (w/w) TEV protease overnight at 4 °C. The HDAC6 protein was then separated from tags and the TEV protease by size exclusion chromatography using the Superdex 16/600 HR200 column (GE Healthcare Bio-Sciences, Little Chalfont, UK) with 30 mM HEPES, 140 mM NaCl, 10 mM KCl, 3% glycerol, and 0.25 mM TCEP (AMRESCO, Solon, OH, USA), with a pH 7.4 adjusted with NaOH, as a mobile phase. The purified protein was concentrated to approximately 1 mg/ml and aliquots were flash frozen in liquid nitrogen and stored at −80 °C until further use.
Fluorometric assays
Deacetylation activity of HDAC6 variants was determined using acetyl-Gly-Ala-(acetyl-Lys)-AMC (GAK(Ac) -AMC; Bachem, Bubendorf, Switzerland), Boc-(acetyl-Lys)-AMC (Boc-K(Ac)-AMC; Bachem) and Fluor-de-Lys (Enzo Life Sciences, Plymouth Meeting, PA, USA) substrates. In general, a given HDAC6 variant was incubated with a substrate in a reaction buffer comprised of 50 mM HEPES, 140 mM NaCl, 10 mM KCl, 1 mg/ml bovine serum albumin (BSA), and 1 mM TCEP, at a pH 7.4 adjusted with NaOH (total volume 20 µl). This incubation occurred in 384-well plates for 30 min with vigorous shaking at 37 °C. The reaction was stopped by addition of 20 µl of trypsin solution (2 mg/ml trypsin, 20 mM Tris-HCl, 150 mM NaCl, 1 mM EDTA; pH 7.4 adjusted with NaOH). Following the 15-min incubation at 37 °C, a fluorescence signal of released aminomethylcoumarin was quantified using a CLARIOstar fluorimeter (BMG Labtech GmbH, Ortenberg, Germany) with excitation/emission wavelengths set at 365/440 nm, respectively. The data were fitted using the GraphPad Prism software (GraphPad Software, San Diego, CA, USA) and kinetic values were calculated by non-linear regression analysis.
HPLC-based assays
Individual fluorophore-labeled peptides were incubated with HDAC6 at 37 °C for 30 min in an assay buffer comprised of 50 mM HEPES, 140 mM NaCl, 10 mM KCl, 2 mg/ml BSA, and 1 mM TCEP, at a pH 7.4 adjusted with NaOH. The reaction was quenched by the addition of acetic acid to a final concentration of 0.5%, and reaction products were quantified by means of RP-HPLC (Shimadzu, HPLC Prominence system) on the column Kinetex® 2.6 µm XB-C18 100 Å, 100 × 3 mm (Phenomenex, Torrance, CA, USA).
Determination of inhibition constant
The inhibition constants for SAHA (Selleckchem, Houston, TX, USA), Trichostatin A, and Nexturastat A (gift from A. Villagra and A. Kozikowski from George Washington University, USA, and University of Illinois at Chicago, USA, respectively) were determined using the slightly modified fluorogenic assay described above. Briefly, the tested compounds were preincubated with 0.3 nM human recombinant HDAC6 at 37 °C for 15 min, and then the deacetylation reaction was started by addition of 10 µM GAK(Ac)-AMC. After a 120-min incubation at 37 °C, the reaction was stopped by the addition of trypsin solution. Following the 15-min incubation at 37 °C, a fluorescence signal of released aminomethylcoumarin was quantified using a CLARIOstar fluorimeter with excitation/emission wavelengths set at 365/440 nm, respectively. The data were fitted using the GraphPad Prism software and IC 50 values were calculated by non-linear regression analysis. The inhibitor and enzyme-free controls were defined as 100% and 0% HDAC6 activity, respectively.
Isolation of tubulin from porcine brains
Tubulin isolation from pig brain tissue was carried out according to an established protocol (details in the supplementary material) 65 . The concentration of the final tubulin preparation was determined based on the absorbance at 280 nm. Supernatant containing purified tubulin was flash frozen in aliquots using liquid nitrogen and stored at −80 °C.
Determination of αK40 acetylation levels
Five µg of porcine tubulin were diluted in 100 µl of 50 mM ammonium bicarbonate (pH 8.5) and then digested with GluC (V8) protease (Roche) for 10 hours at a ratio of 1:100. After complete evaporation on speedvac, the sample was dissolved in 15 µl of 0.1% formic acid, 10% dimethylsulfoxide in water. Acetylated and non-acetylated versions of the peptide HGIQPDGQMPSDKTIGGGDDSFNTFFSE with isotopically-labeled isoleucine (heavy peptides) was added into the mixture of the same concentration. Three µl of the sample were analyzed on the UltiMate 3000 RSLCnano system (Dionex, Sunnyvale, CA, USA) coupled to a TripleTOF 5600 mass spectrometer with a NanoSpray III source (AB Sciex, Framingham, MA, USA). The peptides were trapped and desalted with 2% acetonitrile in 0.1% formic acid at a flow rate of 5 μl/min on the Acclaim PepMap100 column (5 μm, 2 cm × 100 μm ID, Thermo Scientific). Eluted peptides were separated by the Acclaim PepMap100 analytical column (3 μm, 25 cm × 75 μm ID, Thermo Scientific) using a 70-min elution gradient at a constant flow of 300 nl/min, with mobile phase A being 0.1% formic acid and mobile phase B being 0.1% formic acid in acetonitrile. Extracted ion chromatogram of the αK40 containing identified peptides, either acetylated or nonacetylated, in light and heavy forms, were generated and the area of relevant peaks of charge state 3 was recorded. The area of light peptides was normalized to the heavy peptide area, and the percentage of acetylated versus non-acetylated peptides was calculated. Labeling of HALO-HDAC6 fusions The HALO-HDAC6 variants were labeled via covalent modification of the HALO fusion partner using the HaloTag-FITC ligand. The HALO-HDAC6 fusion (1 mg/ml) was incubated with a 5 molar excess of the ligand overnight at 4 °C. The unbound labels were removed by size exclusion chromatography using the Superdex 10/300 HR200 column with 30 mM HEPES, 140 mM NaCl, 10 mM KCl, 3% glycerol, and 0.25 mM TCEP, at pH 7.4 adjusted with NaOH, as a mobile phase, and labeled fusions were concentrated to approximately 1 mg/ml, aliquoted, and then snap-frozen in liquid nitrogen.
Preparation of tubulin polymers
To obtain taxol-stabilized microtubules, tubulin at a concentration of 4.4 mg/ml was polymerized for 30 min at 37 °C in BRB80 buffer supplemented with 4.8% DMSO, 4 mM MgCl 2 , and 1 mM GTP, after which BRB80 with 20 µM paclitaxel was added. For GMPCPP-stabilized microtubules, tubulin at a concentration of 0.25 mg/ml was incubated for 2 h at 37 °C in BRB80 buffer supplemented with 1 mM MgCl 2 and 1 mM GMPCPP (Jena Bioscience, Jena, Germany). Dolastatin-10 rings resulted from the polymerization of 2.2 mg/ml tubulin for 40 min at room temperature with 40 µM dolastatin-10 in 80 mM PIPES (pH 6.9), 50 mM KCl, 1 mM EGTA, 1 mM MgCl 2 , and 1 mM DTT. After the polymerization, all abovementioned polymers were pelleted at 30,000 × g for 40 min at 37 °C and the pellet was suspended in warm BRB80 with 20 µM taxol to the required concentration. Zn-sheets were prepared via 2 h incubation of 3 mg/ml tubulin at 37 °C in 80 mM MES, 200 mM NaCl, 3 mM GTP, 1.25 mM MgSO 4 , 1.25 mM ZnSO 4 , and 0.025 mg/ml pepstatin, adjusted to a pH of 5.5 with NaOH. Zn-sheets were then stabilized by the addition of paclitaxel to a final concentration of 31.5 µM. Zn-sheets were pelleted at 30,000 × g for 40 min at 37 °C and the pellet was suspended in a warm solution of 80 mM MES, 200 mM NaCl, 1.25 mM MgSO 4 , and 20 µM taxol, adjusted to a of pH 5.5 with NaOH.
Microtubule binding assay
Microtubules and flow cells were prepared as described previously 66 . Briefly, taxol-stabilized microtubules were polymerized from tubulin purified from pig brains using a 1:30 ratio of Alexa-647-labeled tubulin to unlabeled tubulin, at a concentration of 2 µM and 1 mM GMPCPP in BRB80. Microscope chambers were constructed of silanized coverslips, with parafilm used to space them to form channels of 0.1-mm thickness, 3-mm width, and 18-mm length. Silanization was performed as described previously 67 . Microtubules were immobilized to the glass surface of a flow cell covered with anti-β-tubulin antibodies (Sigma-Aldrich, St. Louis, MO, USA, #T7816, 20 µg/ml in PBS), and then GFP-labeled HDAC6 was flushed into the flow cell at a final concentration of 300 nM. All experiments were carried out in a buffer consisting of BRB50, 1 mM TCEP, 0.5 mg/ml casein, 10 µM paclitaxel, 20 mM D-glucose, 110 µg/ml glucose oxidase, and 20 µg/ml catalase.
TIRF microscopy
Binding experiments were visualized using TIRF microscopy. Experiments were carried out using a Nikon Ti-E microscope equipped with H-TIRF System, 60x oil immersion 1.49 NA TIRF objective and Andor Ixon Ultra EMCCD camera (Andor Technology, Belfast, UK) controlled by NIS Elements software (Nikon). Alexa-647-labeled microtubules and GFP-labeled HDAC6 in microtubule binding assays were visualized sequentially by switching between 640 nm and 488 nm excitation lasers. The image acquisition rate was 0.5 frames per second for sequential dual-color imaging, and image analysis was performed using Fiji 68 and MatLab (MathWorks). Deacetylation of tubulin dimers and polymers Using a fluorescence peptide-based assay, we first verified that small molecule components (e.g., taxol, GMPCPP, Dolastatin-10, Zn 2+ ions) do not interfere with HDAC6 deacetylase activity at levels above the highest concentrations used in our assays (data not shown). Deacetylation reactions in a total volume of 20 µl were performed in BRB80 buffer (experiments with Zn sheets were performed in 80 mM MES, 200 mM NaCl, and 1.25 mM MgSO 4 , adjusted to pH 5.5 with NaOH) supplemented with 1 mM TCEP and 0.5 mg/ml BSA, at 37 °C for 30 min in the case of dimers; for microtubules, the reaction was continuous and aliquots were usually harvested at 0.5, 1, 2, and 3 h. Prior to the reaction, HDAC6 was diluted to the required concentrations in the BRB80 buffer supplemented with TCEP and BSA, and the reaction was started by the addition of tubulin dimers/microtubules. Colchicine (40 µM) and paclitaxel (10 µM) were added to reaction mixtures of free tubulin dimers and microtubules, respectively. For assays with denatured tubulin dimers, the mixture of free tubulin dimers was incubated for 20 min at 95 °C, then cooled and deacetylated as native substrates. The deacetylation reaction was stopped by the addition of 20 µl of 2x Laemmli buffer and boiling samples at 95 °C for 5 min. SDS-PAGE, Western blotting, and data analysis Samples were loaded onto a 4–20% gradient PAGE gel (GenScript, Piscataway, NJ, USA) at 150 ng of tubulin per lane, and then run in MOPS-SDS running buffer at 160 V for 45 mins. Gels were electrotransferred onto a PVDF membrane that was subsequently blocked with 5% (w/v) BSA in TBS. The level of tubulin acetylation at αK40 was determined using a monoclonal anti-acetylated tubulin antibody 69 (Sigma, T7451, 0.3 µg/ml); a secondary goat anti-mouse antibody conjugated to Alexa Fluor 488 (Life Technologies, A11029, dilution 0.4 µg/ml) and normalized to the amount of total tubulin detected by rabbit polyclonal anti-α tubulin antibody (Abcam, Cambridge UK, ab18251, 1 µg/ml); and a secondary donkey anti-rabbit antibody conjugated to Alexa Fluor 568 (Life Technologies, USA, A10042, 0.4 µg/ml). HDAC6 was visualized using a custom-made anti-HDAC6 polyclonal rabbit sera at 1:5,000 dilution. Fluorescence intensity was measured by Typhoon FLA9500 imager (GE Healthcare Bio-Sciences) and quantified using Quantity One 1-D Analysis Software (Bio-Rad, Hercules, CA, USA).
Data analysis of enzyme kinetics and statistical analysis using one-way
ANOVA with Tukey’s post hoc tests were performed using Graph Pad Prism software.
Indirect immunofluorescence microscopy
Deacetylation experiments were also visualized using indirect immunofluorescence microscopy. Deacetylation reactions were terminated by the addition of 10 µM SAHA, and the mixture of microtubules and HDAC6 was applied to a glass slide pretreated by poly-L-lysine. The following steps were carried out in PBS supplemented with 10 µM taxol at room temperature. Coverslips were washed with PBS and blocked with 0.5% BSA for 20 min. Coverslips were then incubated with anti-acetylated tubulin monoclonal antibody (10 µg/ml) and rabbit polyclonal anti-α tubulin antibody (2.5 µg/ml) for 20 min. Following the washing step, goat anti-mouse antibody conjugated to Alexa Fluor 488 and goat anti-rabbit antibody conjugated to Alexa Fluor 594 were applied for 20 min. After the final wash, coverslips were mounted in VectaShield medium (Vector Laboratories), and images were obtained using the Nikon Eclipse Ti fluorescence microscope equipped with a 100x immersion oil objective and additive 2.5x lens magnification (Nikon), as well as with the ORCA-flash 4.0 digital CMOS camera (Hamamatsu Photonics, Japan). Images were processed using Adobe Photoshop software and the signal intensity was quantified using Fiji.
Data availability
All data generated or analysed during this study are included in this published article (and its Supplementary Information files).
Electronic supplementary material Supplementary Material
📊 Figures
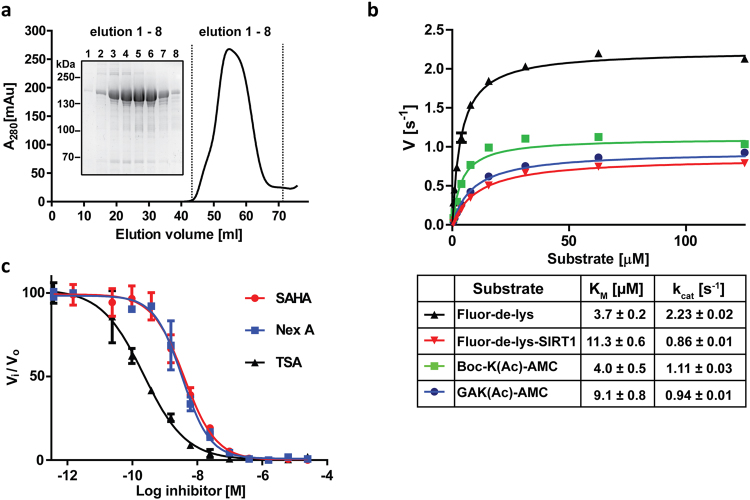
Figure 1
Purification and characterization of full length HDAC6. ( a ) Elution profile of human HDAC6 from a Superdex 16/600 HR200 size-exclusion column (SEC) and reducing SDS-PAGE analysis of HDAC6 fractions ...
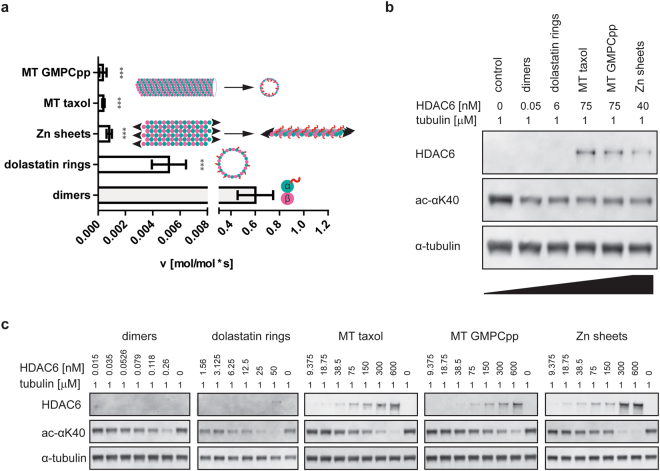
Figure 2
HDAC6 shows strong preference for tubulin dimers over polymeric forms. ( a ) Deacetylation activity of HDAC6 on tubulin polymers (zinc sheets, Dolastatin-10 rings, and taxol/GMPCPP-stabilized microtub...
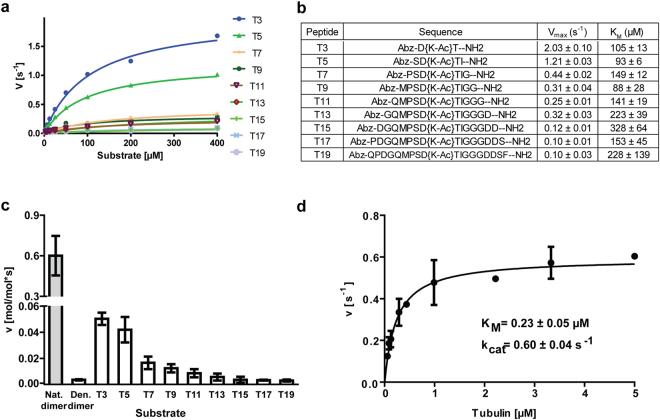
Figure 3
Structural features outside the u03b1K40 loop are required for efficient substrate deacetylation by HDAC6. ( a , b ) Michaelis-Menten kinetics for peptides derived from the Lys40 of u03b1-tubulin (u03...
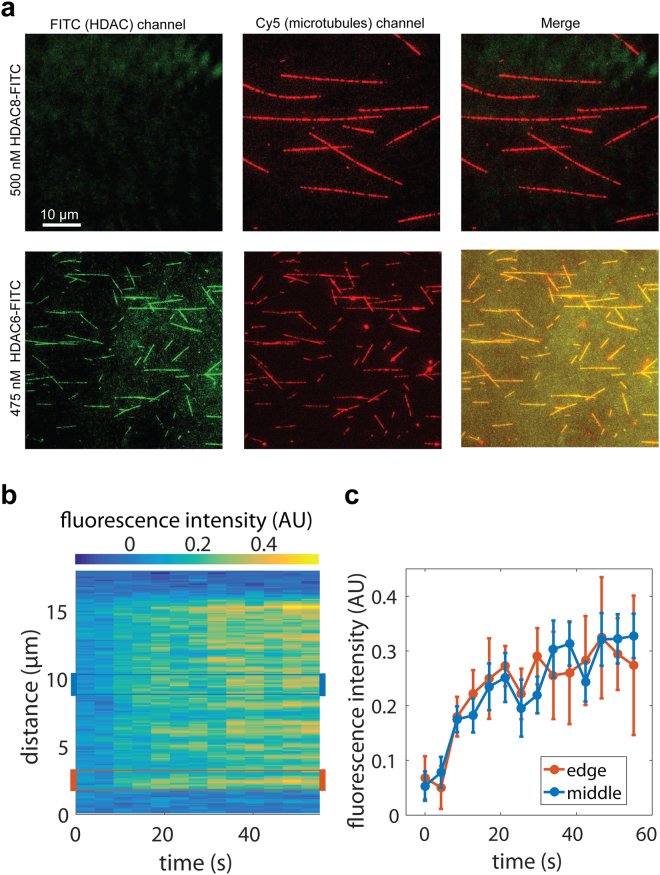
Figure 4
Interaction of HDAC6 with microtubules visualized by TIRF microscopy. ( a ) HDAC6 interacts directly with microtubules. Cy5-labeled microtubules were immobilized on a glass coverslip surface. Microgra...
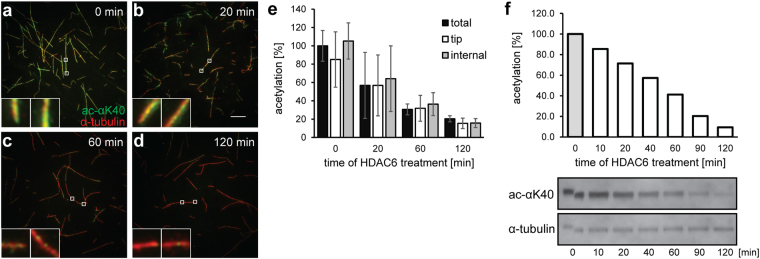
Figure 5
Stochastic, time-dependent deacetylation of assembled microtubules by HDAC6. In vitro assembled microtubules (1u2009u00b5M) were treated with 2u2009u00b5M human HDAC6 in BRB80 buffer. Deacetylation re...
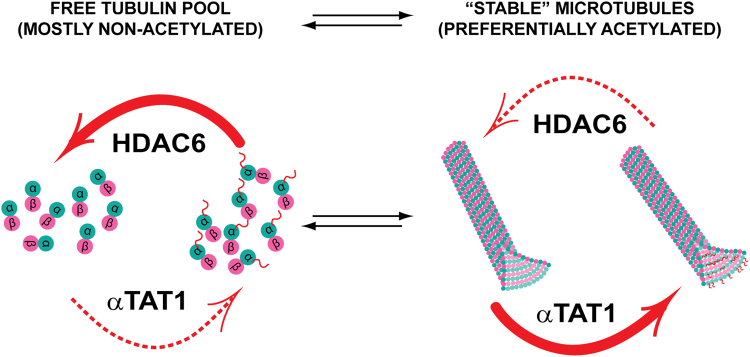
Figure 6
High acetylation levels of stable microtubules are linked to opposing substrate preferences of HDAC6 and u03b1TAT1. HDAC6 prefers free tubulin as a substrate, whereas u03b1TAT1 is 5-fold more active o...
Figure images are served from the NIH/NLM PubMed Central Open Access Subset or Europe PMC; copyright remains with the publishers and authors.
💬 Discussion
0 commentsNo comments yet. Be the first to start a discussion!
Leave a Comment