Abstract
We have established a preparation in larval Drosophila to monitor fictive locomotion simultaneously across abdominal and thoracic segments of the isolated CNS with genetically encoded Ca(2+) indicators. The Ca(2+) signals closely followed spiking activity measured electrophysiologically in nerve roots. Three motor patterns are analyzed. Two comprise waves of Ca(2+) signals that progress along the longitudinal body axis in a posterior-to-anterior or anterior-to-posterior direction. These waves had statistically indistinguishable intersegmental phase delays compared with segmental contractions during forward and backward crawling behavior, despite being ∼10 times slower. During these waves, motor neurons of the dorsal longitudinal and transverse muscles were active in the same order as the muscle groups are recruited during crawling behavior. A third fictive motor pattern exhibits a left-right asymmetry across segments and bears similarities with turning behavior in intact larvae, occurring equally frequently and involving asymmetry in the same segments. Ablation of the segments in which forward and backward waves of Ca(2+) signals were normally initiated did not eliminate production of Ca(2+) waves. When the brain and subesophageal ganglion (SOG) were removed, the remaining ganglia retained the ability to produce both forward and backward waves of motor activity, although the speed and frequency of waves changed. Bilateral asymmetry of activity was reduced when the brain was removed and abolished when the SOG was removed. This work paves the way to studying the neural and genetic underpinnings of segmentally coordinated motor pattern generation in Drosophila with imaging techniques.
🔬 Techniques
🔭 Microscopes
🧬 Organisms
💻 Software
✨ Fluorophores
🧪 Sample Preparation
🏭 Microscope Brands
📷 Detectors
💻 Software Details
🏛️ Research Organizations (ROR)
Affiliated research institutions:
📋 Methods
Animal rearing and genetic constructs. Fly larvae were reared on cornmeal-based food or sucrose-enriched agar and dried baker's yeast or on yeast alone. For imaging experiments, we used the GAL4-UAS system ( Brand and Perrimon 1993 ) to drive expression of the Ca 2+ indicator GCaMP3 ( Tian et al. 2009 ). OK371-GAL4 ( Mahr and Aberle 2006 ) was used for expression in all glutamatergic neurons, including all motor neurons; RRAF-GAL4 ( Worrell and Levine 2008 ) for a motor neuron (aCC) that innervates a dorsal longitudinal muscle (DO1); BAR-GAL4 ( Garces et al. 2006 ) for a group of motor neurons (LT MNs) that innervate lateral transverse muscles (LT 1–4); and RN2-Flp, Tub-FRT-CD2-FRT-GAL4 ( Landgraf et al. 2003 ) for two motor neurons (aCC and RP2), to identify their projection through nerve roots. We used both Oregon R (OrR) and OK371-GAL4 × UAS-GCaMP3 (OK371-GCaMP) larvae in behavioral experiments. Isolated CNS dissection. For imaging and electrophysiology experiments, individual third instar larvae were positioned dorsal side up on Sylgard-lined petri dishes and pinned through the mouthparts and posterior abdomen. An incision along the dorsal surface was made with fine scissors, and the internal organs were removed. The body wall was then pinned flat. The CNS, including the brain, subesophageal ganglion (SOG), and ventral nerve cord (VNC), was dissected away from the larval body wall and positioned dorsal side up, secured at segmental nerves by pins fashioned from fine tungsten wire (California Fine Wire, Grover Beach, CA). In a subset of experiments, we positioned the isolated CNS on a coverslip coated in poly- d -lysine and then used either fine scissors or 18-gauge syringe tip needles to remove sections of the nervous system. Recordings were made at least 15 min after ablation. For all dissections and experiments, the CNS was covered with physiological saline containing (in mM) 135 NaCl, 5 KCl, 2 CaCl 2 , 4 MgCl 2 , 5 TES, and 36 sucrose. Electrophysiology. In Drosophila embryos, the axons of motor neurons innervating the lateral transverse and dorsal longitudinal muscles run in different nerves (intersegmental and segmental nerve, respectively). However, in third instar larvae, both nerves are bundled together; we refer to this bundle as the common nerve root (CNR). We used suction electrodes to measure activity in CNRs containing motor neurons that, prior to severing, project to the muscle field of individual abdominal hemisegments. Borosilicate glass capillaries were pulled with a P90 electrode puller (Sutter Instruments, Novato, CA), and tapered tips were broken to produce suction electrodes that fit tightly around single nerve roots. Electrodes were maneuvered with a MP-285 (Sutter Instruments) or a Leitz micromanipulator (Leica Microsystems, Wetzlar, Germany). Electrophysiological signals were amplified with a model 1700 extracellular amplifier (A-M Systems, Sequim, WA) and recorded with a PowerLab 16/30 data acquisition system and LabChart 7.1 software (AD Instruments, Colorado Springs, CO). Recordings were analyzed off-line with custom scripts in MATLAB (MathWorks, Natick, MA) and Spike2 (Cambridge Electronic Design, Cambridge, UK). Live imaging in isolated CNS. We used wide-field epifluorescence microscopy for all live imaging experiments ( Fig. 1 A ). An Optoscan monochromator (Cairn Research, Faversham, UK) uniformly illuminated the preparations with 488 ± 15-nm light using either a Leica DM-LFS (Leica Microsystems) or an Olympus X50WI compound microscope (Olympus, Center Valley, PA). Emitted light passed through standard green fluorescent protein (GFP) emission filters before reaching an Andor DU897 EMCCD camera (Andor Technologies, Belfast, UK). Images were captured at 5 or 10 Hz with Andor IQ software and constant gain settings. Optical and electrical recordings were synchronized with pulses generated during each camera exposure. Images were stabilized against lateral shifts in ImageJ (NIH, Bethesda, MD). Fluorescence values were extracted from regions of interest (ROIs) in thoracic (T2–T3) and abdominal (A1–A8/9) ganglia with ImageJ or custom MATLAB scripts. T1 and the SOG were obscured by the brain and were not analyzed. Extracted optical signals were analyzed in ImageJ, MATLAB, and Spike2. Signals are expressed as the percent change in fluorescence from baseline, ΔF/F. Changes of 50% ΔF/F were typical in all segments. Fig. 1. Ca 2+ signals in the isolated central nervous system (CNS) of larval Drosophila . A : experimental setup. B : diagram of CNS. Black square indicates region imaged in following panels. SOG, subesophageal ganglion; THOR, thorax; ABD, abdomen; VNC, ventral nerve cord. C : still image of Ca 2+ signal. CNS segments labeled from thoracic segment 2 (T2) to fused abdominal segment A8/9. D : sequence of still images of Ca 2+ signals, running from top left to bottom right ; successive images are 1.9 s apart. Posterior-to-anterior (forward, *) and anterior-to-posterior (backward, **) Ca 2+ waves are shown. E and F : magnified view of forward wave ( E ) and backward wave ( F ), also showing bilaterally asymmetric activity in thoracic and anterior abdominal segments (white arrowheads). G and H : synchronous activity in posterior ( G ) and anterior ( H ) segments. Raw fluorescence intensity is indicated by color map scale bar. GAL4 Driver: OK371-GAL4. Scale bars, 100 μm. Confocal microscopy. In a subset of experiments, we fixed larval CNSs in 4% paraformaldehyde and then imaged GFP fluorescence with a TCS-SP-5 confocal microscope (Leica) using LAS AF software as described previously ( Berni et al. 2012 ). Larval crawling behavior. For behavior experiments, third instar larvae were washed and transferred to a petri dish thinly coated with 0.8% agarose. To examine the basic dynamics of crawling, we placed single larvae into a 23 × 23-cm square acrylic tray and, after 30 s of acclimatization, imaged larval behavior for 4–5 min. Images were captured at 26 Hz with a Stingray CCD camera (Allied Vision Technologies, Stadtroda, Germany) mounted on a Leica M165 FC dissecting microscope. In a separate set of experiments, we used higher magnification to analyze the kinematics of body wall movements in freely crawling animals. In these experiments, animals were placed in a smaller (10-cm diameter) petri dish, which was inverted to facilitate imaging of the ventral cuticle and denticle bands. Denticle bands are rows of hairs located near abdominal segmental boundaries and the attachment sites for dorsal and ventral muscle groups. These images were captured at 30 Hz with a TK0C1380 camera (JVC, Yokohama, Japan) mounted on a dissecting microscope. Data were recorded with a DSR-30P video recorder (Sony, Tokyo, Japan). After 30-s acclimatization, larvae were imaged for 1–2 min. Because crawling larvae rarely produced more than one or two backward waves at a time, in some experiments we promoted backward crawling by tying a filament of dental floss around the thorax. This treatment successfully induced bouts of 3–10 backward waves. As in previous studies ( Berni 2015 ; Berni et al. 2012 ; Gjorgjieva et al. 2013 ), we measured the distance between denticle bands in adjacent segments to analyze intersegmental coordination in crawling larvae. Denticle bands are pigmented and easily visible from segments A1–A8, and therefore data for contraction of segments can be calculated for A1–A7. Denticle movements were tracked with the “Manual Tracking” plug-in for ImageJ. Data were processed in Excel (Microsoft, Redmond, WA) and further analyzed in Spike2 and MATLAB. Coherence-based analysis of periodic activity. In a subset of experiments, we determined the phase relationships between segments for both imaging and behavioral data, using direct multitaper estimates of power spectra and coherence ( Cacciatore et al. 1999 ; Percival and Walden 1993 ; Taylor et al. 2003 ). In all experiments, we determined the dominant frequency of waves in segment A7 from the power spectrum and calculated the coherence with other segments at that frequency ( Thompson and Chave 1991 ). Time delays were sometimes calculated by multiplying the phase value by the dominant frequency. Coherence is a complex-valued quantity, comprising both a phase value and a magnitude. Standard statistical tests were used to determine whether the coherence magnitude was significantly different from zero ( Jarvis and Mitra 2001 ). To calculate 95% confidence intervals we used a jackknife technique ( Thompson and Chave 1991 ). Spectral calculations were carried out with custom scripts written in MATLAB. Statistics. All values are given as means ± SD unless otherwise stated. We tested data for normality using the Shapiro-Wilk test, with α = 0.05. When data were normally distributed, t -tests were used to test for significant differences or analysis of variance (ANOVA) followed by Tukey-Kramer post hoc analysis for multiple comparisons. For data that were not normally distributed, two-sample Wilcoxon tests were used or Kruskal-Wallis tests followed by Neuman-Keuls post hoc analysis for multiple comparisons. Statistical analyses were carried out in Excel, R (R Foundation, Vienna, Austria), SigmaPlot (Systat, San Jose, CA), and MATLAB.
Show full methods section
Animal rearing and genetic constructs. Fly larvae were reared on cornmeal-based food or sucrose-enriched agar and dried baker's yeast or on yeast alone. For imaging experiments, we used the GAL4-UAS system ( Brand and Perrimon 1993 ) to drive expression of the Ca 2+ indicator GCaMP3 ( Tian et al. 2009 ). OK371-GAL4 ( Mahr and Aberle 2006 ) was used for expression in all glutamatergic neurons, including all motor neurons; RRAF-GAL4 ( Worrell and Levine 2008 ) for a motor neuron (aCC) that innervates a dorsal longitudinal muscle (DO1); BAR-GAL4 ( Garces et al. 2006 ) for a group of motor neurons (LT MNs) that innervate lateral transverse muscles (LT 1–4); and RN2-Flp, Tub-FRT-CD2-FRT-GAL4 ( Landgraf et al. 2003 ) for two motor neurons (aCC and RP2), to identify their projection through nerve roots. We used both Oregon R (OrR) and OK371-GAL4 × UAS-GCaMP3 (OK371-GCaMP) larvae in behavioral experiments. Isolated CNS dissection. For imaging and electrophysiology experiments, individual third instar larvae were positioned dorsal side up on Sylgard-lined petri dishes and pinned through the mouthparts and posterior abdomen. An incision along the dorsal surface was made with fine scissors, and the internal organs were removed. The body wall was then pinned flat. The CNS, including the brain, subesophageal ganglion (SOG), and ventral nerve cord (VNC), was dissected away from the larval body wall and positioned dorsal side up, secured at segmental nerves by pins fashioned from fine tungsten wire (California Fine Wire, Grover Beach, CA). In a subset of experiments, we positioned the isolated CNS on a coverslip coated in poly- d -lysine and then used either fine scissors or 18-gauge syringe tip needles to remove sections of the nervous system. Recordings were made at least 15 min after ablation. For all dissections and experiments, the CNS was covered with physiological saline containing (in mM) 135 NaCl, 5 KCl, 2 CaCl 2 , 4 MgCl 2 , 5 TES, and 36 sucrose. Electrophysiology. In Drosophila embryos, the axons of motor neurons innervating the lateral transverse and dorsal longitudinal muscles run in different nerves (intersegmental and segmental nerve, respectively). However, in third instar larvae, both nerves are bundled together; we refer to this bundle as the common nerve root (CNR). We used suction electrodes to measure activity in CNRs containing motor neurons that, prior to severing, project to the muscle field of individual abdominal hemisegments. Borosilicate glass capillaries were pulled with a P90 electrode puller (Sutter Instruments, Novato, CA), and tapered tips were broken to produce suction electrodes that fit tightly around single nerve roots. Electrodes were maneuvered with a MP-285 (Sutter Instruments) or a Leitz micromanipulator (Leica Microsystems, Wetzlar, Germany). Electrophysiological signals were amplified with a model 1700 extracellular amplifier (A-M Systems, Sequim, WA) and recorded with a PowerLab 16/30 data acquisition system and LabChart 7.1 software (AD Instruments, Colorado Springs, CO). Recordings were analyzed off-line with custom scripts in MATLAB (MathWorks, Natick, MA) and Spike2 (Cambridge Electronic Design, Cambridge, UK). Live imaging in isolated CNS. We used wide-field epifluorescence microscopy for all live imaging experiments ( Fig. 1 A ). An Optoscan monochromator (Cairn Research, Faversham, UK) uniformly illuminated the preparations with 488 ± 15-nm light using either a Leica DM-LFS (Leica Microsystems) or an Olympus X50WI compound microscope (Olympus, Center Valley, PA). Emitted light passed through standard green fluorescent protein (GFP) emission filters before reaching an Andor DU897 EMCCD camera (Andor Technologies, Belfast, UK). Images were captured at 5 or 10 Hz with Andor IQ software and constant gain settings. Optical and electrical recordings were synchronized with pulses generated during each camera exposure. Images were stabilized against lateral shifts in ImageJ (NIH, Bethesda, MD). Fluorescence values were extracted from regions of interest (ROIs) in thoracic (T2–T3) and abdominal (A1–A8/9) ganglia with ImageJ or custom MATLAB scripts. T1 and the SOG were obscured by the brain and were not analyzed. Extracted optical signals were analyzed in ImageJ, MATLAB, and Spike2. Signals are expressed as the percent change in fluorescence from baseline, ΔF/F. Changes of 50% ΔF/F were typical in all segments. Fig. 1. Ca 2+ signals in the isolated central nervous system (CNS) of larval Drosophila . A : experimental setup. B : diagram of CNS. Black square indicates region imaged in following panels. SOG, subesophageal ganglion; THOR, thorax; ABD, abdomen; VNC, ventral nerve cord. C : still image of Ca 2+ signal. CNS segments labeled from thoracic segment 2 (T2) to fused abdominal segment A8/9. D : sequence of still images of Ca 2+ signals, running from top left to bottom right ; successive images are 1.9 s apart. Posterior-to-anterior (forward, *) and anterior-to-posterior (backward, **) Ca 2+ waves are shown. E and F : magnified view of forward wave ( E ) and backward wave ( F ), also showing bilaterally asymmetric activity in thoracic and anterior abdominal segments (white arrowheads). G and H : synchronous activity in posterior ( G ) and anterior ( H ) segments. Raw fluorescence intensity is indicated by color map scale bar. GAL4 Driver: OK371-GAL4. Scale bars, 100 μm. Confocal microscopy. In a subset of experiments, we fixed larval CNSs in 4% paraformaldehyde and then imaged GFP fluorescence with a TCS-SP-5 confocal microscope (Leica) using LAS AF software as described previously ( Berni et al. 2012 ). Larval crawling behavior. For behavior experiments, third instar larvae were washed and transferred to a petri dish thinly coated with 0.8% agarose. To examine the basic dynamics of crawling, we placed single larvae into a 23 × 23-cm square acrylic tray and, after 30 s of acclimatization, imaged larval behavior for 4–5 min. Images were captured at 26 Hz with a Stingray CCD camera (Allied Vision Technologies, Stadtroda, Germany) mounted on a Leica M165 FC dissecting microscope. In a separate set of experiments, we used higher magnification to analyze the kinematics of body wall movements in freely crawling animals. In these experiments, animals were placed in a smaller (10-cm diameter) petri dish, which was inverted to facilitate imaging of the ventral cuticle and denticle bands. Denticle bands are rows of hairs located near abdominal segmental boundaries and the attachment sites for dorsal and ventral muscle groups. These images were captured at 30 Hz with a TK0C1380 camera (JVC, Yokohama, Japan) mounted on a dissecting microscope. Data were recorded with a DSR-30P video recorder (Sony, Tokyo, Japan). After 30-s acclimatization, larvae were imaged for 1–2 min. Because crawling larvae rarely produced more than one or two backward waves at a time, in some experiments we promoted backward crawling by tying a filament of dental floss around the thorax. This treatment successfully induced bouts of 3–10 backward waves. As in previous studies ( Berni 2015 ; Berni et al. 2012 ; Gjorgjieva et al. 2013 ), we measured the distance between denticle bands in adjacent segments to analyze intersegmental coordination in crawling larvae. Denticle bands are pigmented and easily visible from segments A1–A8, and therefore data for contraction of segments can be calculated for A1–A7. Denticle movements were tracked with the “Manual Tracking” plug-in for ImageJ. Data were processed in Excel (Microsoft, Redmond, WA) and further analyzed in Spike2 and MATLAB. Coherence-based analysis of periodic activity. In a subset of experiments, we determined the phase relationships between segments for both imaging and behavioral data, using direct multitaper estimates of power spectra and coherence ( Cacciatore et al. 1999 ; Percival and Walden 1993 ; Taylor et al. 2003 ). In all experiments, we determined the dominant frequency of waves in segment A7 from the power spectrum and calculated the coherence with other segments at that frequency ( Thompson and Chave 1991 ). Time delays were sometimes calculated by multiplying the phase value by the dominant frequency. Coherence is a complex-valued quantity, comprising both a phase value and a magnitude. Standard statistical tests were used to determine whether the coherence magnitude was significantly different from zero ( Jarvis and Mitra 2001 ). To calculate 95% confidence intervals we used a jackknife technique ( Thompson and Chave 1991 ). Spectral calculations were carried out with custom scripts written in MATLAB. Statistics. All values are given as means ± SD unless otherwise stated. We tested data for normality using the Shapiro-Wilk test, with α = 0.05. When data were normally distributed, t -tests were used to test for significant differences or analysis of variance (ANOVA) followed by Tukey-Kramer post hoc analysis for multiple comparisons. For data that were not normally distributed, two-sample Wilcoxon tests were used or Kruskal-Wallis tests followed by Neuman-Keuls post hoc analysis for multiple comparisons. Statistical analyses were carried out in Excel, R (R Foundation, Vienna, Austria), SigmaPlot (Systat, San Jose, CA), and MATLAB.
Supplementary Material Supplemental Movie 1 Supplemental Movie 2 Supplemental Movie 3 Supplemental Movie 4 Supplemental Movie 5 Supplemental Movie 6
📊 Figures
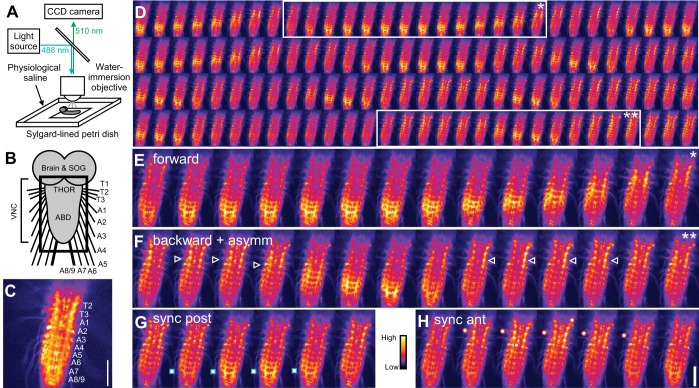
Fig. 1.
Ca 2+ signals in the isolated central nervous system (CNS) of larval Drosophila . A : experimental setup. B : diagram of CNS. Black square indicates region imaged in following panels. SOG, subesophage...
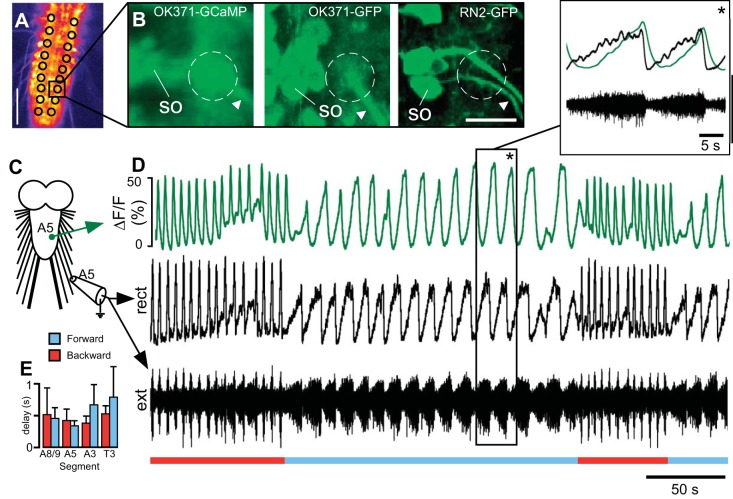
Fig. 2.
Comparison of Ca 2+ signals with suction electrode recordings from common nerve roots (CNRs). A : single frame of Ca 2+ signal showing regions of interest (ROIs) used. Scale bar, 100 u03bcm. B : enlar...
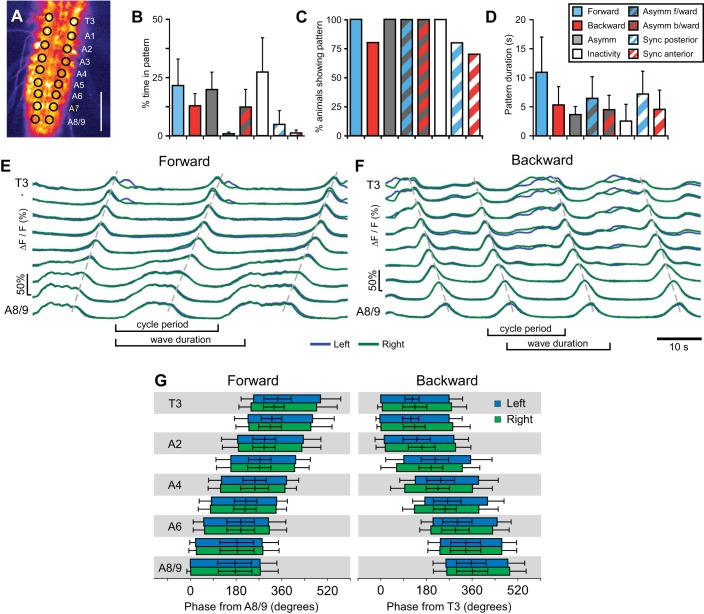
Fig. 3.
Quantification of Ca 2+ waves. A : single frame of Ca 2+ signal showing ROIs used. Scale, 100 u03bcm. Bu2013D : quantification of % of time spent in each pattern ( B ), % of animals showing each patte...
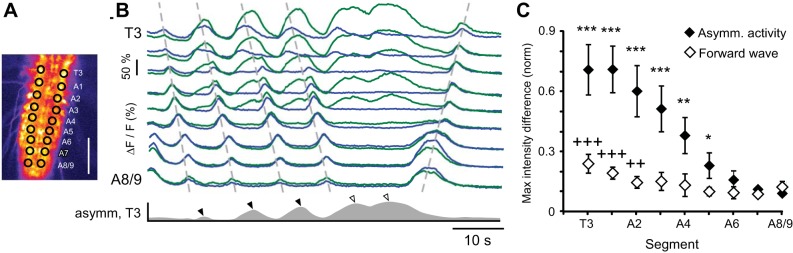
Fig. 4.
Bilaterally asymmetric Ca 2+ signals. A : single frame of Ca 2+ signal showing ROIs. Scale bar, 100 u03bcm. B : Ca 2+ signals from T3-A8/9 during bilaterally asymmetric activity. Dashed lines drawn ma...
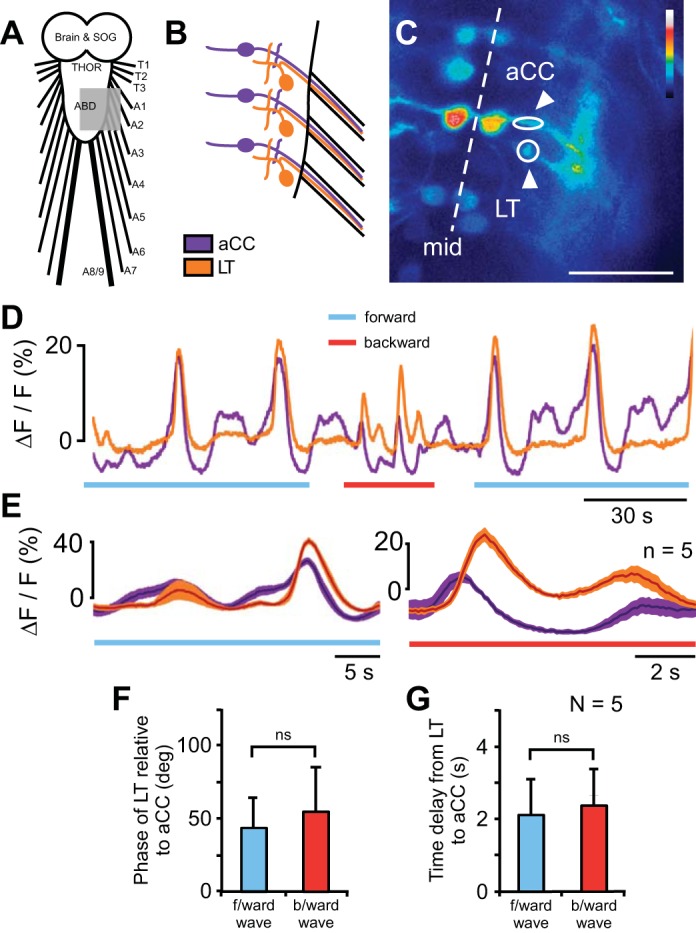
Fig. 5.
Intrasegmental coordination between motor neurons. A : schematic diagram of CNS; gray area represents field imaged. B : magnified schematic diagram of motor neurons imaged; aCC shown in purple and 1 o...
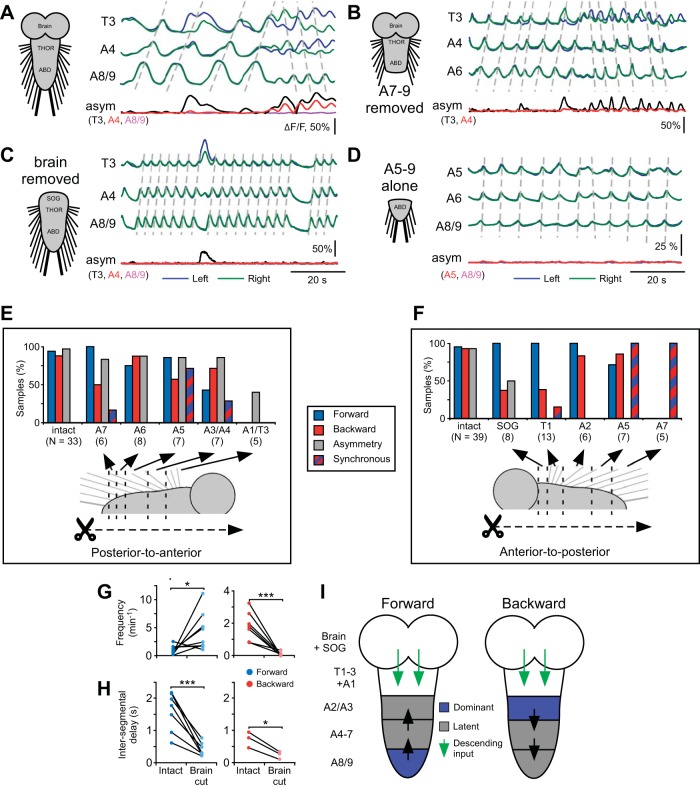
Fig. 6.
Effect of ablation of CNS segments on motor pattern generation. Au2013D : Ca 2+ signals in 3 segments in intact CNS ( A ) and after the ablations indicated on left of each panel ( Bu2013D ). Signals f...
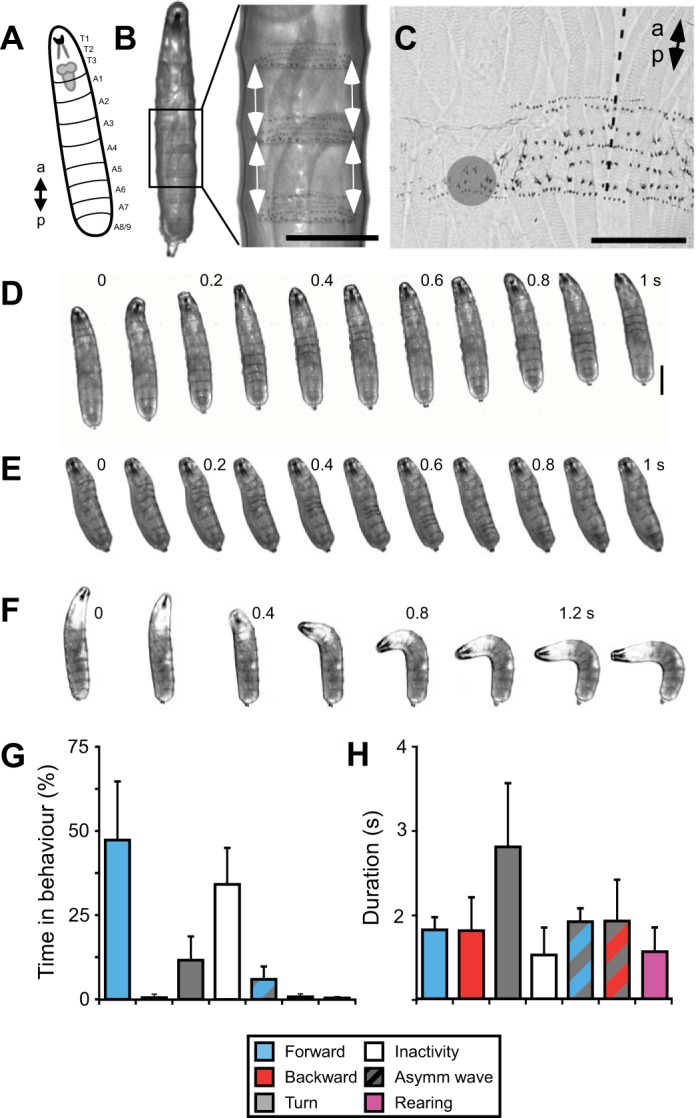
Fig. 7.
Kinematics of larval locomotion. A : diagram of larva with position of CNS shown. B : ventral view of 3rd instar larva. The contraction of each body segment was measured by manually tracking the dista...
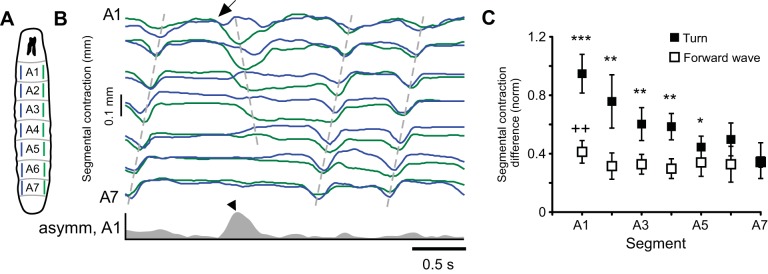
Fig. 8.
Bilateral asymmetry during turning behavior. A : diagram of larva with measured segments indicated. B : representative trace of segmental contraction during a turn. Dashed lines drawn manually over pe...
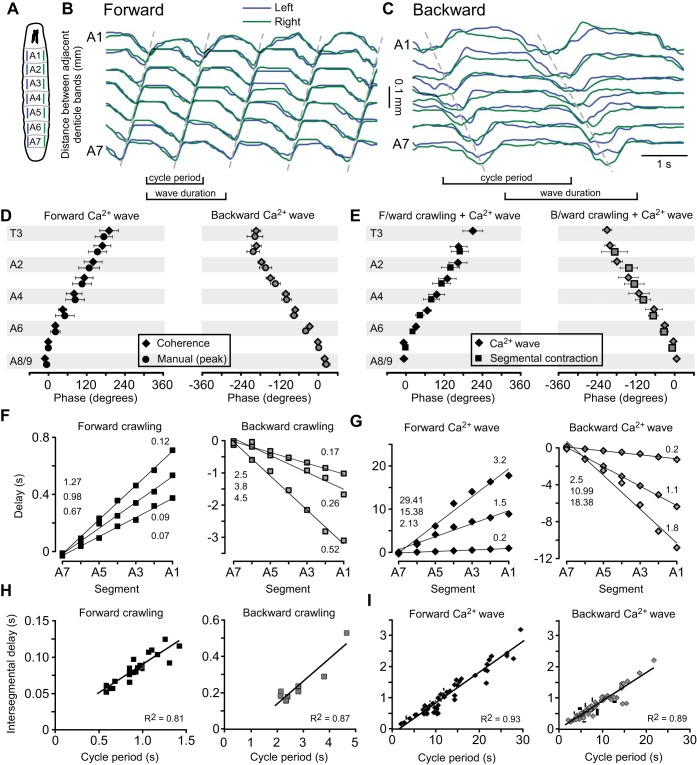
Fig. 9.
Quantification of segmental contraction during crawling and comparison with Ca 2+ waves. A : diagram of larva with measured segments indicated. B and C : representative traces of segmental contraction...
Figure images are served from the NIH/NLM PubMed Central Open Access Subset or Europe PMC; copyright remains with the publishers and authors.
💬 Discussion
0 commentsNo comments yet. Be the first to start a discussion!
Leave a Comment