Abstract
Imaging flow cytometry combines the high throughput nature of flow cytometry with the advantages of single cell image acquisition associated with microscopy. The measurement of large numbers of features from the resulting images provides rich datasets which have resulted in a wide range of novel biomedical applications. In this primer we discuss the typical imaging flow instrumentation, the form of data acquired and the typical analysis tools that can be applied to this data. Using examples from the literature we discuss the progression of the analysis methods that have been applied to imaging flow cytometry data. These methods start from the use of simple single image features and multiple channel gating strategies, followed by the design and use of custom features for phenotype classification, through to powerful machine and deep learning methods. For each of these methods, we outline the processes involved in analyzing typical datasets and provide details of example applications. Finally we discuss the current limitations of imaging flow cytometry and the innovations which are addressing these challenges.
🧪 Sample Preparation
🔬 Cell Lines
📷 Detectors
🏛️ Research Organizations (ROR)
Affiliated research institutions:
📋 Methods
Sample preparation and experimental design
Sample preparation for imaging flow cytometry is analogous, in practical terms, to any form of fluorescent antibody or dye based technology that is used to analyze cells or particles in suspension. In general terms, as with any form of experimentation, the first step is to formulate the question and determine what key measurements are needed. So for example, if the goal is to measure the degree or amount of FoxP3 in the nucleus of primary human regulatory (T-regs) CD4T cells, appropriate markers can be selected by looking at the capability of the available imaging flow cytometer. This impacts how many parameters the researcher could measure per cell as well as which fluorochromes and dyes the system could detect based on things like the number and wavelength of available excitation lasers as well as important information about the detection channels (for example one camera versus two camera system). In this design of the optical setup to be used it is possible to use several widely available online spectral viewers to create a “virtual” machine with the right lasers and filters. The next stage is to then draw up a list of the minimum number of biomarkers that would be required to identify the cell type of interest from a heterogeneous population. If additional channels are available, the researcher should seriously consider whether other parameters might be of interest and measured simultaneously. For example, consider a protocol previously used to identify T-regs from whole, lysed human blood 8 . To do this effectively, one may need to stain the sample with antibodies against CD45 (pan-white blood cell marker) to distinguish white blood cells from un-lysed red blood cells and debris. Next we would want to include an antibody against CD3 to identify all T cells within the CD45-positive white blood cell (WBC) population. As we want to focus on regulatory CD4-positive T cells, we will also need to include an antibody against CD4, as well as CD25 and CD127 (IL-7 receptor alpha chain). In all cases, each antibody would need to be tagged to a unique fluorochrome that would be compatible with the spectral setup of the system as well as each other, although an advantage of imaging cytometry is that markers may be used in the same spectral channel if they are spatially distinct. The selection of fluorochrome to marker/target follows the same rules and approaches for conventional and full spectral fluorescence flow cytometry where essentially low expressed markers are assigned to bright fluorochromes and highly expressed markers to dimmer fluorochromes 9 . As we also want to measure the nuclear occupancy of the FoxP3 protein, we would also have to select an antibody against FoxP3 tagged to a compatible fluorochrome as well as spectrally compatible nuclear dye. In all cases, the fluorescent reagents require careful titration, including the nuclear dye, because signal saturation can pose a challenge: first, due to the reduced dynamic range on the CCD camera (12-bit compared to 18-bit on a non-imaging flow cytometer) and second, the lack of control over each imaging channel (signal intensity is controlled by laser power, meaning that it can be challenging to balance a dim and bright signal for the same laser). Once reagents have been optimized, however, sample preparation follows the same process as with conventional flow cytometry. Briefly, cells are prepared in a single cell suspension and stained with optimized concentrations of surface marker antibodies. After washing, the cells are fixed in 2–5% formaldehyde then permeabilized using a detergent (such as TritonX-100, Nonidet-P40 or Saponin) after which intracellular antibodies are added for a period, with any nuclear dye added at the end, prior to acquisition. Of note, any nuclear dye must be carefully titrated so as to ensure it does not saturate the other signals. As with conventional flow cytometry, single stained controls are required for compensation for all markers (see next section). The most significant difference in sample preparation comes at the last step where it is essential to concentrate the samples in a maximum volume of 50 μl, and ideally if cell numbers allow, at a concentration of 20–30 million cells per ml (thus, 1 million cells total in 50 μl). While this may seem extreme, the imaging flow cytometer tends to run at a slower rate than conventional systems so it can take impractical amounts of time to acquire enough cells in dilute samples, particularly if looking for rarer cell types. A concentrated sample will help to alleviate these issues, however if working with larger and ‘sticky’ cell types, less concentrated samples may be preferred. Sample acquisition is relatively easy; it is often best to begin with a fully stained sample that is known to contain the brightest signals in the panel if possible. It is then relatively simple to use plots that show the “raw maximum pixel” for all events in any channel and to ensure that the excitation laser powers are set to achieve maximum signal without any saturation. As with traditional flow cytometry, before any quantitative analysis can be performed, the data must be compensated for the spectral cross-talk between channels. However the process of compensating imaging flow cytometry data is more involved given the spatial nature of the data. Essentially the spatial resolved data requires compensation at an individual pixel level 10 . Separate aliquots of sample are stained individually with each dye/marker required for the full experiment; the contributions of crosstalk from each marker into the ‘empty’ channels can then be quantified.
Show full methods section
Sample preparation and experimental design
Sample preparation for imaging flow cytometry is analogous, in practical terms, to any form of fluorescent antibody or dye based technology that is used to analyze cells or particles in suspension. In general terms, as with any form of experimentation, the first step is to formulate the question and determine what key measurements are needed. So for example, if the goal is to measure the degree or amount of FoxP3 in the nucleus of primary human regulatory (T-regs) CD4T cells, appropriate markers can be selected by looking at the capability of the available imaging flow cytometer. This impacts how many parameters the researcher could measure per cell as well as which fluorochromes and dyes the system could detect based on things like the number and wavelength of available excitation lasers as well as important information about the detection channels (for example one camera versus two camera system). In this design of the optical setup to be used it is possible to use several widely available online spectral viewers to create a “virtual” machine with the right lasers and filters. The next stage is to then draw up a list of the minimum number of biomarkers that would be required to identify the cell type of interest from a heterogeneous population. If additional channels are available, the researcher should seriously consider whether other parameters might be of interest and measured simultaneously. For example, consider a protocol previously used to identify T-regs from whole, lysed human blood 8 . To do this effectively, one may need to stain the sample with antibodies against CD45 (pan-white blood cell marker) to distinguish white blood cells from un-lysed red blood cells and debris. Next we would want to include an antibody against CD3 to identify all T cells within the CD45-positive white blood cell (WBC) population. As we want to focus on regulatory CD4-positive T cells, we will also need to include an antibody against CD4, as well as CD25 and CD127 (IL-7 receptor alpha chain). In all cases, each antibody would need to be tagged to a unique fluorochrome that would be compatible with the spectral setup of the system as well as each other, although an advantage of imaging cytometry is that markers may be used in the same spectral channel if they are spatially distinct. The selection of fluorochrome to marker/target follows the same rules and approaches for conventional and full spectral fluorescence flow cytometry where essentially low expressed markers are assigned to bright fluorochromes and highly expressed markers to dimmer fluorochromes 9 . As we also want to measure the nuclear occupancy of the FoxP3 protein, we would also have to select an antibody against FoxP3 tagged to a compatible fluorochrome as well as spectrally compatible nuclear dye. In all cases, the fluorescent reagents require careful titration, including the nuclear dye, because signal saturation can pose a challenge: first, due to the reduced dynamic range on the CCD camera (12-bit compared to 18-bit on a non-imaging flow cytometer) and second, the lack of control over each imaging channel (signal intensity is controlled by laser power, meaning that it can be challenging to balance a dim and bright signal for the same laser). Once reagents have been optimized, however, sample preparation follows the same process as with conventional flow cytometry. Briefly, cells are prepared in a single cell suspension and stained with optimized concentrations of surface marker antibodies. After washing, the cells are fixed in 2–5% formaldehyde then permeabilized using a detergent (such as TritonX-100, Nonidet-P40 or Saponin) after which intracellular antibodies are added for a period, with any nuclear dye added at the end, prior to acquisition. Of note, any nuclear dye must be carefully titrated so as to ensure it does not saturate the other signals. As with conventional flow cytometry, single stained controls are required for compensation for all markers (see next section). The most significant difference in sample preparation comes at the last step where it is essential to concentrate the samples in a maximum volume of 50 μl, and ideally if cell numbers allow, at a concentration of 20–30 million cells per ml (thus, 1 million cells total in 50 μl). While this may seem extreme, the imaging flow cytometer tends to run at a slower rate than conventional systems so it can take impractical amounts of time to acquire enough cells in dilute samples, particularly if looking for rarer cell types. A concentrated sample will help to alleviate these issues, however if working with larger and ‘sticky’ cell types, less concentrated samples may be preferred. Sample acquisition is relatively easy; it is often best to begin with a fully stained sample that is known to contain the brightest signals in the panel if possible. It is then relatively simple to use plots that show the “raw maximum pixel” for all events in any channel and to ensure that the excitation laser powers are set to achieve maximum signal without any saturation. As with traditional flow cytometry, before any quantitative analysis can be performed, the data must be compensated for the spectral cross-talk between channels. However the process of compensating imaging flow cytometry data is more involved given the spatial nature of the data. Essentially the spatial resolved data requires compensation at an individual pixel level 10 . Separate aliquots of sample are stained individually with each dye/marker required for the full experiment; the contributions of crosstalk from each marker into the ‘empty’ channels can then be quantified.
📊 Figures
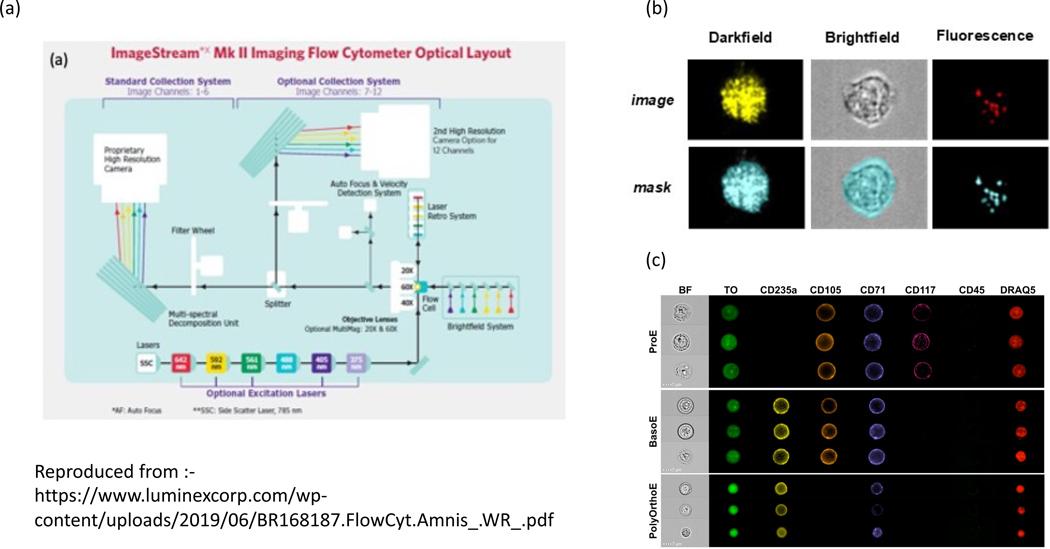
Figure 1:
Diagram of the optical layout of the Imagestream flow cytometer
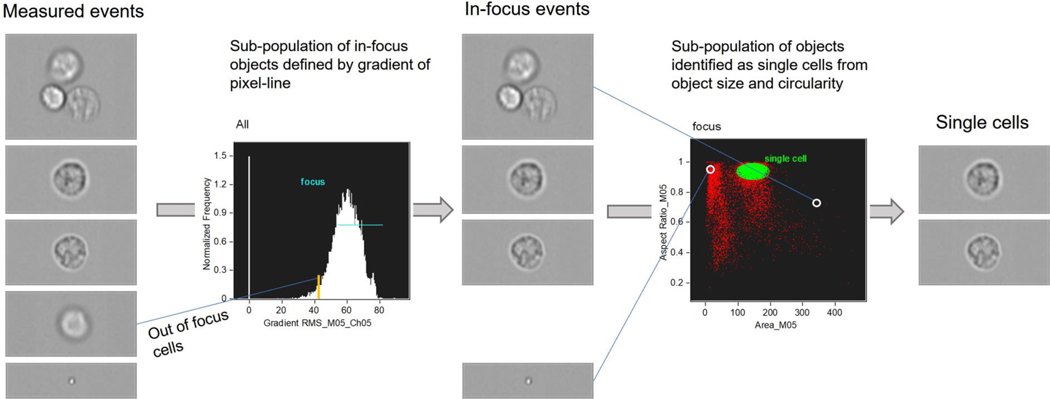
Figure 2:
Process flow employed to select in-focus, single cell images from an acquired event set.
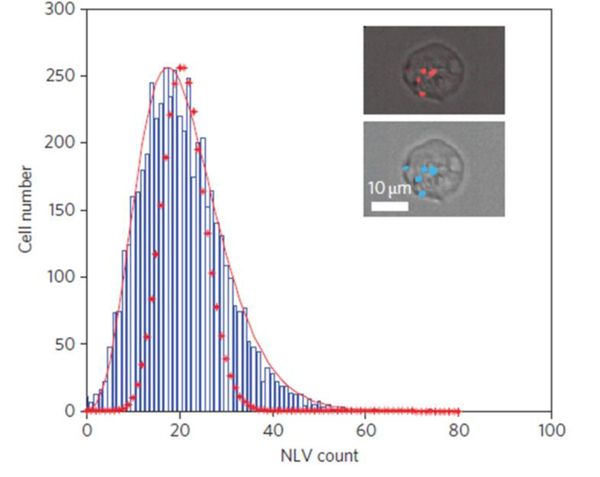
Figure 3:
Histogram of the number of nanoparticle loaded vesicles (NLV) in a cell population under uniform particle exposure. The distribution exhibits over-dispersion relative to a Poisson process (dotted line...
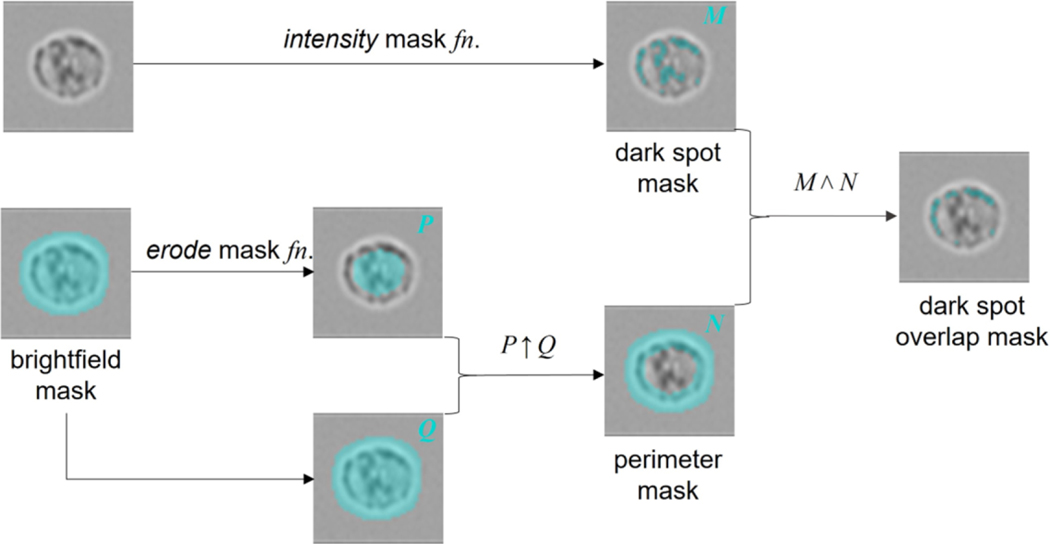
Figure 4:
(a) A schematic overview highlighting the major methodological steps required to measure the spatio-temporal flux of calcium in immune cells in response to various stimuli. (b) Example data whereby Ju...
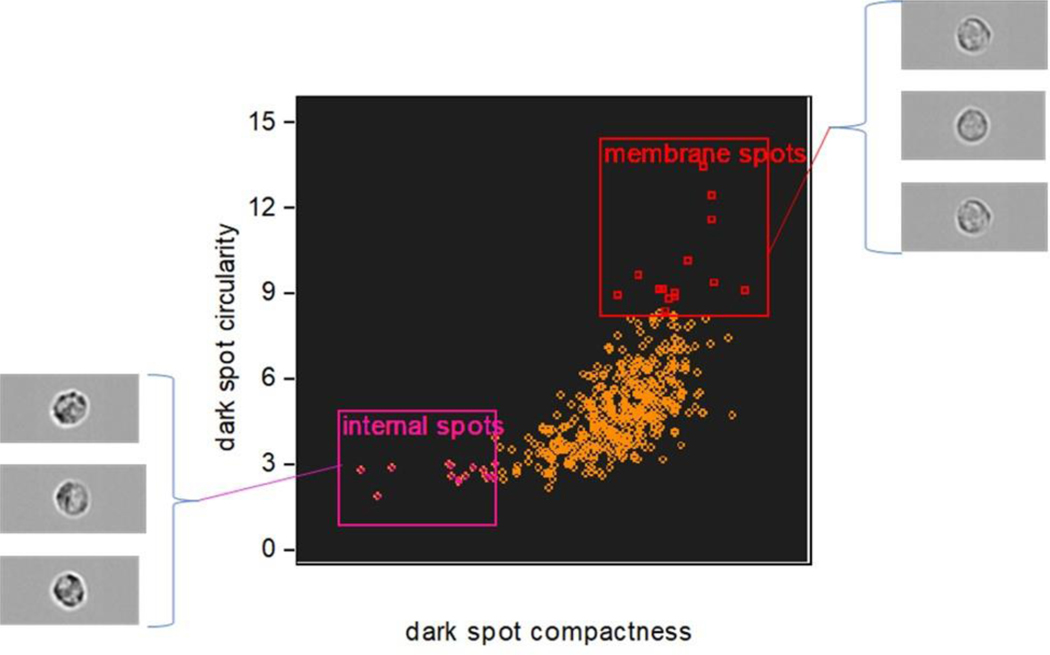
Figure 5:
Process flow for the masking strategy used to isolate membrane-associated granules.
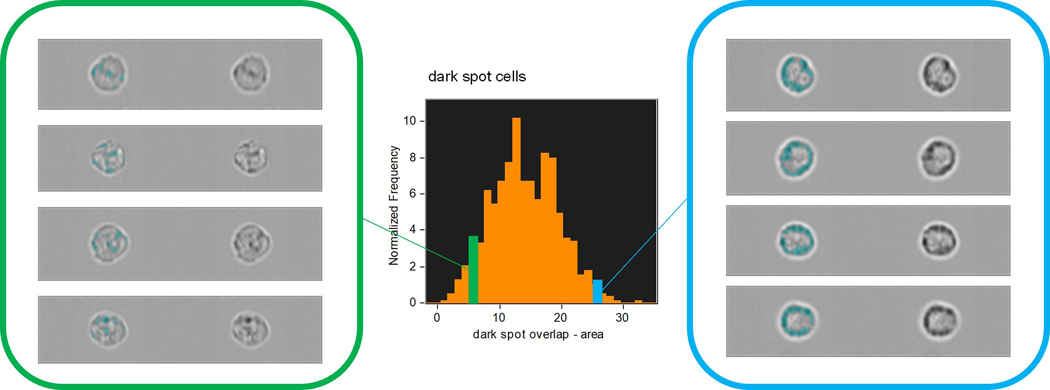
Figure 6:
Differentiation of cell populations with membrane-associated or dispersed granules, according to mask area.
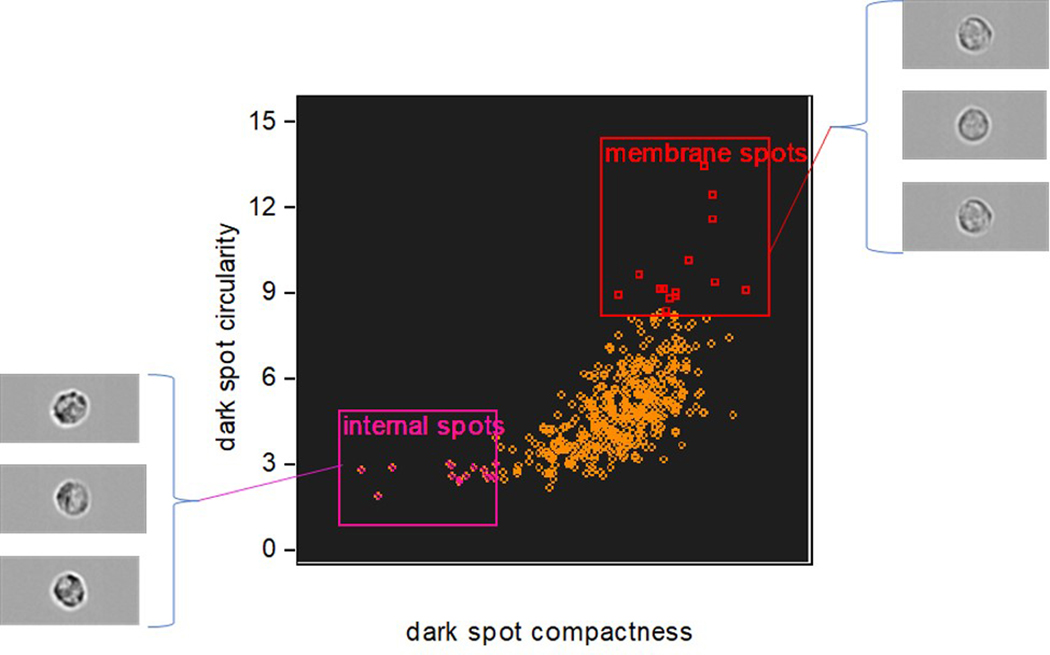
Figure 7:
Differentiation of cell populations with membrane-associated or dispersed granules, according to the morphology of their spatial distribution.
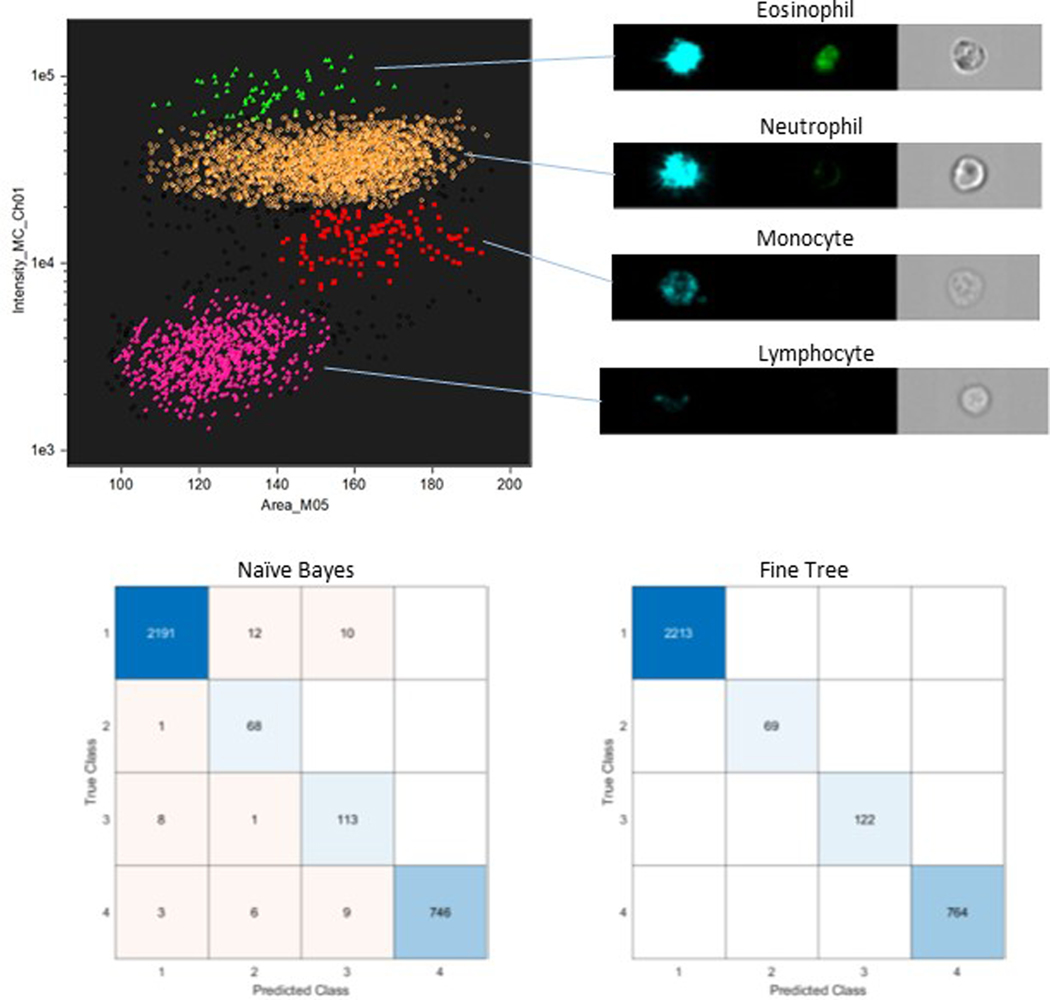
Figure 8:
Machine learning approaches to white blood cell classification.
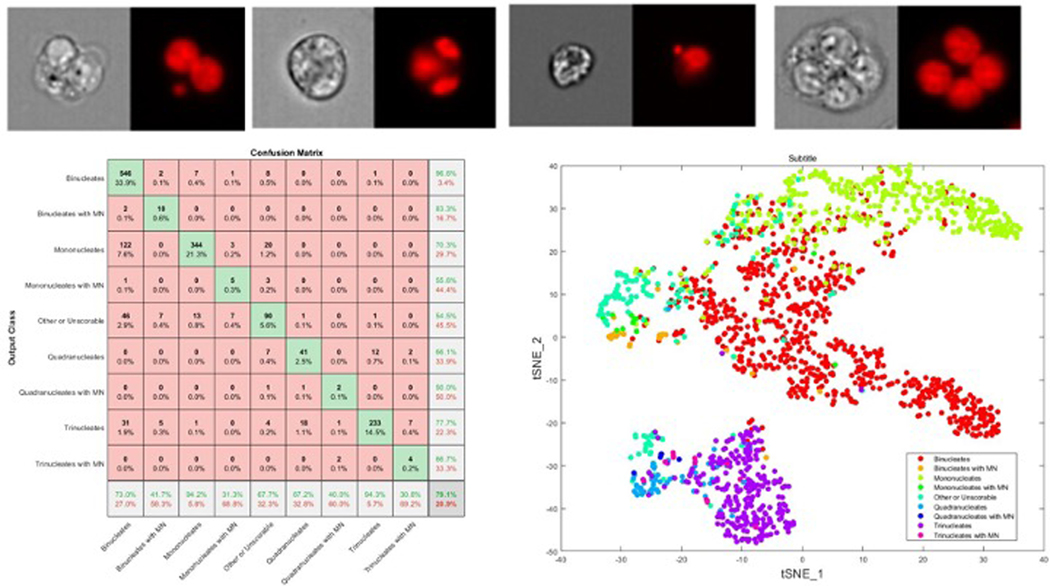
Figure 9:
Application of deep learning to classification of micronuclei events in TK6 cells. Typical images of (a) binucleated cell with micronuclei, (b) trinuclated cell, (c) mononuclear cell with micronucleus...
Figure images are served from the NIH/NLM PubMed Central Open Access Subset or Europe PMC; copyright remains with the publishers and authors.
💬 Discussion
0 commentsNo comments yet. Be the first to start a discussion!
Leave a Comment