Abstract
We describe a new method for imaging leukocytes in vivo by exciting the endogenous protein fluorescence in the ultraviolet (UV) spectral region where tryptophan is the major fluorophore. Two-photon excitation near 590 nm allows noninvasive optical sectioning through the epidermal cell layers into the dermis of mouse skin, where leukocytes can be observed by video-rate microscopy to interact dynamically with the dermal vascular endothelium. Inflammation significantly enhances leukocyte rolling, adhesion, and tissue infiltration. After exiting the vasculature, leukocytes continue to move actively in tissue as observed by time-lapse microscopy, and are distinguishable from resident autofluorescent cells that are not motile. Because the new method alleviates the need to introduce exogenous labels, it is potentially applicable for tracking leukocytes and monitoring inflammatory cellular reactions in humans.
🔬 Techniques
✨ Fluorophores
🏭 Microscope Brands
🔴 Lasers
📷 Detectors
🎨 Filters
💻 Software Details
🏛️ Research Organizations (ROR)
Affiliated research institutions:
📋 Methods
Laser source
The schematic drawing of our two-photon microscope is shown in Fig. 1 Fig. 1 Schematic drawing of the video-rate nonlinear optical microscope . To generate femtosecond laser pulses at 590 nm for two-photon excitation of tryptophan, a mode-locked Ti:sapphire laser (Maitai-HP, wavelength 750 nm, 100 fs pulse width, 80 MHz repetition rate, Spectra-Physics, Santa Clara, CA) is used for pumping an optical parametric oscillator (OPAL, wavelength 1180 nm, 100 fs pulse width, Spectra-Physics, Santa Clara, CA). The output of the OPAL (350 mW at 1180 nm) is focused into a β-barium borate crystal (BBO 2 mm thick, CASIX USA, San Jose, CA) to generate 590 nm wavelength pulses with 60 mW power.
Microscope setup
The laser beam exiting the β-BBO crystal is collimated and deflected into a home-built video-rate (30 frames/second) x-y scanner (polygon, galvanometer). The beam passes through a dichroic beam splitter (FF510-Di01, Semrock, Rochester, NY) and is then focused onto the sample with a 60× , N.A.=1.2, water-immersion microscope objective lens (UPlanAPO, Olympus USA, Center Valley, PA). The laser power at the sample site is 10 mW. The fluorescence signal from the sample is epi-collected, deflected with the 510 nm long-pass dichroic mirror, transmitted through a 330-380 nm band-pass filter (FF01-357/44, Semrock, Rochester, NY). For comparison we also performed MPM imaging using NADH as the excited fluorophore. In the setup, the excitation light is provided directly by the Ti/sapphire laser (730nm) and the detection filter is a 420-480 nm bandpass filter (FF01-450/60, Semrock, Rochester, NY). The excitation power at sample is 20mW. Second harmonic generation microscopy is performed with the same setup except replacing the detection filter with a 330-380 nm band-pass filter (FF01-357/44, Semrock, Rochester, NY). We also performed MPM imaging FITC-dextran in BALB/c mice (Jackson Laboratory, Bar Harbor, ME). Again the excitation light is provided directly by the Ti/sapphire laser (970nm), while the dichroic beamsplitter is now a 665nm long pass one (FF665-Di02, Semrock, Rochester, NY) and the detection filter is a 505-555 nm bandpass filter (BP530/50, Chroma, Bellows Falls, VT). The fluorescent signal is detected by a photomultiplier tube (PMT) (R3896, Hamamatsu, Bridgewater, NJ) and the two-dimensional images in x-y plane are acquired by a frame grabber (Snapper-8/24 PCI, Active Silicon, Chelmsfor, MA) installed on a Macintosh personal computer. Each frame has 500×500 pixels. The imaging speed is 30 frames/sec and each static image is an average of 30 frames. Details of this microscope setup could be found in reference [ 20 ].
Show full methods section
Laser source
The schematic drawing of our two-photon microscope is shown in Fig. 1 Fig. 1 Schematic drawing of the video-rate nonlinear optical microscope . To generate femtosecond laser pulses at 590 nm for two-photon excitation of tryptophan, a mode-locked Ti:sapphire laser (Maitai-HP, wavelength 750 nm, 100 fs pulse width, 80 MHz repetition rate, Spectra-Physics, Santa Clara, CA) is used for pumping an optical parametric oscillator (OPAL, wavelength 1180 nm, 100 fs pulse width, Spectra-Physics, Santa Clara, CA). The output of the OPAL (350 mW at 1180 nm) is focused into a β-barium borate crystal (BBO 2 mm thick, CASIX USA, San Jose, CA) to generate 590 nm wavelength pulses with 60 mW power.
Microscope setup
The laser beam exiting the β-BBO crystal is collimated and deflected into a home-built video-rate (30 frames/second) x-y scanner (polygon, galvanometer). The beam passes through a dichroic beam splitter (FF510-Di01, Semrock, Rochester, NY) and is then focused onto the sample with a 60× , N.A.=1.2, water-immersion microscope objective lens (UPlanAPO, Olympus USA, Center Valley, PA). The laser power at the sample site is 10 mW. The fluorescence signal from the sample is epi-collected, deflected with the 510 nm long-pass dichroic mirror, transmitted through a 330-380 nm band-pass filter (FF01-357/44, Semrock, Rochester, NY). For comparison we also performed MPM imaging using NADH as the excited fluorophore. In the setup, the excitation light is provided directly by the Ti/sapphire laser (730nm) and the detection filter is a 420-480 nm bandpass filter (FF01-450/60, Semrock, Rochester, NY). The excitation power at sample is 20mW. Second harmonic generation microscopy is performed with the same setup except replacing the detection filter with a 330-380 nm band-pass filter (FF01-357/44, Semrock, Rochester, NY). We also performed MPM imaging FITC-dextran in BALB/c mice (Jackson Laboratory, Bar Harbor, ME). Again the excitation light is provided directly by the Ti/sapphire laser (970nm), while the dichroic beamsplitter is now a 665nm long pass one (FF665-Di02, Semrock, Rochester, NY) and the detection filter is a 505-555 nm bandpass filter (BP530/50, Chroma, Bellows Falls, VT). The fluorescent signal is detected by a photomultiplier tube (PMT) (R3896, Hamamatsu, Bridgewater, NJ) and the two-dimensional images in x-y plane are acquired by a frame grabber (Snapper-8/24 PCI, Active Silicon, Chelmsfor, MA) installed on a Macintosh personal computer. Each frame has 500×500 pixels. The imaging speed is 30 frames/sec and each static image is an average of 30 frames. Details of this microscope setup could be found in reference [ 20 ].
Preparation of cell samples Erythrocytes
(RBCs) and leukocytes (WBCs) were obtained from whole blood of healthy BALB/c mice. Leukocyte subpopulations (mononuclear cells and granulocytes) were isolated by Ficoll-Histopaque density gradient centrifugation. Cells were suspended in phosphate-buffered saline and imaged on glass slides.
Spectrum measurement
While measuring the two-photon excitation spectrum of tryptophan, we used cultured multiple myeloma cells (MM.1s, malignant B lymphocytes) supplied by Dr. Irene Ghobrial from Dana-Farber Cancer Institute, Harvard Medical School. The excitation power at the sample was kept at 2mW in the wavelength range of 570-600 nm and at 5mW in the wavelength range of 600-625 nm, respectively. The detection setup, e.g. PMT voltage, was unchanged. The fluorescence intensity of one single cell was quantified at 570-600 nm and 600-625 nm respectively. Each spectral region was normalized to the measurement at 600 nm in the corresponding scan. Then the two spectra were plotted together to make the full spectrum.
Animal experiments
For the animal imaging, BALB/c and C57BL/6 mice were imaged following administration of ketamine (100mg/Kg) and xylazine (15mg/Kg) anesthesia mixture. The mice were placed in a temperature controlled tube and the ear skin was flattened on a glass slide using Methocel gel 2%. Inflammation was induced by subcutaneous injection of 5µg lipopolysaccharide (LPS) locally in the BALB/c mouse ear pinna. UV exposure The UV-induced inflammation experiment was carried out on 8–10-week-old female C57BL/6 mice (Charles River Laboratories Inc, Wilmington, MA). UV radiation was provided by an UV-B Phototherapy Dermalight 80 device (Dr. Hoenle Medizintechnik, Germany), which contains two UV-emitting tubes (TL4W12, Philips, Einhoven, Netherlands). The irradiance was determined with a temperature- and wavelength-controlled Optronic 742 double-holographic grating spectroradiometer having a Teflon diffuser as input optics at 1 nm intervals from 250 to 400 nm. The average irradiance of the UV-B (280-320 nm) was 8.10 W/m 2 and of UV-A (320-400 nm) 5.9 W/m 2 . Hair on the ears was shaven off 24 h before irradiation to allow UV irradiation reach of skin. Anesthetized C57BL/6 mice were exposed on one ear pinna with a single dose of UV radiation, consisting of 500 mJ/cm 2 UV-B radiation and 358 mJ/cm 2 UV-A radiation, corresponding 10 minutes irradiation time. The ear pinna was imaged for 3 hours afterwards. All procedures were approved by the Subcommittee on Research Animal Care of Massachusetts General Hospital (Protocol # 2006N000058 and 2009N000137). Movie processing Media 1 and Media 2 are movies recorded at video-rate (30 frames/second). Then we did moving-average (3 frames/window) to reduce the speckle noise. Media 3 is a stack of 60 tryptophan fluorescence images with continuously increasing depth into mouse skin (1 µm/step). Each image is an average of 30 frames recorded at video-rate (30 frames/second). Each frame in media 4 was a static image. This static image is a 2D average projection of a stack of 20 z-dimensional images (1 µm/step). All the movie processing was done with ImageJ ( http://rsbweb.nih.gov/ij/ ).
📊 Figures
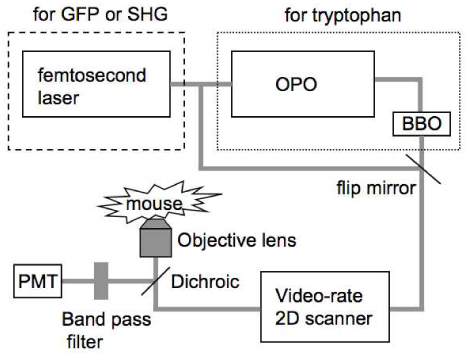
Fig. 1
Schematic drawing of the video-rate nonlinear optical microscope
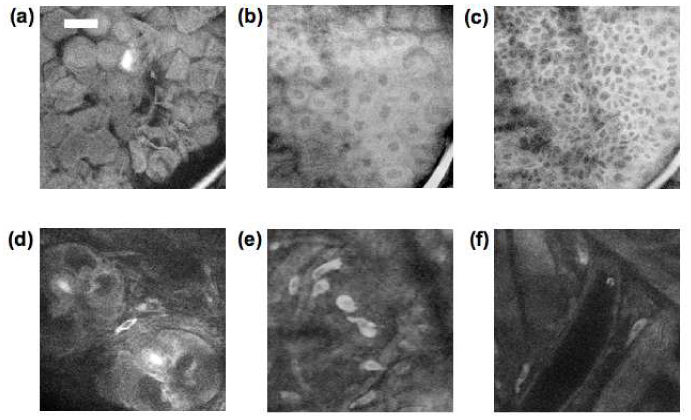
Fig. 2
Tryptophan fluorescence images at a depth of 0, 5, 15, 30, 30, and 70 um (a-f) beneath the surface of mouse ear skin showing (a) corneocytes, (b) stratum spinosum, (c) basal cell layer, (d) hair folli...
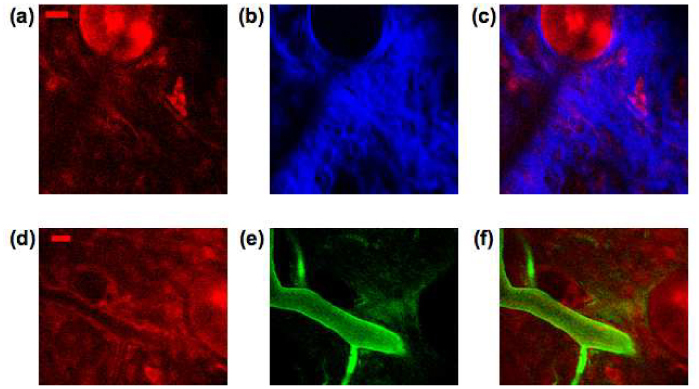
Fig. 3
(a-c) Tryptophan fluorescence image (a), second harmonic generation image (b) and merged image (c) (red: tryptophan, blue: SHG. scale bar 20 u00b5m). (d-f) Blood vessels at a depth of 50 u00b5m visual...
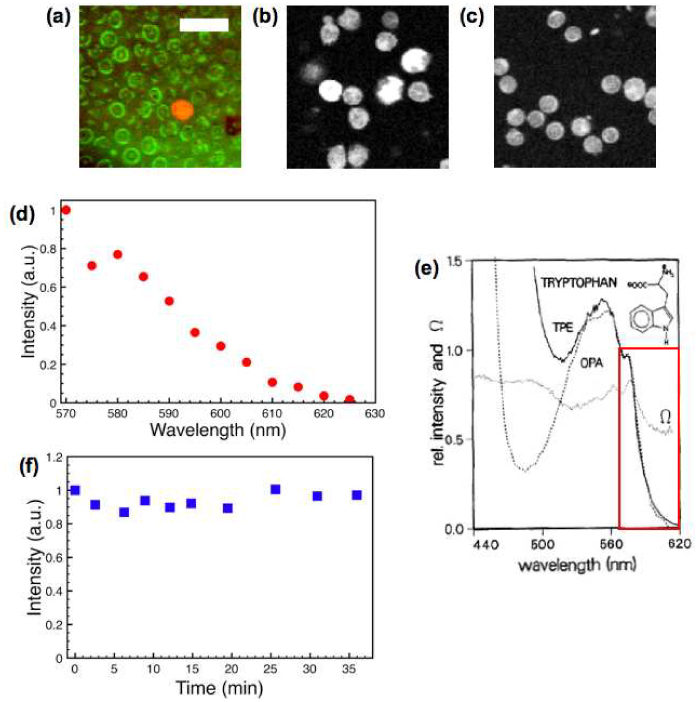
Fig. 4
Tryptophan fluorescence images of leukocytes. (a) Confocal reflectance (green) and tryptophan fluorescence (red) images of mouse blood smear, (b) Tryptophan fluorescence image of isolated granulocytes...
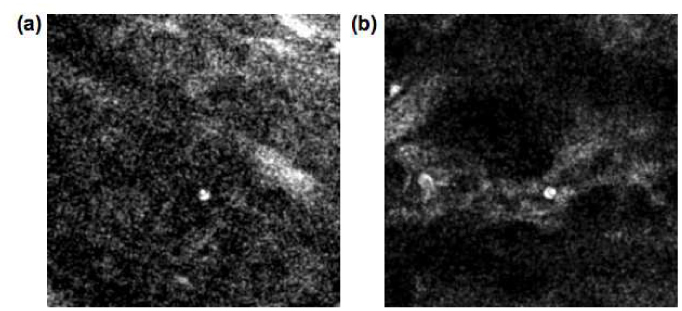
Fig. 5
Single-frame excerpts from video recordings of leukocyte trafficking in skin vasculature. (a) Rolling leukocyte in normal BALB/c mouse skin ( Media 1 ). (b) Slow rolling and arrest of leukocyte in inf...
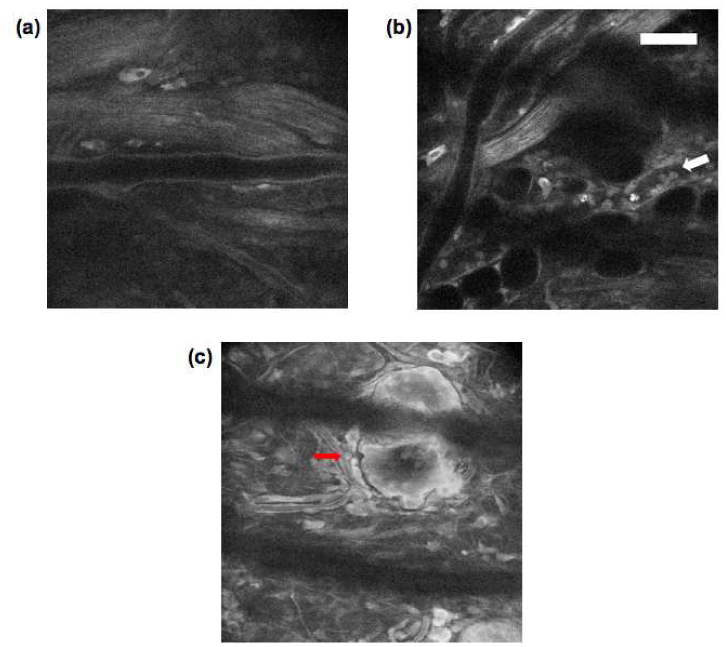
Fig. 6
(a-c) Tryptophan fluorescence images of BALB/c mouse ear (a) 0-h, and (b & c) 24-h post LPS injection (scale bar 50 u00b5m).
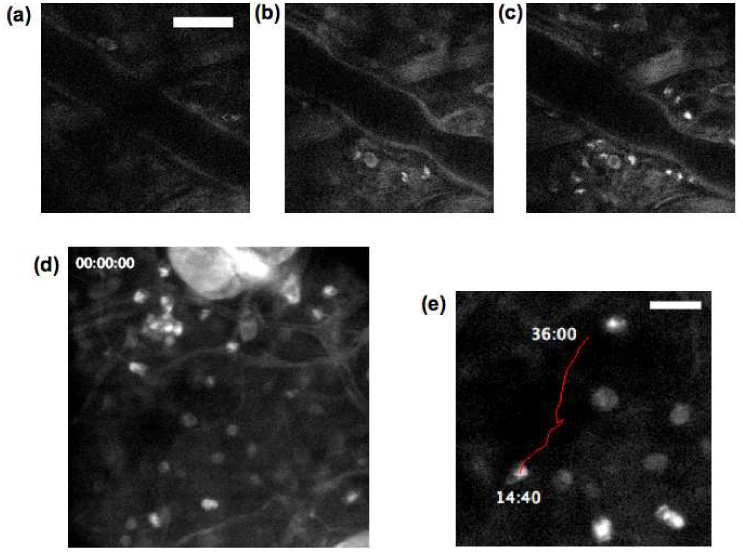
Fig. 7
(a-c) Tryptophan fluorescence images of C57BL/6 mouse ear at (a) 10 mins, (b) 60 mins, and (c) 120 mins post UV exposure (scale bar 50 u00b5m). (d) Single-frame excerpts from video recordings of leuko...
Figure images are served from the NIH/NLM PubMed Central Open Access Subset or Europe PMC; copyright remains with the publishers and authors.
💬 Discussion
0 commentsNo comments yet. Be the first to start a discussion!
Leave a Comment