Abstract
Piezo1 ion channels are activated by mechanical stimuli and mediate the sensing of blood flow. Although cryo-electron microscopy (cryo-EM) structures have revealed the overall architecture of Piezo1, the precise domains involved in activation and subsequent inactivation have remained elusive. Here, we perform a targeted chimeric screen between Piezo1 and the closely related isoform Piezo2 and use electrophysiology to characterize their inactivation kinetics during mechanical stimulation. We identify three small subdomains within the extracellular cap that individually can confer the distinct kinetics of inactivation of Piezo2 onto Piezo1. We further show by cysteine crosslinking that conformational flexibility of these subdomains is required for mechanical activation to occur and that electrostatic interactions functionally couple the cap to the extensive blades, which have been proposed to function as sensors of membrane curvature and tension. This study provides a demonstration of internal gating motions involved in mechanotransduction by Piezo1.
🔬 Techniques
🧬 Organisms
✨ Fluorophores
🧪 Sample Preparation
🔬 Cell Lines
🏭 Microscope Brands
🧪 Reagent Suppliers
💻 Software Details
💾 Data Repositories
🏛️ Research Organizations (ROR)
Affiliated research institutions:
📋 Methods
LEAD CONTACT AND MATERIALS AVAILABILITY
Further information and requests for resources and reagents should be directed to and will be fulfilled by the Lead Contact Jörg Grandl ( grandl@neuro.duke.edu ). This study did not generate new unique reagents.
EXPERIMENTAL MODEL AND SUBJECT DETAILS Cell Lines HEK293t-P1Ko cells
(Piezo1 knockout human embryonic kidney cells; ( Dubin et al., 2017 )), a gift of Ardem Patapoutian, were cultured at 37°C and 5% CO 2 in DMEM-HG (Life Technologies) supplemented with 10% FBS (Clontech), 50 U/mL penicillin, and 50 mg/mL streptomycin (Life Technologies). The cell line was not authenticated. METHOD DETAILS Cloning and Cell Culture Mouse Piezo1-pIRES-EGFP in pcDNA3.1(+) was obtained from Ardem Patapoutian and previously described ( Coste et al., 2012 ). Mouse Piezo2 was synthesized to be codon optimized for expression in human cells by Genewiz and ligated into pcDNA3.1(+) between restriction sites Kpn1 and Not1 ( Lewis et al., 2017 ). Piezo1-Piezo2 chimeras were created using the Q5 Site-Directed Mutagenesis kit (New England Biosciences) following the manufacturer’s protocol for large insertions using non-overlapping primers. Point-mutations in Piezo1 were created using the Quikchange Lightning Multi Site-Directed Mutagenesis kit (Agilent Technologies). All constructs were sequence-verified (Genewiz). 40–48 hours before recording, cells were transiently transfected in 6-well plates (Piezo1 and Piezo1-based constructs: 3 μg; Piezo2 and Piezo2-based constructs: 2.5 μg + 0.5 μg GFP) with Fugene 6 (Promega) according to the manufacturer’s protocol in the presence of 10 μM ruthenium red. Transfected cells were reseeded from 6-well plates onto poly-L-lysine and laminin-coated coverslips 18–24 hours before recording.
Show full methods section
LEAD CONTACT AND MATERIALS AVAILABILITY
Further information and requests for resources and reagents should be directed to and will be fulfilled by the Lead Contact Jörg Grandl ( grandl@neuro.duke.edu ). This study did not generate new unique reagents.
EXPERIMENTAL MODEL AND SUBJECT DETAILS Cell Lines HEK293t-P1Ko cells
(Piezo1 knockout human embryonic kidney cells; ( Dubin et al., 2017 )), a gift of Ardem Patapoutian, were cultured at 37°C and 5% CO 2 in DMEM-HG (Life Technologies) supplemented with 10% FBS (Clontech), 50 U/mL penicillin, and 50 mg/mL streptomycin (Life Technologies). The cell line was not authenticated. METHOD DETAILS Cloning and Cell Culture Mouse Piezo1-pIRES-EGFP in pcDNA3.1(+) was obtained from Ardem Patapoutian and previously described ( Coste et al., 2012 ). Mouse Piezo2 was synthesized to be codon optimized for expression in human cells by Genewiz and ligated into pcDNA3.1(+) between restriction sites Kpn1 and Not1 ( Lewis et al., 2017 ). Piezo1-Piezo2 chimeras were created using the Q5 Site-Directed Mutagenesis kit (New England Biosciences) following the manufacturer’s protocol for large insertions using non-overlapping primers. Point-mutations in Piezo1 were created using the Quikchange Lightning Multi Site-Directed Mutagenesis kit (Agilent Technologies). All constructs were sequence-verified (Genewiz). 40–48 hours before recording, cells were transiently transfected in 6-well plates (Piezo1 and Piezo1-based constructs: 3 μg; Piezo2 and Piezo2-based constructs: 2.5 μg + 0.5 μg GFP) with Fugene 6 (Promega) according to the manufacturer’s protocol in the presence of 10 μM ruthenium red. Transfected cells were reseeded from 6-well plates onto poly-L-lysine and laminin-coated coverslips 18–24 hours before recording.
Electrophysiology
Electrophysiological recordings were performed at room temperature using an EPC10 amplifier and Patchmaster software (HEKA Elektronik, Lambrecht, Germany). Data were sampled at 5 kHz (cell-attached) or 10 kHz (whole-cell) and filtered at 2.9 kHz. For whole-cell experiments, borosilicate glass pipettes (1.5 OD, 0.85 ID; Sutter Instrument Company, Novato, CA) had a resistance of 2–5 MΩ when filled with pipette buffer solution (in mM: 133 CsCl, 10 HEPES, 5 EGTA, 1 MgCl 2 , 1 CaCl 2 , 4 MgATP, 0.4 Na 2 GTP, pH 7.3 with CsOH. Internal solution was allowed to dialyze for at least five minutes before recording to promote GTP-mediated run-up of currents ( Jia et al., 2013 ). Series resistance was compensated by 40%–70%. The control bath solution for all whole-cell experiments was (in mM) 130 NaCl, 3 KCl, 1 MgCl 2 , 10 HEPES, 2.5 CaCl 2 , 10 glucose (pH 7.3 with NaOH). For crosslinking experiments, cells were perfused by placing custom-built pipes made from silica tubing (ID: 320 μm; Trajan Scientific) within ~100 μm of the cell and solution was allowed to flow via gravity (~0.5 mL/min). Fresh solutions of 10 mM dithiothreitol (DTT) or 10 mM hydrogen peroxide (H 2 O 2 ) were prepared from frozen stocks every hour and kept on ice. For crosslinking experiments, all cells were initially patched and stimulus intensity was chosen in the presence of DTT. Voltages were not corrected for a liquid junction potential. For cell-attached experiments, pipettes had a resistance of 1.5–4 MΩ when filled with pipette buffer solution (in mM: 130 NaCl, 5 KCl, 10 HEPES, 10 TEACl, 1 CaCl 2 , 1 MgCl 2 , pH 7.3 with NaOH). The cell-attached bath solution used to zero the membrane potential was (in mM): 140 KCl, 10 HEPES, 1 MgCl 2 , 10 glucose, pH 7.3 with KOH. Patches were held at −80 mV except where described otherwise.
Mechanical Stimulation
In cell-attached patches, negative pressure was applied through the patch pipette with an amplifier-controlled high-speed pressure clamp system (HSPC-1; ALA Scientific Instruments, Farmingdale, NY). For whole-cell experiments, cells were indented with a fire-polished glass pipette (tip diameter ~3–5 μm) by an amplifier-controlled piezo-electric driver (E625 LVPZT Controller/Amplifier; Physik Instrumente) operated in closed-loop mode. The probe was initially positioned ~2–4 μm from the cell and advanced at 0.5 μm/ms in 1 μm increments at an 80° angle. The step increment was stopped after eliciting a current of > 200 pA and the last indentation depth maintained for subsequent protocols (mean indentation depth: 6.5 μm, where 0 μm is the last step before touching the cell). For both stimulus paradigms, the intersweep interval was 10 s to allow for recovery from inactivation ( Lewis et al., 2017 ).
QUANTIFICATION AND STATISTICAL ANALYSIS
All data were analyzed using Igor Pro 8.02 (WaveMetrics). Whole-cell electrophysiology recordings were analyzed for cells with a seal resistance of > 500 MΩ and a series resistance of < 12 MΩ. Cells with maximum whole-cell currents less than 200 pA were excluded from the analysis. Baseline currents before mechanical stimulation were subtracted offline. Current amplitudes were quantified as the peak current during the stimulus (with no smoothing). To quantify the effects of DTT on channel function, we further normalized each peak current amplitude to the average of the first four peak current amplitudes in DTT and then calculated the average of four stimulus responses in each condition. Because the peak-to-peak variation due to noise in whole-cell currents was ~25 pA, peak currents in the absence of DTT that were smaller than this value (~5% of a 500 pA peak current in DTT) were indistinguishable from noise, and these constructs were deemed non-functional in the absence of DTT (see Figure S2 ). The time constant of inactivation (τ) was obtained by fitting a single exponential function between the peak current and the stimulus offset (~500 ms): I = I 0 + A * exp (−( t − t 0 )/ τ ) In a subset of cells, steady-state current at positive potentials was decreased by DTT, but this effect was inconsistent (5 of 9 wild-type cells) and we chose not to analyze it further. The time constant of deactivation (τ) was obtained by visually identifying the inflection point in the current (where current transitions from inactivating to deactivating; typically within 2–3 ms following the beginning of the stimulus offset) and fitting a single exponential function (negative potentials; same equation as inactivation) or double exponential function (positive potentials) for 500 ms following the inflection point: I = I 0 + A 1 * e x p − ( t − t 0 ) τ 1 + A 2 * e x p − ( t − t 0 ) τ 2 Single channel amplitudes were measured by performing a Gaussian multi-peak analysis on current amplitude histograms. Slope conductances were fit for each individual cell from single channel amplitudes at −60 mV, −80 mV, and −100 mV (3–5 openings per voltage). For two-pulse recovery experiments, because Piezo current amplitudes occasionally ran up or down during the long duration of the experiment due to GTP-dialysis ( Jia et al., 2013 ), any sweep in which the test pulse amplitude deviated by more than 30% from that of the following sweep was discarded from analysis. All structural figures were prepared using Pymol and Cα-Cα distances were measured using the Pymol distance wizard and PDB: 6B3R ( Guo and MacKinnon, 2017 ). All data are reported as mean ± SEM. Statistical analyses were performed using unpaired Student’s t test. Significance thresholds were set as p < 0.05.
DATA AND CODE AVAILABILITY
The published article includes all datasets generated or analyzed during this study. All data are available from the Lead Contact upon reasonable request.
LEAD CONTACT AND MATERIALS AVAILABILITY
Further information and requests for resources and reagents should be directed to and will be fulfilled by the Lead Contact Jörg Grandl ( grandl@neuro.duke.edu ). This study did not generate new unique reagents.
EXPERIMENTAL MODEL AND SUBJECT DETAILS Cell Lines HEK293t-P1Ko cells
(Piezo1 knockout human embryonic kidney cells; ( Dubin et al., 2017 )), a gift of Ardem Patapoutian, were cultured at 37°C and 5% CO 2 in DMEM-HG (Life Technologies) supplemented with 10% FBS (Clontech), 50 U/mL penicillin, and 50 mg/mL streptomycin (Life Technologies). The cell line was not authenticated.
METHOD DETAILS Cloning and Cell Culture Mouse Piezo1-pIRES-EGFP in pcDNA3.1(+) was obtained from Ardem Patapoutian and previously described ( Coste et al., 2012 ). Mouse Piezo2 was synthesized to be codon optimized for expression in human cells by Genewiz and ligated into pcDNA3.1(+) between restriction sites Kpn1 and Not1 ( Lewis et al., 2017 ). Piezo1-Piezo2 chimeras were created using the Q5 Site-Directed Mutagenesis kit (New England Biosciences) following the manufacturer’s protocol for large insertions using non-overlapping primers. Point-mutations in Piezo1 were created using the Quikchange Lightning Multi Site-Directed Mutagenesis kit (Agilent Technologies). All constructs were sequence-verified (Genewiz). 40–48 hours before recording, cells were transiently transfected in 6-well plates (Piezo1 and Piezo1-based constructs: 3 μg; Piezo2 and Piezo2-based constructs: 2.5 μg + 0.5 μg GFP) with Fugene 6 (Promega) according to the manufacturer’s protocol in the presence of 10 μM ruthenium red. Transfected cells were reseeded from 6-well plates onto poly-L-lysine and laminin-coated coverslips 18–24 hours before recording.
Electrophysiology
Electrophysiological recordings were performed at room temperature using an EPC10 amplifier and Patchmaster software (HEKA Elektronik, Lambrecht, Germany). Data were sampled at 5 kHz (cell-attached) or 10 kHz (whole-cell) and filtered at 2.9 kHz. For whole-cell experiments, borosilicate glass pipettes (1.5 OD, 0.85 ID; Sutter Instrument Company, Novato, CA) had a resistance of 2–5 MΩ when filled with pipette buffer solution (in mM: 133 CsCl, 10 HEPES, 5 EGTA, 1 MgCl 2 , 1 CaCl 2 , 4 MgATP, 0.4 Na 2 GTP, pH 7.3 with CsOH. Internal solution was allowed to dialyze for at least five minutes before recording to promote GTP-mediated run-up of currents ( Jia et al., 2013 ). Series resistance was compensated by 40%–70%. The control bath solution for all whole-cell experiments was (in mM) 130 NaCl, 3 KCl, 1 MgCl 2 , 10 HEPES, 2.5 CaCl 2 , 10 glucose (pH 7.3 with NaOH). For crosslinking experiments, cells were perfused by placing custom-built pipes made from silica tubing (ID: 320 μm; Trajan Scientific) within ~100 μm of the cell and solution was allowed to flow via gravity (~0.5 mL/min). Fresh solutions of 10 mM dithiothreitol (DTT) or 10 mM hydrogen peroxide (H 2 O 2 ) were prepared from frozen stocks every hour and kept on ice. For crosslinking experiments, all cells were initially patched and stimulus intensity was chosen in the presence of DTT. Voltages were not corrected for a liquid junction potential. For cell-attached experiments, pipettes had a resistance of 1.5–4 MΩ when filled with pipette buffer solution (in mM: 130 NaCl, 5 KCl, 10 HEPES, 10 TEACl, 1 CaCl 2 , 1 MgCl 2 , pH 7.3 with NaOH). The cell-attached bath solution used to zero the membrane potential was (in mM): 140 KCl, 10 HEPES, 1 MgCl 2 , 10 glucose, pH 7.3 with KOH. Patches were held at −80 mV except where described otherwise.
Mechanical Stimulation
In cell-attached patches, negative pressure was applied through the patch pipette with an amplifier-controlled high-speed pressure clamp system (HSPC-1; ALA Scientific Instruments, Farmingdale, NY). For whole-cell experiments, cells were indented with a fire-polished glass pipette (tip diameter ~3–5 μm) by an amplifier-controlled piezo-electric driver (E625 LVPZT Controller/Amplifier; Physik Instrumente) operated in closed-loop mode. The probe was initially positioned ~2–4 μm from the cell and advanced at 0.5 μm/ms in 1 μm increments at an 80° angle. The step increment was stopped after eliciting a current of > 200 pA and the last indentation depth maintained for subsequent protocols (mean indentation depth: 6.5 μm, where 0 μm is the last step before touching the cell). For both stimulus paradigms, the intersweep interval was 10 s to allow for recovery from inactivation ( Lewis et al., 2017 ).
Supplementary Material 1 2
📊 Figures
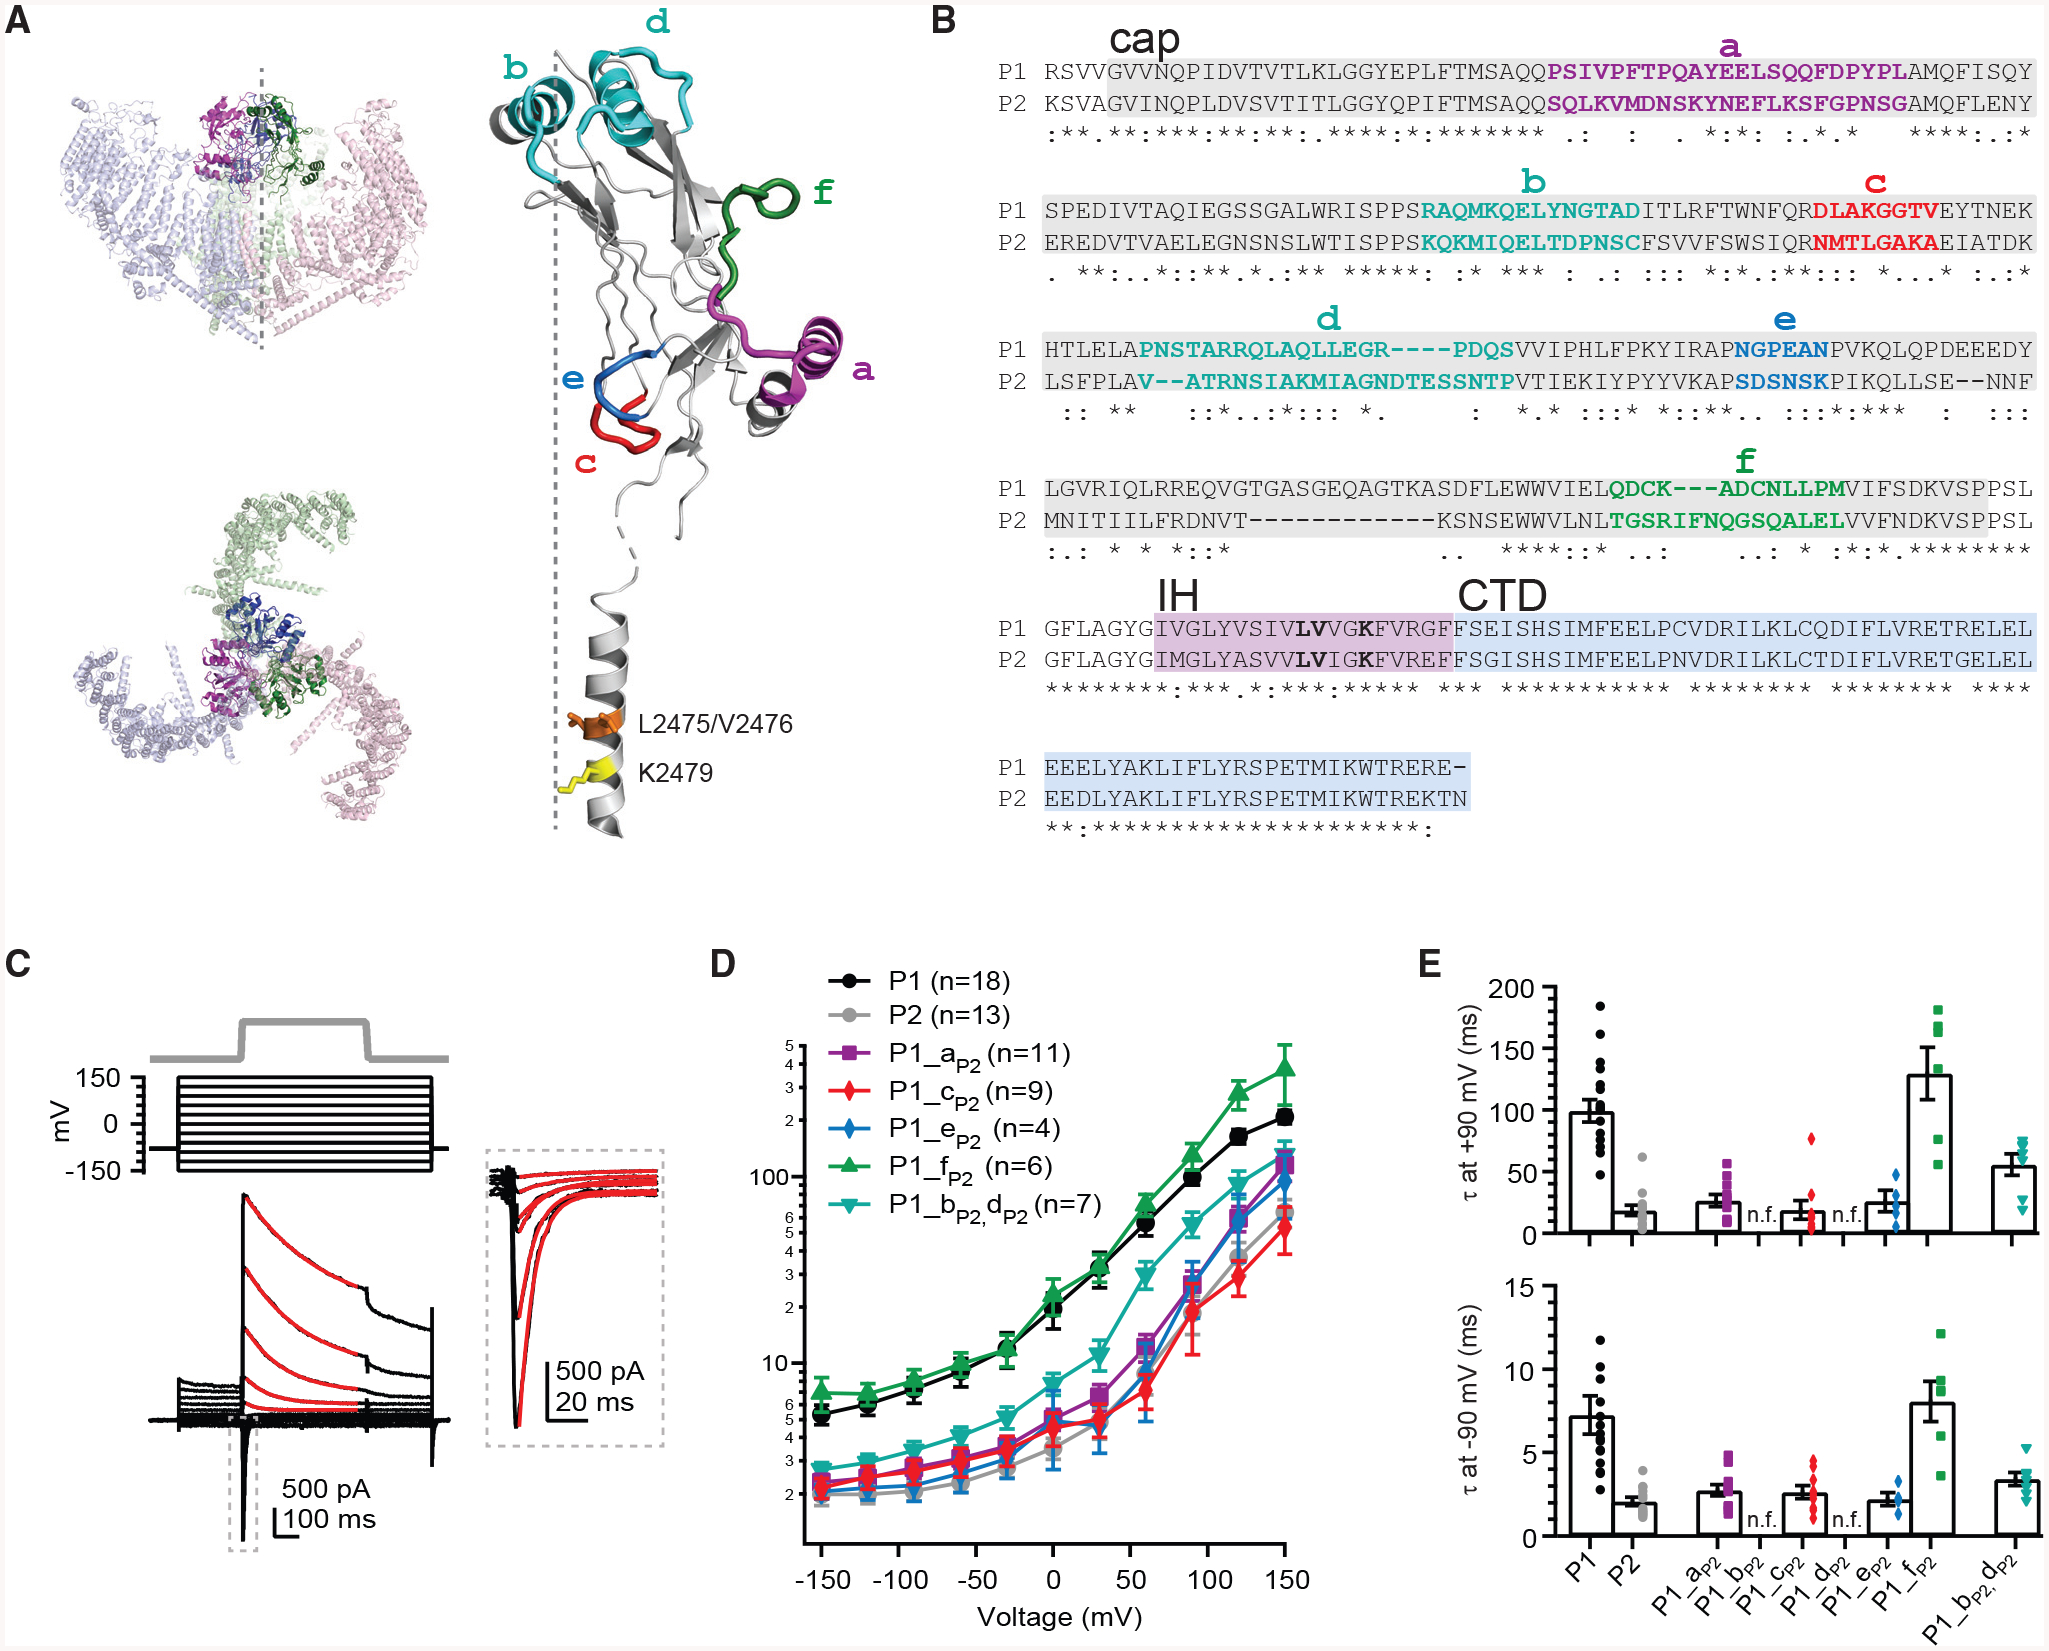
Figure 1.
A Chimeric Screening Strategy Reveals Subdomains of Piezo1 Required for Slow Inactivation Kinetics
(A) Left: structural model of full-length trimeric mouse Piezo1 (PDB: 6B3R) viewed from the side (top) and from the top (bottom). Right: ribbon model of one monomer of the C-terminal extracellular dom...
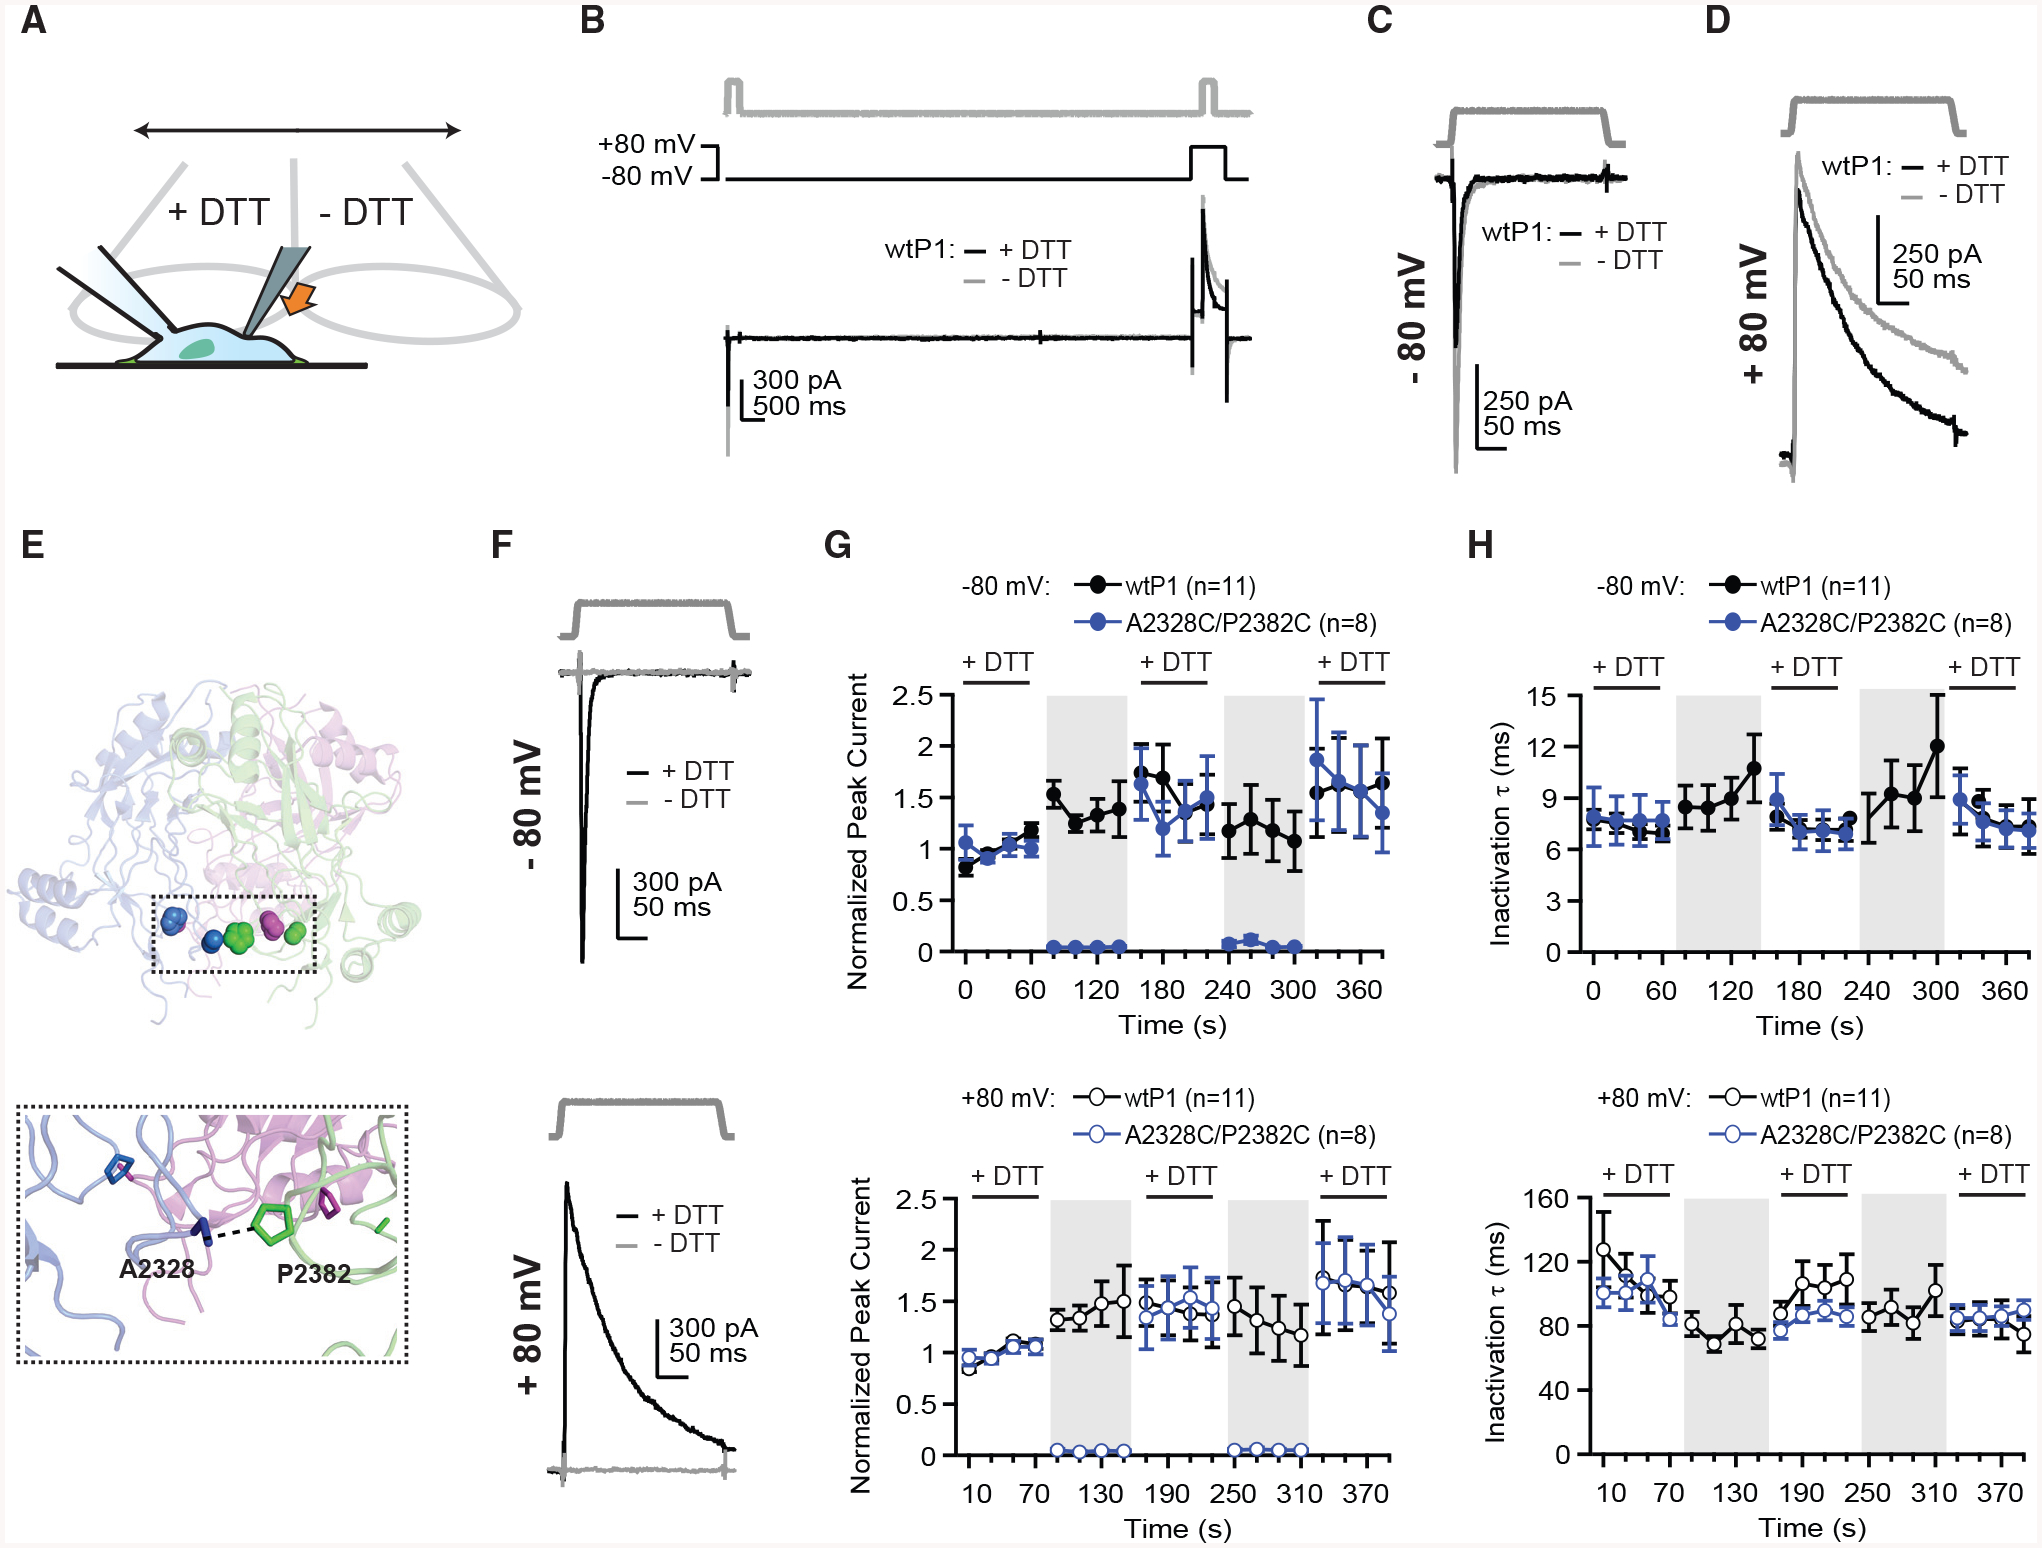
Figure 2.
Cysteine Crosslinking of Two Subdomains at Base of Piezo1 Cap Prohibits Channel Gating
(A) Schematic depicting whole-cell recording setup with mechanical indentation stimulation and gravity perfusion. (B) Indentation stimulus protocol (5 u03bcm, top), voltage protocol (middle), and repr...
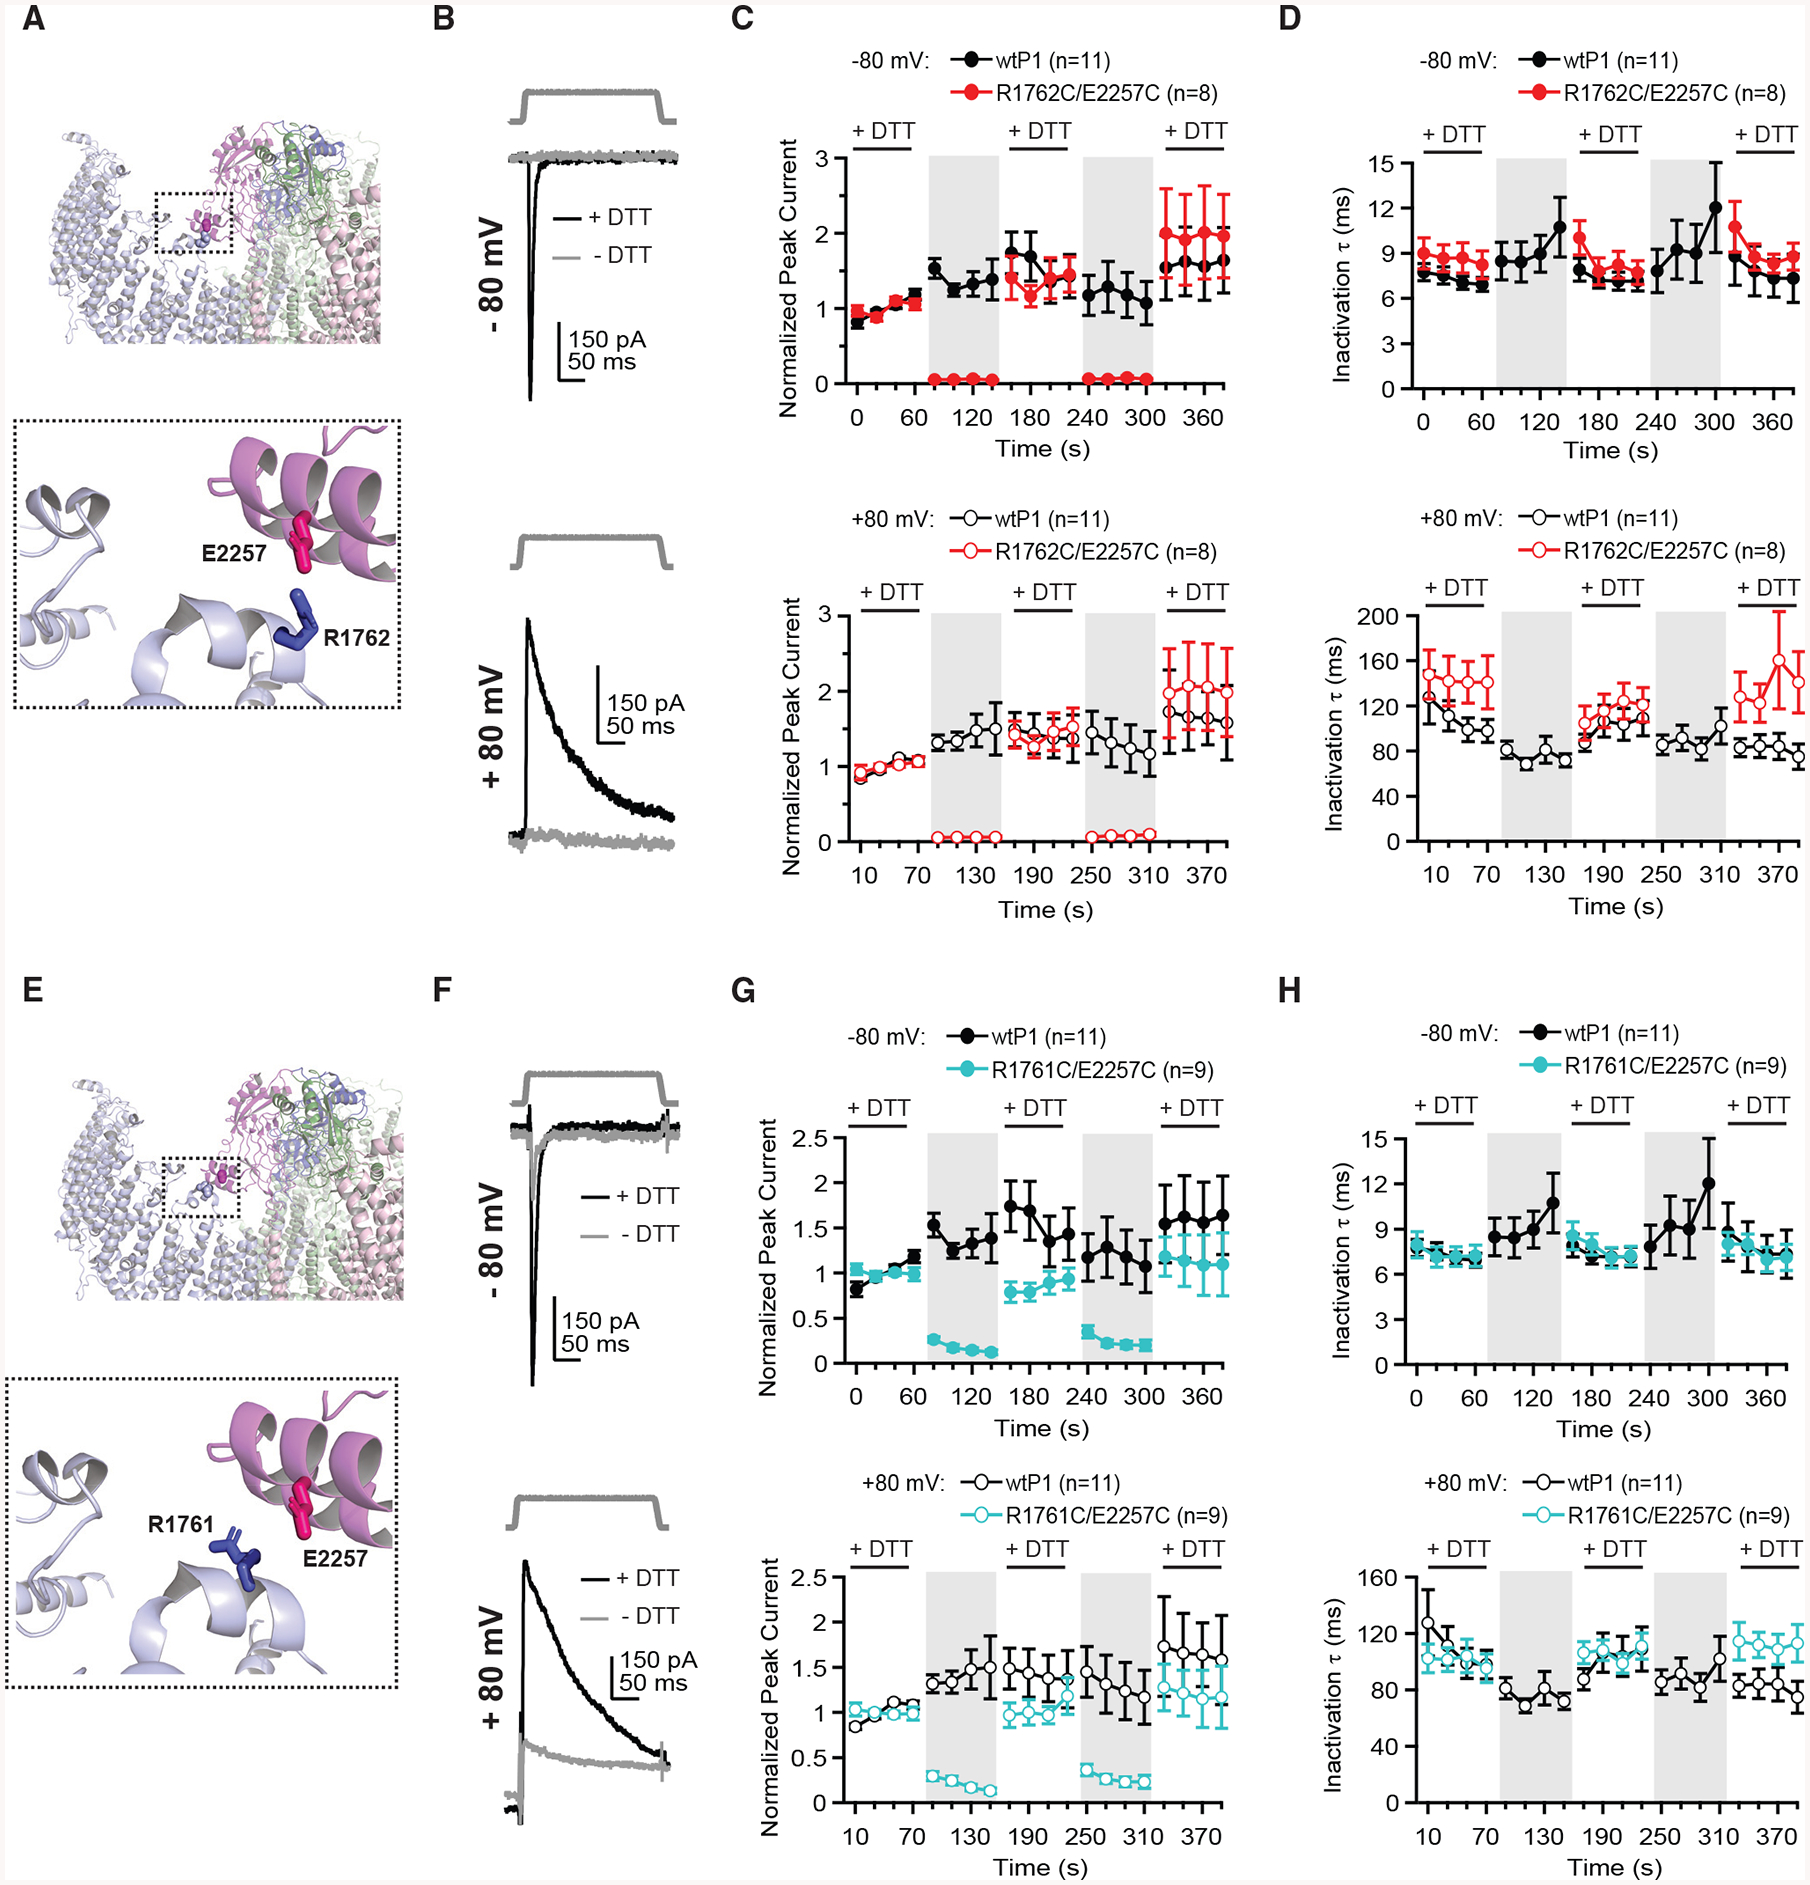
Figure 3.
Cysteine Crosslinking between a Glutamate Residue in the Piezo1 Cap and Two Arginine Residues in the Blade Prevents Channel Opening
(A) Structural model of Piezo1 cap highlighting cysteine pair R1762C and E2257C. Colors indicate three subunits of Piezo1. (B) Indentation stimulus protocol (3 u03bcm) and representative currents from...
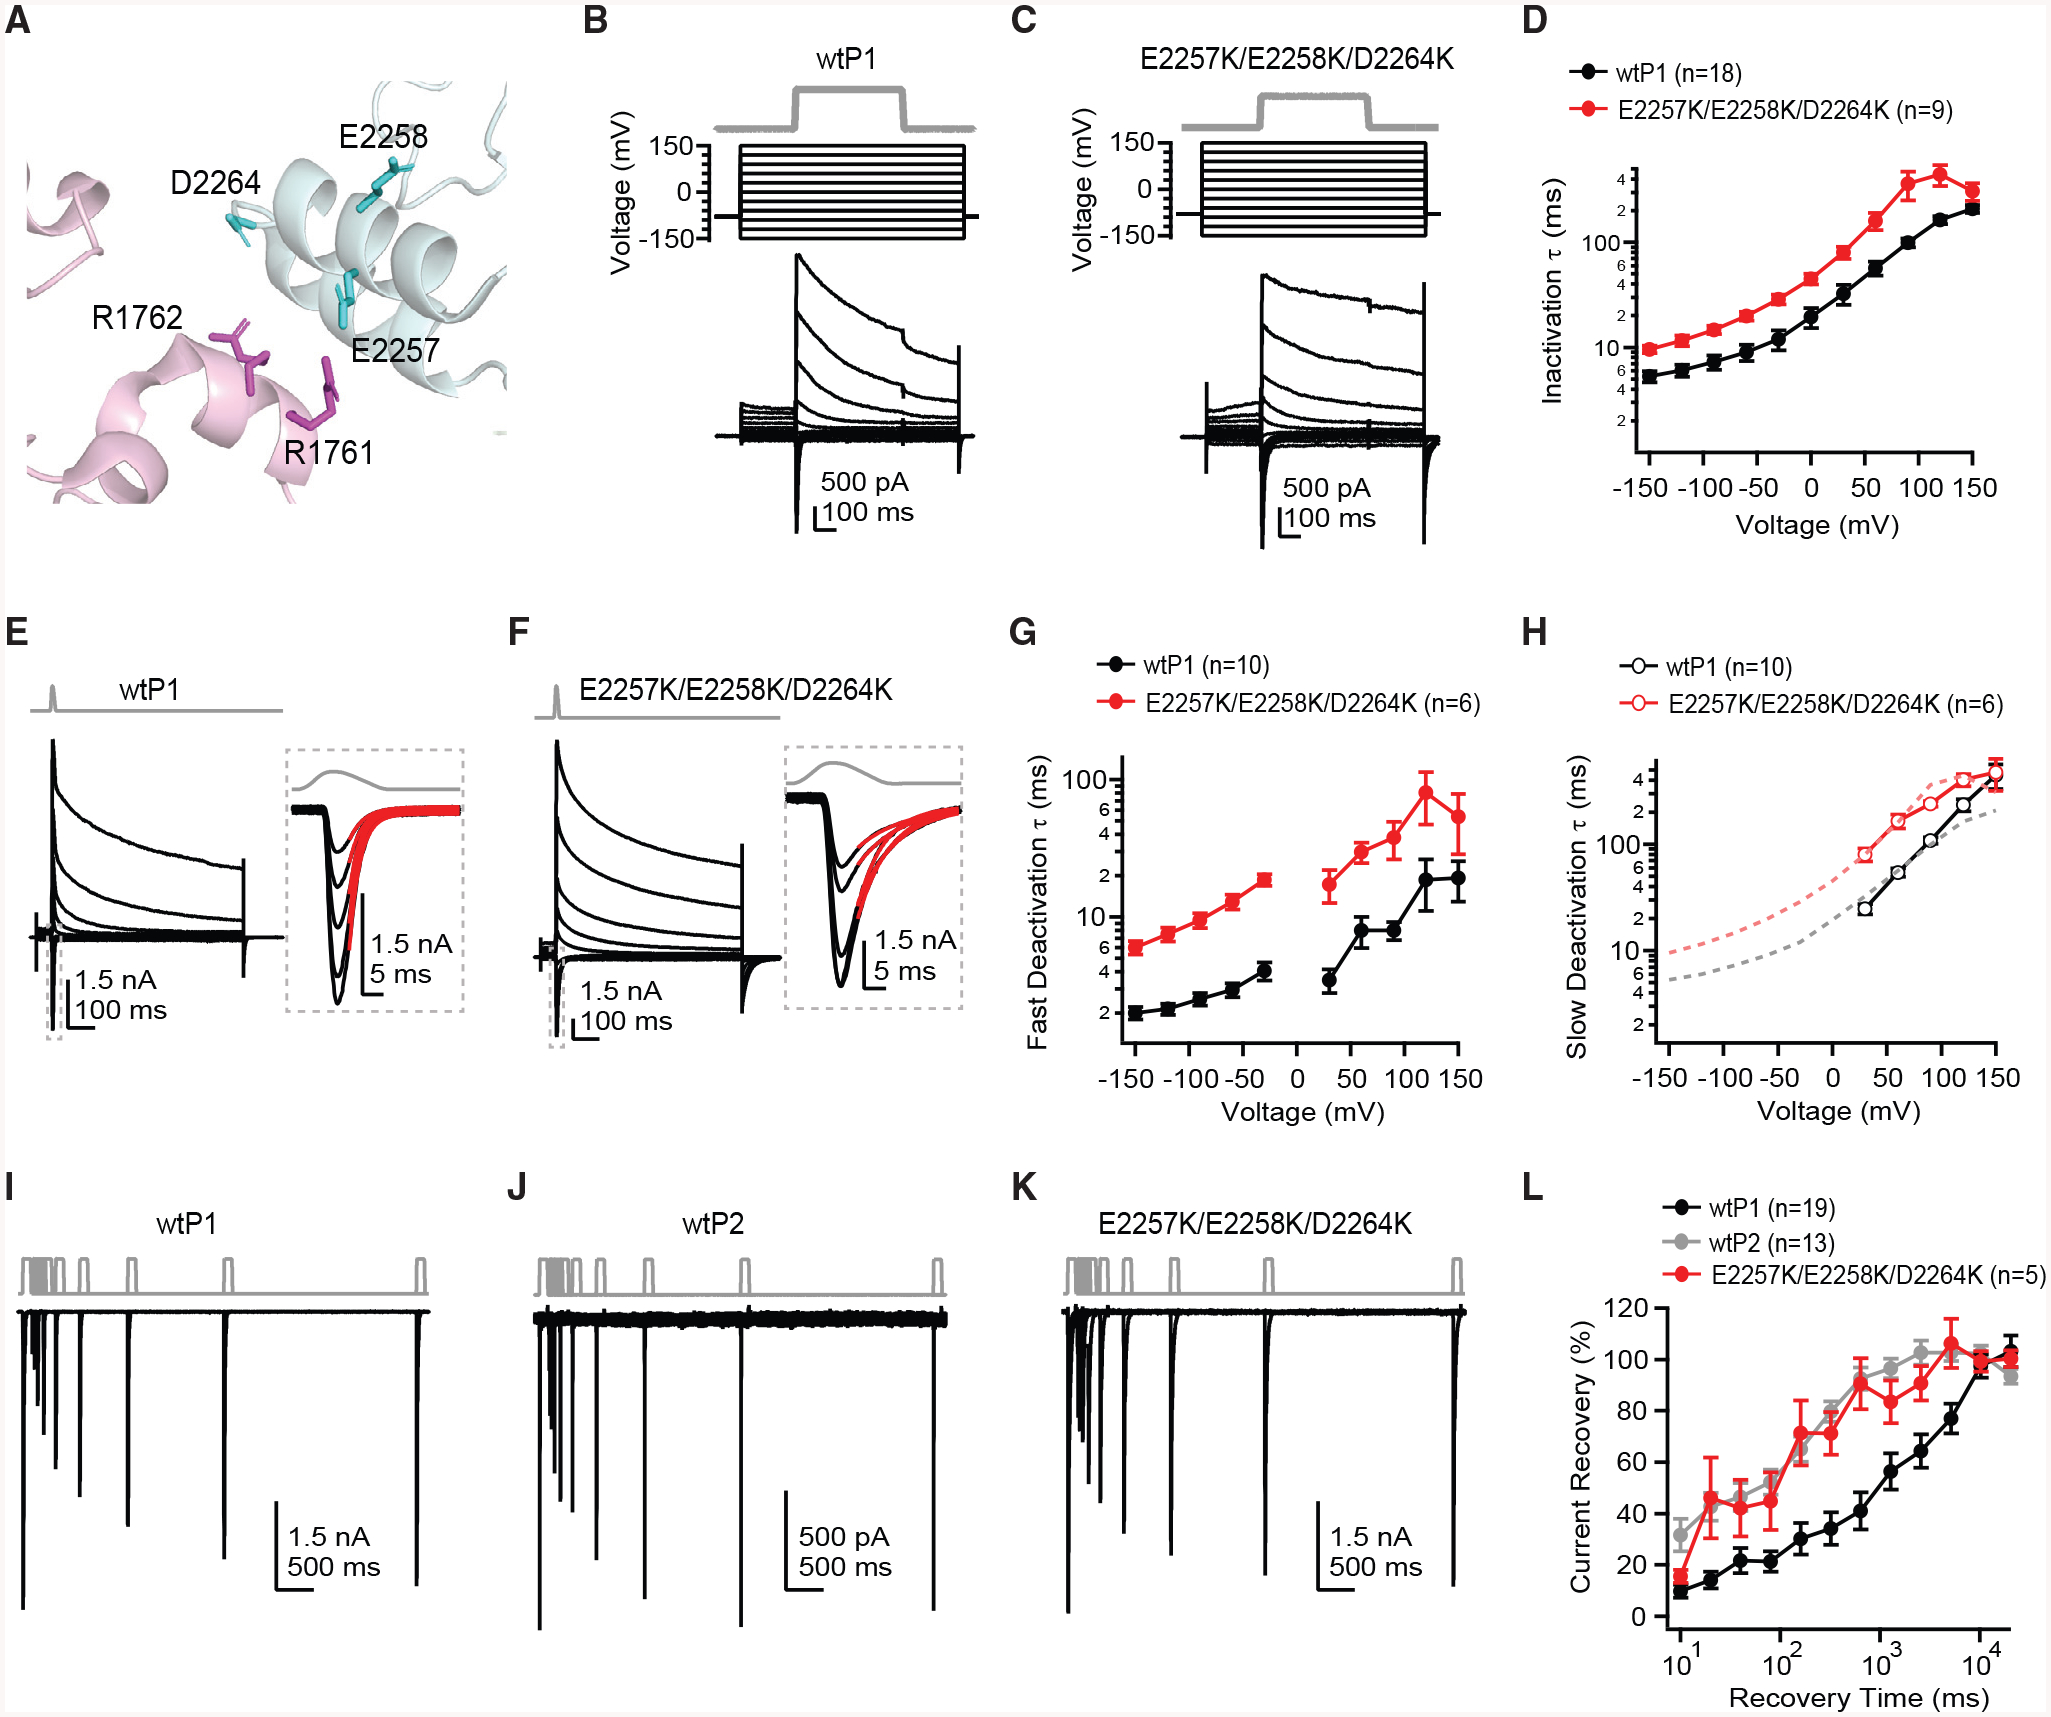
Figure 4.
Disruption of an Electrostatic Interaction between the Blade and Cap of Piezo1 Promotes an Open State
(A) Structural model of Piezo1 (PDB: 6B3R) highlighting the region of a monomer of the blade (pink) and a different monomer of the cap (blue) with predicted salt bridge interactions and interacting re...
Figure images are served from the NIH/NLM PubMed Central Open Access Subset or Europe PMC; copyright remains with the publishers and authors.
💬 Discussion
0 commentsNo comments yet. Be the first to start a discussion!
Leave a Comment