Abstract
Replication stress is a major source of DNA damage and an important driver of cancer development. Replication intermediates that occur upon mild forms of replication stress frequently escape cell cycle checkpoints and can be transmitted through mitosis into the next cell cycle. The consequences of such inherited DNA lesions for cell fate and survival are poorly understood. By using time-lapse microscopy and quantitative image-based cytometry to simultaneously monitor inherited DNA lesions marked by the genome caretaker protein 53BP1 and cell cycle progression, we show that inheritance of 53BP1-marked lesions from the previous S-phase is associated with a prolonged G1 duration in the next cell cycle. These results suggest that cell-to-cell variation in S-phase commitment is determined, at least partially, by the amount of replication-born inherited DNA damage in individual cells. We further show that loss of the tumor suppressor protein p53 overrides replication stress-induced G1 prolongation and allows S-phase entry with excessive amounts of inherited DNA lesions. Thus, replication stress and p53 loss may synergize during cancer development by promoting cell cycle re-entry with unrepaired mutagenic DNA lesions originating from the previous cell cycle.
🔬 Techniques
🔭 Microscopes
✨ Fluorophores
🧪 Sample Preparation
🔬 Cell Lines
🏭 Microscope Brands
🧪 Reagent Suppliers
📷 Detectors
🔎 Objectives
💻 Software Details
💾 Data Repositories
🏛️ Research Organizations (ROR)
Affiliated research institutions:
📋 Methods
Cell culture and replication stress treatments Human U-2 OS, HeLa, and hTERT-RPE1 cells as well as U-2 OS cells stably expressing GFP-53BP1 (a kind gift of Jiri Lukas) or the GFP-Geminin/RFP-CDT1 FUCCI constructs (a kind gift of Hisao Masai) were grown under standard cell culture conditions (humidified atmosphere, 5% CO 2 ) in Dulbecco's modified Eagle's medium (DMEM) containing 10% fetal bovine serum (GIBCO) and penicillin-streptomycin antibiotics. All cell lines were routinely tested for potential mycoplasma contamination and scored negatively. APH (Aphidicolin, Sigma) was used at a final concentration of 0.2 μM unless otherwise noted. ATR inhibitor AZ-20 (Tocris) was used at a final concentration of 1 μM.
S-phase entry assay
S-phase entry was measured as described before. 12 For pulsed EdU (5-ethynyl-2′-desoxyuridine) incorporation, cells were incubated for 30 minutes in medium containing 10 μM EdU (Thermo Fisher Scientific). Click-iT EdU Alexa Fluor Imaging Kit (Thermo Fisher Scientific) was used for EdU detection. BrdU (5-Bromo-2-Deoxyuridine, Sigma) was used at a final concentration of 10 μM and cells were allowed to incorporate BrdU for 7 hours in the presence of 0.25 ug/ml nocodazole (Sigma). Transfections Duplex siRNA transfections were performed for 72 hours with Ambion Silencer Select siRNAs using Lipofectamine RNAiMAX (Thermo Fisher Scientific). Silencer Select siRNA against p53 (s606) was used at a final concentration of 25 nM. Negative control 1 (4390843) from Ambion served as a non-targeting control siRNA (siCon).
Show full methods section
Cell culture and replication stress treatments Human U-2 OS, HeLa, and hTERT-RPE1 cells as well as U-2 OS cells stably expressing GFP-53BP1 (a kind gift of Jiri Lukas) or the GFP-Geminin/RFP-CDT1 FUCCI constructs (a kind gift of Hisao Masai) were grown under standard cell culture conditions (humidified atmosphere, 5% CO 2 ) in Dulbecco's modified Eagle's medium (DMEM) containing 10% fetal bovine serum (GIBCO) and penicillin-streptomycin antibiotics. All cell lines were routinely tested for potential mycoplasma contamination and scored negatively. APH (Aphidicolin, Sigma) was used at a final concentration of 0.2 μM unless otherwise noted. ATR inhibitor AZ-20 (Tocris) was used at a final concentration of 1 μM.
S-phase entry assay
S-phase entry was measured as described before. 12 For pulsed EdU (5-ethynyl-2′-desoxyuridine) incorporation, cells were incubated for 30 minutes in medium containing 10 μM EdU (Thermo Fisher Scientific). Click-iT EdU Alexa Fluor Imaging Kit (Thermo Fisher Scientific) was used for EdU detection. BrdU (5-Bromo-2-Deoxyuridine, Sigma) was used at a final concentration of 10 μM and cells were allowed to incorporate BrdU for 7 hours in the presence of 0.25 ug/ml nocodazole (Sigma). Transfections Duplex siRNA transfections were performed for 72 hours with Ambion Silencer Select siRNAs using Lipofectamine RNAiMAX (Thermo Fisher Scientific). Silencer Select siRNA against p53 (s606) was used at a final concentration of 25 nM. Negative control 1 (4390843) from Ambion served as a non-targeting control siRNA (siCon).
Immunochemical methods
Whole cell extracts were prepared in ice-cold RIPA buffer (50 mM Tris pH 8, 150 mM NaCl, 1% Igepal CA-630, 1% Na-deoxycholic acid, 0.1% SDS) containing 2 mM MgCl 2 and Benzonase (25 units/ml, Novagen) and supplemented with protease and phosphatase inhibitors (Roche). Proteins were resolved by SDS-polyacrylamide gel electrophoresis (SDS-PAGE) and transferred onto polyvinylidene fluoride (PVDF) membranes. Membranes were blocked with PBS-Tween20 (0.01%) containing 5% milk powder for 1 hour at room temperature. Primary antibodies in blocking solution were applied over night at 4°C. The following primary antibodies were used for western blot analysis: p53 (mouse, MA5-12571 Thermo Fisher Scientific, 1:1000), KAP1 (rabbit, A300–274A Bethyl, 1:1000). Secondary horseradish peroxidase-coupled antibodies (Thermo Fisher Scientific) were applied for 1 hour at room temperature in PBS-Tween20 (0.01%) containing 1% milk powder prior to detection by ECL-based chemiluminescence.
Quantitative real-time PCR
Quantitative real-time PCR (qRT-PCR) was performed essentially as described previously 3 on a RotorGene3000 machine (Corbett Life Science). Total RNA was isolated by phenol-chlorophorm extraction, reverse transcribed using the high-capacity cDNA reverse transcription kit (Applied Biosystems), and qRT-PCR was performed in triplicates using the SensiMix Plus SYBR kit (Quantace). The following primer pair sequences were used: p53 forward: 5′-CGTGTATCAGCAGCCAGACTGC-3′ p53 reverse: 5′-CAAGGGGGACAGAACGTTGTTTTCAG-3′ RPS12 forward: 5′-GGAGGCTTGGGTGCGTTCAAG-3′ RPS12 reverse: 5′-GGTGGCAGTTTTGTTCCGGTTGC-3′ Immunostaining Cells were grown on sterile 12 mm glass coverslips, fixed in 3% formaldehyde in PBS for 15 minutes at room temperature, washed once in PBS, permeabilized for 5 minutes at room temperature in 0.2% Triton X-100 (Sigma-Aldrich) in PBS, and washed twice in PBS. For denaturing BrdU stainings cells were treated with 2 M HCl for 15 min and neutralized by several washes in 100mM Tris-HCl (pH 7.5). All primary antibodies (see below for specifications) and secondary antibodies (Alexa fluorophores, Life Technologies) were diluted in filtered DMEM containing 10% FBS and 0.02% Sodium Azide. Antibody incubations were performed for 1–2 hours at room temperature. Following antibody incubations, coverslips were washed once with PBS and incubated for 10 minutes with PBS containing 4′,6-Diamidino-2-Phenylindole Dihydrochloride (DAPI, 0.5 μg/ml) at room temperature to stain DNA. After three washing steps in PBS, coverslips were briefly washed with distilled water and mounted on 5μl Mowiol-based mounting media (Mowiol 4.88 (Calbiochem)/Glycerol/TRIS). The following primary antibodies were used for immunostaining: 53BP1 (rabbit, Santa Cruz sc-22760, 1:500), 53BP1 (mouse, Upstate MAB3802, 1:1000), Cyclin A (mouse, Abcam ab 16726, 1:200), Cyclin A (rabbit, Santa Cruz sc-751, 1:100), BrdU (mouse, Abcam ab 6326, 1:100). Quantitative image-based cytometry (QIBC) Automated multichannel wide-field microscopy for quantitative image-based cytometry (QIBC) was performed as described previously 36 on an Olympus ScanR Screening System equipped with an inverted motorized Olympus IX83 microscope, a motorized stage, IR-laser hardware autofocus, a fast emission filter wheel with single band emission filters, and a 12bit digital monochrome Hamamatsu ORCA-FLASH 4.0 V2 sCMOS camera (dynamic range 4000:1, 2048 × 2048 pixel of size 6.5 × 6.5 μm, 12 bit dynamics). For each condition, image information of large cohorts of cells (typically at least 500 cells for the UPLSAPO 40x objective (NA 0.9), at least 2000 cells for the UPLSAPO 20x objective (NA 0.75), and at least 5000 cells for the UPLSAPO 10x (NA 0.4) and UPLSAPO 4x (NA 0.16) objectives) was acquired under non-saturating conditions. Identical settings were applied to all samples within one experiment. Images were analyzed with the inbuilt Olympus ScanR Image Analysis Software Version 2.5.1, a dynamic background correction was applied, nuclei segmentation was performed using an integrated intensity-based object detection module using the DAPI signal, and foci segmentation was performed using an integrated spot-detection module. All downstream analyses were focused on properly detected interphase nuclei containing a 2C–4C DNA content as measured by total and mean DAPI intensities per nucleus. Fluorescence intensities were quantified and are depicted as arbitrary units. Color-coded scatter plots of asynchronous cell populations were generated with Spotfire data visualization software (TIBCO). Within one experiment, similar cell numbers were compared for the different conditions. For visualizing discrete data in scatter plots (e.g. foci numbers), mild jittering (random displacement of data points along the discrete data axes) was applied in order to demerge overlapping data points. Representative scatter plots and quantifications of independent experiments, typically containing several thousand cells each, are shown.
Time-lapse microscopy
Time-lapse microscopy was performed on the same Olympus ScanR Screening System under CO 2 (5%) and temperature (37 °C) control and employing an inbuilt infrared-based hardware autofocus. For extended time-lapse imaging for up to 72 h exposure times were kept minimal to avoid phototoxicity. Cells were plated on multi-well plates (Greiner CELLSTAR 96-well-plates, Sigma Aldrich) at a density of 8,000 cells per well 24 h prior to imaging. Images were taken at 30 min intervals for up to 72 h using a UPLSAPO 20x objective (NA 0.75) in Dulbecco's DMEM medium containing 10% FCS (GIBCO) and penicillin-streptomycin. GFP-53BP1 cells were transduced 8 h prior to imaging with BacMam RFP-CDT1 Premo (FUCCI Cell Cycle Sensor BacMam 2.0, Life Technologies) using 0.1 μl of BacMam CDT1-RPF per 8,000 seeded cells in 200 μl of medium. Image processing and analysis was performed with the help of Fiji and Olympus ScanR Analysis software. For showing single cells at defined time-points, brightness and contrast were adjusted for individual frames to correct for background fluorescence. G1 duration was determined based on the CDT1 cell cycle marker.
Supplementary Material 1383578_Supplemental_Material.zip
📊 Figures
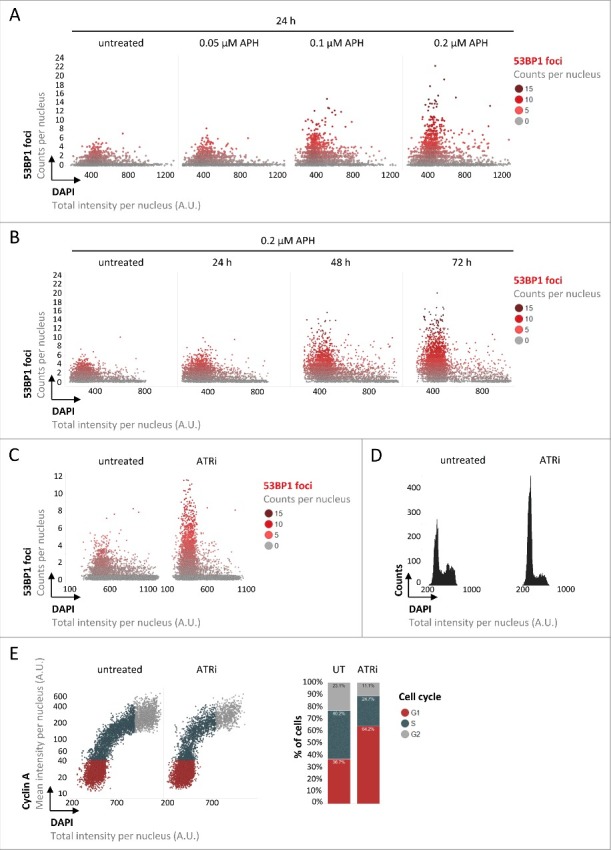
Figure 1.
Replication stress-induced inherited DNA lesions result in an accumulation of cells in G1. (A) Asynchronously growing U-2 OS cells were treated with increasing doses of APH as indicated and stained fo...
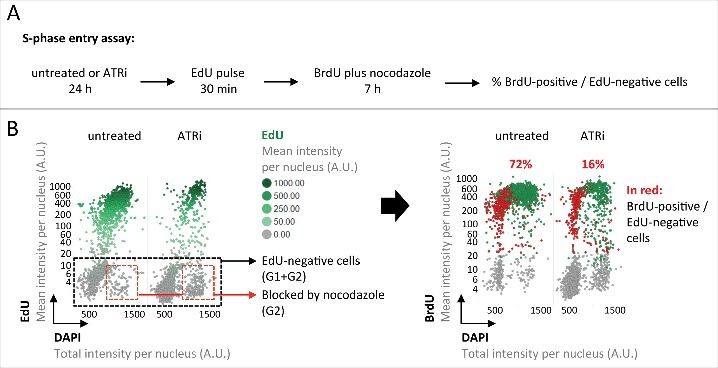
Figure 2.
Inherited DNA lesions impair S-phase entry. (A) Experimental scheme to measure S-phase entry from G1 in asynchronously growing U-2 OS cell populations. (B) QIBC-derived cell cycle staging based on EdU...
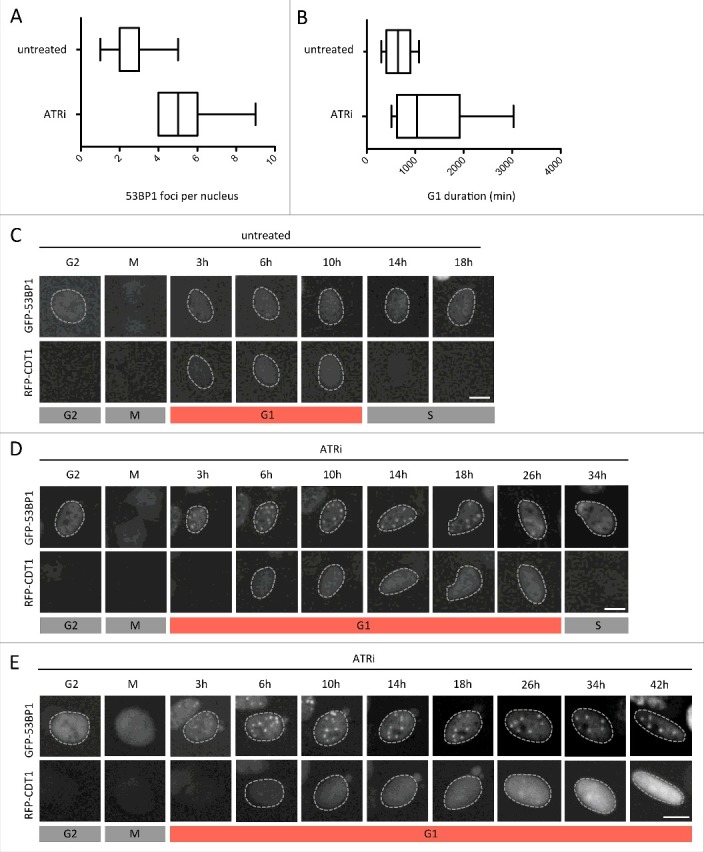
Figure 3.
Inheritance of DNA lesions is associated with extended G1 duration. Asynchronously growing U-2 OS cells stably expressing GFP-53BP1 transduced with BacMam RFP-CDT1 were followed by time-lapse microsco...
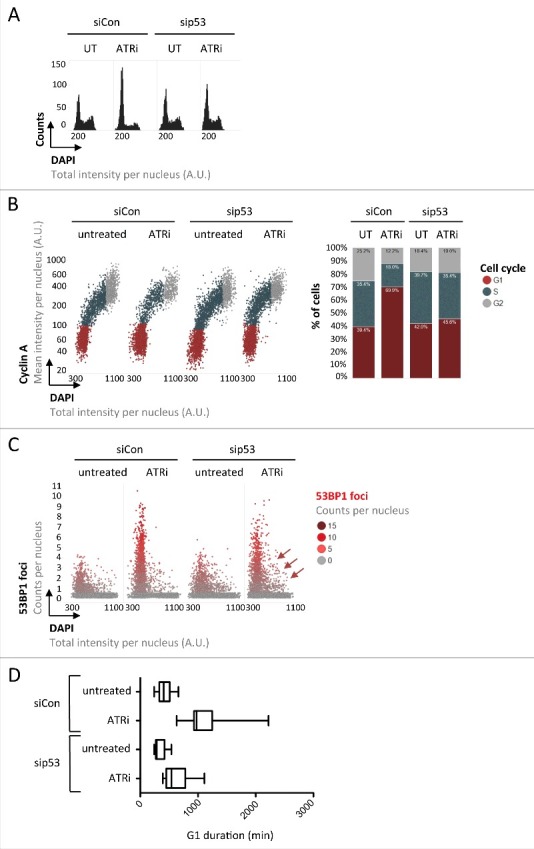
Figure 4.
The tumor suppressor protein p53 regulates G1 duration in response to inherited DNA lesions from the previous S-phase. (A) U-2 OS cells were transfected with siRNAs and exposed to ATRi as indicated. Q...
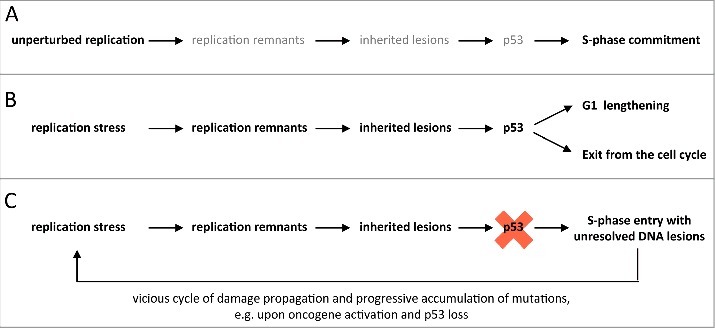
Figure 5.
Model for S-phase commitment in the context of inherited DNA lesions. (A) During unperturbed replication the small number of replication remnants and low amounts of inherited DNA lesions promotes a sm...
Figure images are served from the NIH/NLM PubMed Central Open Access Subset or Europe PMC; copyright remains with the publishers and authors.
💬 Discussion
0 commentsNo comments yet. Be the first to start a discussion!
Leave a Comment