Abstract
AbstractEven though metformin is widely used to treat type2 diabetes, reducing glycaemia and body weight, the mechanisms of action are still elusive. Recent studies have identified the gastrointestinal tract as an important site of action. Here we used intestinal organoids to explore the effects of metformin on intestinal cell physiology. Bulk RNA-sequencing analysis identified changes in hexose metabolism pathways, particularly glycolytic genes. Metformin increased expression of Slc2a1 (GLUT1), decreased expression of Slc2a2 (GLUT2) and Slc5a1 (SGLT1) whilst increasing GLUT-dependent glucose uptake and glycolytic rate as observed by live cell imaging of genetically encoded metabolite sensors and measurement of oxygen consumption and extracellular acidification rates. Metformin caused mitochondrial dysfunction and metformin’s effects on 2D-cultures were phenocopied by treatment with rotenone and antimycin-A, including upregulation of GDF15 expression, previously linked to metformin dependent weight loss. Gene expression changes elicited by metformin were replicated in 3D apical-out organoids and distal small intestines of metformin treated mice. We conclude that metformin affects glucose uptake, glycolysis and GDF-15 secretion, likely downstream of the observed mitochondrial dysfunction. This may explain the effects of metformin on intestinal glucose utilisation and food balance.
🔬 Techniques
🔭 Microscopes
💻 Software
✨ Fluorophores
🧪 Sample Preparation
🔬 Cell Lines
🏭 Microscope Brands
🧪 Reagent Suppliers
📷 Detectors
💻 Software Details
🏛️ Research Organizations (ROR)
Affiliated research institutions:
📋 Methods
Intestinal organoid and 2D monolayer cultures
Generation and maintenance of mouse intestinal organoids were performed as previously described 61 , 62 . Duodenal and ileal organoids were generated from isolated intestines from the proximal 3 cm beyond the stomach and distal 10 cm to the ileal-caecal junction, respectively. Organoids were suspended in domes containing Basement Material Extract (BME, Cultrex PathClear Reduced Growth Factor Type 2, R&D Systems) with growth media containing E pithelial Growth Factor (EGF), N oggin, R -Spondin (= ENR) and Rho-associated protein kinase (ROCK) inhibitor Y-27632 (10 µM). 2D monolayer cultures were established as previously described 61 . Briefly, organoids were dissociated using TryPLE reagent (Life Technologies) for 2–4 min at 37 °C followed by mechanical trituration, before seeding the suspension on dishes coated with 2% matrigel dissolved in Advanced DMEM/F12 (4500 mg/l glucose, Life Technologies) media. Bulk RNA-sequencing In preparation of samples for RNA-sequencing, two transgenic organoid lines (called GIP-cre tdRFP and SST-cre tdRFP), which express cell specific fluorescent reporters in enteroendocrine cell populations but are otherwise normal, were plated as 2D monolayer cultures in 3 separate 24-well plates on day 1 followed by treatment with or without 1 mM metformin for 24 h. Mouse intestinal 2D monolayer cultures plated were lysed in RLT plus buffer and the RNA was extracted using the RNeasy Micro Plus kit (Qiagen) according to manufacturer’s instructions. Removal of salt carryover was subsequently performed using RNeasy MinElute Cleanup kit (Qiagen). The quality of RNA was validated by Bioanalyser RNA Nano kit (Agilent) and Agilent Bioanalyser 2100 system with RIN values between 8.1 and 9.4. 1 µg of total RNA was used for library construction using Illumina's TruSeq Stranded mRNA Library Prep Kit according to the manufacturer’s protocol at the Institute of Metabolic Science Genomics and Transcriptomics Core Facility (Cambridge, UK). Indexed libraries were purified, normalised, pooled and sequenced on the HiSeq 4000 platform (Illumina) at the Genomics Core Facility, Cancer Research UK Cambridge Institute (Cambridge, UK). All RNA sequencing analyses were performed using Bioconductor software packages in RStudio (v.1.2.5019) Gene annotation was obtained from the Ensembl dataset held in BioMart (v2.40.5). Differential expression of genes was calculated using the DESeq2 package (v1.24.0). A first DESeq analysis was performed to obtain a list of non-differentially expressed (non-DE) genes (P adjusted value > 0.05) between control and metformin treated samples pooled from both organoid lines combined by fitting a negative binomial generalised linear model. A second DESeq analysis was performed by estimating the size factors using only the non-DE genes from the first analysis. A local dispersion estimation fit was performed in the second DESeq analysis. A threshold with log2FoldChange of 0.3 was selected and any genes with < 0.3 log2FoldChange were classified as non-DE genes. The raw counts were normalised by variance stabilising transformation (VST), which divides the raw count data by the Size Factors. Gene Ontology and KEGG pathway analysis were performed using goseq and clusterprofiler packages, respectively. Mitochondrial gene lists were generated from the MitoCarta2.0 database 35 . Real-time quantitative PCR (RT-qPCR) RNA extraction from mouse intestinal 2D monolayer cultures plated in 48 well plates was performed using the RNeasy Micro Plus kit (Qiagen) according to manufacturer’s instructions. RNA-extraction from frozen intestinal tissues of HFD-fed mice was performed as described 26 . The reverse transcription reaction was performed using MMLT-RV transcriptase (Promega) on the Peltier-Thermo Cycler-225 (MJ Research) according to manufacturer’s instructions. RT-qPCR reactions were performed as described 63 . The Taqman probes (Thermo Fisher) were Actb (Mm02619580_g1), Slc2a1 (Mm00441480_m1), Slc2a2 (Mm00446229_m1), Slc5a1 (Mm00451203_m1), Slc2a5 (Mm00600311_m1), Gdf15 (Mm00442228_m1), Hk1 (Mm00439344_m1), Hk2 (Mm00443385_m1), Pfkp (Mm00444792_m1), Aldoa (Mm00833172_m1). The RT-qPCR reaction was performed using the 7900 HT Fast Real-Time PCR system (Applied Biosystems, Fisher Scientific, Waltham, MA, USA). The qPCR results were normalised by calculating the difference in cycle threshold values (ΔCT) between the housekeeper gene β-actin and the gene of interest (CT βactin – CT gene ). Relative gene expression was expressed as 2 ΔCT for the given gene.
Show full methods section
Intestinal organoid and 2D monolayer cultures
Generation and maintenance of mouse intestinal organoids were performed as previously described 61 , 62 . Duodenal and ileal organoids were generated from isolated intestines from the proximal 3 cm beyond the stomach and distal 10 cm to the ileal-caecal junction, respectively. Organoids were suspended in domes containing Basement Material Extract (BME, Cultrex PathClear Reduced Growth Factor Type 2, R&D Systems) with growth media containing E pithelial Growth Factor (EGF), N oggin, R -Spondin (= ENR) and Rho-associated protein kinase (ROCK) inhibitor Y-27632 (10 µM). 2D monolayer cultures were established as previously described 61 . Briefly, organoids were dissociated using TryPLE reagent (Life Technologies) for 2–4 min at 37 °C followed by mechanical trituration, before seeding the suspension on dishes coated with 2% matrigel dissolved in Advanced DMEM/F12 (4500 mg/l glucose, Life Technologies) media. Bulk RNA-sequencing In preparation of samples for RNA-sequencing, two transgenic organoid lines (called GIP-cre tdRFP and SST-cre tdRFP), which express cell specific fluorescent reporters in enteroendocrine cell populations but are otherwise normal, were plated as 2D monolayer cultures in 3 separate 24-well plates on day 1 followed by treatment with or without 1 mM metformin for 24 h. Mouse intestinal 2D monolayer cultures plated were lysed in RLT plus buffer and the RNA was extracted using the RNeasy Micro Plus kit (Qiagen) according to manufacturer’s instructions. Removal of salt carryover was subsequently performed using RNeasy MinElute Cleanup kit (Qiagen). The quality of RNA was validated by Bioanalyser RNA Nano kit (Agilent) and Agilent Bioanalyser 2100 system with RIN values between 8.1 and 9.4. 1 µg of total RNA was used for library construction using Illumina's TruSeq Stranded mRNA Library Prep Kit according to the manufacturer’s protocol at the Institute of Metabolic Science Genomics and Transcriptomics Core Facility (Cambridge, UK). Indexed libraries were purified, normalised, pooled and sequenced on the HiSeq 4000 platform (Illumina) at the Genomics Core Facility, Cancer Research UK Cambridge Institute (Cambridge, UK). All RNA sequencing analyses were performed using Bioconductor software packages in RStudio (v.1.2.5019) Gene annotation was obtained from the Ensembl dataset held in BioMart (v2.40.5). Differential expression of genes was calculated using the DESeq2 package (v1.24.0). A first DESeq analysis was performed to obtain a list of non-differentially expressed (non-DE) genes (P adjusted value > 0.05) between control and metformin treated samples pooled from both organoid lines combined by fitting a negative binomial generalised linear model. A second DESeq analysis was performed by estimating the size factors using only the non-DE genes from the first analysis. A local dispersion estimation fit was performed in the second DESeq analysis. A threshold with log2FoldChange of 0.3 was selected and any genes with < 0.3 log2FoldChange were classified as non-DE genes. The raw counts were normalised by variance stabilising transformation (VST), which divides the raw count data by the Size Factors. Gene Ontology and KEGG pathway analysis were performed using goseq and clusterprofiler packages, respectively. Mitochondrial gene lists were generated from the MitoCarta2.0 database 35 . Real-time quantitative PCR (RT-qPCR) RNA extraction from mouse intestinal 2D monolayer cultures plated in 48 well plates was performed using the RNeasy Micro Plus kit (Qiagen) according to manufacturer’s instructions. RNA-extraction from frozen intestinal tissues of HFD-fed mice was performed as described 26 . The reverse transcription reaction was performed using MMLT-RV transcriptase (Promega) on the Peltier-Thermo Cycler-225 (MJ Research) according to manufacturer’s instructions. RT-qPCR reactions were performed as described 63 . The Taqman probes (Thermo Fisher) were Actb (Mm02619580_g1), Slc2a1 (Mm00441480_m1), Slc2a2 (Mm00446229_m1), Slc5a1 (Mm00451203_m1), Slc2a5 (Mm00600311_m1), Gdf15 (Mm00442228_m1), Hk1 (Mm00439344_m1), Hk2 (Mm00443385_m1), Pfkp (Mm00444792_m1), Aldoa (Mm00833172_m1). The RT-qPCR reaction was performed using the 7900 HT Fast Real-Time PCR system (Applied Biosystems, Fisher Scientific, Waltham, MA, USA). The qPCR results were normalised by calculating the difference in cycle threshold values (ΔCT) between the housekeeper gene β-actin and the gene of interest (CT βactin – CT gene ). Relative gene expression was expressed as 2 ΔCT for the given gene.
Transfection of 2D monolayer cultures
For live-cell imaging studies, on day 2 after establishing 2D monolayer cultures and before drug pre-treatment, cultures were transfected with the plasmid of interest. A transfection mix was prepared by mixing 2 µg of plasmid DNA with 2 µL of Lipofectamine 2000 reagent (Invitrogen) in 100 µL of Opti-Mem (Thermo Fisher Scientific) per reaction and incubated for 10 min at room temperature. 100 µL of transfection mix was added dropwise onto the centre of the imaging dish and incubated at 37 °C for 4–8 h. Transfection efficiency was visualised using the EVOS cell imaging system (Thermo Fisher Scientific). Transfected cells were overnight (18–28 h) treated with or without metformin/mitochondrial respiration inhibitors before imaging.
Live cell imaging of glucose and pyruvate levels
Live-cell imaging of glucose uptake was performed in cells transfected with FLII12Pglu-700μδ6 FRET-based glucose sensor, and live-cell imaging of pyruvate levels was performed in cells expressing the FRET-based sensor Pyronic 64 , 65 .
Imaging of fluorescent-resonance energy transfer
(FRET) sensors was performed on 2D monolayer cultures 2 days after seeding in 35 mm glass bottomed dishes and a day following transfection of the FRET sensor. Imaging was performed using an inverted fluorescence microscope (Olympus IX71) with a 40 × oil-immersion objective lens. Cells were excited at 435 ± 10 nm using a 75 W xenon arc lamp connected to a monochromator (Cairn Research), controlled by the MetaFluor software (Molecular Devices). CFP or mTFP emissions at ~ 470 nm and YFP or Venus emissions at ~ 535 nm were simultaneously monitored using an Optosplit II beam splitter (Cairn Research) and Orca ER camera (Hamamatsu Photonics). Images were acquired every 5 s.
Live cell metabolic imaging of Perceval
HR and Peredox sensors Perceval HR is a genetically encoded fluorescent intracellular ATP and ADP sensor as described in 66 . Transfected cells expressing Perceval HR (21737, Addgene) were imaged at 490 ± 2 nm and 450 nm excitation sequentially, and images were acquired every 10 s. Images were background subtracted using MetaFluor software. Fluorescence emitted from excitation at 490 nm was dictated by changes in intracellular ATP concentrations, whilst the isosbestic point remained constant. The Perceval fluorescence ratio (FI/F0) was calculated by dividing the fluorescence emitted from excitation at 490 nm by 450 nm. Peredox is a genetically encoded fluorescent sensor exclusively localised in the cytosol and not in the mitochondria, enabling compartmentalised imaging of cytosolic NADH concentrations (as a measurement of the cytosolic NADH/NAD + redox ratio) 67 . The T-Sapphire and mCitrine fluorescence of the Peredox sensor (32386, Addgene) was sequentially excited at 405 ± 20 nm and 480 ± 10 nm respectively, and images were acquired every 10 s. T-Sapphire fluorescence (emitted from excitation at 405 ± 20 nm) was increased correlating with cytosolic NADH concentrations, whilst the mCitrine fluorescence remained constant throughout the experiment. Peredox fluorescence ratio (FI/F0) was calculated by dividing the fluorescence at 405 nm by 480 nm. Autofluorescence imaging of NAD(P)H and FAD The cellular redox states can be estimated by measuring NAD(P)H and FAD autofluorescence 68 . NAD(P)H has an autofluorescence characteristic of the nicotinamide ring at UV range of excitation, whilst FAD has a characteristic autofluorescence of the flavin ring excited at ~ 450 nm. Autofluorescence imaging was performed on untransfected 2D monolayer cultures 2 days after seeding in 35 mm 2 glass bottomed dishes. A phase contrast image of the cells was captured as a reference to identify cells/regions of interest. NAD(P)H and FAD autofluorescence were sequentially excited at 360 ± 15 nm and 465 ± 10 nm, respectively and images were acquired every 10 s. Background subtraction was performed using MetaFluor software and fluorescence measurements were transcribed in an excel spreadsheet. Data points were smoothened with a sliding average of 60 s. Changes in NAD(P)H and FAD autofluorescence (measured as arbitrary units) were calculated by subtracting the differences from the maximal fluorescence response during treatment to the maximal fluorescence 120 s prior to treatment (basal).
Seahorse bioanalyser assays
Experiments were performed on the Seahorse XF24 bioanalyser (Agilent) according to manufacturer’s instructions. Briefly, 20 of the 24 wells in the XF24 plates (Agilent) were used to establish 2D monolayer cultures at full confluency, with 4 wells used as blanks (no cell controls). The cultures were treated with/without metformin in a random plate order for 24 h at 37 °C in the humidifying chamber in 5% CO 2 . On the day of the experiment, the cells were incubated with 525 µL of Seahorse XF base medium without Phenol red (Agilent) with the indicated compounds for 1 h, 37 °C in a non-CO 2 incubator. The cartridge was loaded with 75 µL of the indicated drugs. All experiments were performed at 37 °C. At each measurement of extracellular acidification rate (ECAR) and oxygen consumption (OCR), each well was mixed for 3 min followed by measurements for another 3 min. ECAR and OCR were normalised to total protein content by performing BCA assay (Sigma) on lysed cells at the end of each experiment.
MitoTracker imaging and mitochondrial morphology analysis
Intestinal cells were seeded in 2D monolayers in black walled 96 well plates (Perkin Elmer) prior to treatment with or without 1 mM metformin for 24 h. Cells were stained with MitoTracker green (Thermo Fisher) for 20 min, followed by incubation with ENR media for another 30 min. Cultures were washed at least 3 times with media for 2 h (where 1 mM metformin was present throughout each wash step in treatment groups). Live cell confocal imaging was performed on a high-content imaging platform at × 40 objective (Opera Phenix-Perkin Elmer). Mitochondrial morphology analysis was performed using Harmony software. Images were background subtracted using Sliding Parabola function, followed by defining regions with mitochondrial networks based on images taken at DIC, as well as criteria including surface texture, brightness and sizes of regions and linear classifier machine learning. Spots were applied onto mitochondrial networks, and geometrical parameters were calculated based on the shapes of spots. Separately, cells were also categorised and counted (using Fiji) by a condition-blinded experimenter scoring mitochondrial morphological characteristics: elongated (where all of the mitochondria displayed strand like patterns), intermediate (where mitochondria displayed a mixture of fragmented and elongated features) and fragmented (where mitochondria displayed dot-like patterns).
Lactate release assays
Lactate release was performed 2 days after seeding mouse intestinal organoids into 2D monolayers in 48 well plates and 24 h after treatment with/without 1 mM metformin. On the day of experiment, media was removed and cultures were washed 3 times with warm PBS. Cultures were incubated for 4 h at 37 °C in the humidifying chamber treated with 100 µL of DMEM without phenol red, glucose, glutamine or pyruvate (A1443001, Thermo Fisher) plus the indicated drugs. The medium was then collected and spun at 5000 g for 5 min at 4 °C to remove debris and dead cells. The supernatant was collected and lactate was measured at the Core Biochemical Assay Laboratory, University of Cambridge using a lactate assay kit (Siemens Healthcare). The lysates were treated with lysis buffer, and lysates were collected and spun at 10,000 g for 10 min at 4 °C. Secretion results were normalised to total protein lysate content measured using BCA assay (Thermo Fisher).
GDF-15 secretion assays
GDF-15 secretion was performed a day after seeding mouse intestinal organoids into 2D monolayers in 48 well plates. 2D organoid cultures were treated with mitochondrial respiration inhibitors for 24 h at 37 °C in the humidifying chamber with 150 µL of ENR and the indicated drugs. The medium was then collected and spun at 5000 g for 5 min at 4 °C. The supernatant was collected and GDF-15 was measured at the Core Biochemical Assay Laboratory, University of Cambridge using a mouse GDF-15 assay kit (MGD-150, R&D Systems) using a microtiter plate-based two-site electrochemiluminescence immunoassay (MesoScale Discovery assay). The secretion results were normalised to basal secretion (control) for each experiment to calculate the fold change.
Generation of apical-out and basal-out organoids
The protocol for generation of apical-out organoids was adapted from 37 . Briefly, 24 well plates were coated with 1% PolyHEMA (Sigma) dissolved in absolute ethanol and left to dry overnight to produce low attachment plates. Organoids were collected in 5% EDTA dissolved in PBS or Cell Recovery solution (Corning) in lo-bind Eppendorf tubes and placed on a plate rotator for 1 h at 4 °C to remove BME. The organoids were then spun at 600 × g for 5 min and the pellet was resuspended in ENR before plating in low-attachment plates. The organoids were cultured for 2–3 days prior to treatment with 1 mM metformin for 24 h before RNA extraction. Basal-out organoids were cultured by suspending organoids in BME and plated as domes in 48-well plates (as described in “ Metformin increases glycolysis in intestinal cells ”).
Immunohistochemistry and confocal imaging
Apical-out organoids were collected, spun at 500 × g for 5 min and washed with PBS, whilst basal-out organoids were collected in Cell recovery solution for 30 min on ice to remove BME before spinning. Organoids were fixed with 4% Paraformaldehyde (Alfa Aesar) at room temperature for 30 min. After 3 × 10 min wash (PBS and 0.1% Triton X-100, Sigma), organoids were blocked with donkey serum (Sigma) for 1 h at room temperature followed by staining with Rabbit anti-villin antibody (1:1000, Abcam) at 4 °C overnight. The next day, organoids were brought to room temperature for 1 h, 3 × 10 min PBS and 0.1% Triton X-100 wash, followed by application of anti-rabbit Alexa-Fluor 488 secondary antibody (1:300, Invitrogen) for 1 h at room temperature. Organoids were washed in PBS and 0.1% Triton X-100 and treated with 2 µg/mL DAPI (1:300, Sigma) before mounting in Hydromount (National Diagnostics). Organoids were imaged using Leica SP8 laser-scanning confocal microscope (Leica) and z-stack images were taken with 1 μM thickness. Images were analysed via Fiji. High fat diet mouse experiments The experimental procedures used in experiments involving male C57BL6/J mice fed with HFD were described previously 26 . All mouse studies were performed in accordance with UK Home Office Legislation regulated under the Animals (Scientific Procedures) Act 1986 Amendment, Regulations 2012, following ethical review by the University of Cambridge Animal Welfare and Ethical Review Body (AWERB). In brief, samples were taken from two cohorts; one cohort where mice had been fed on HFD for 4 weeks (1 week 45% HFD, 3 weeks 60% HFD) and given a single dose of 600 mg/kg with tissue samples taken 6 h later, the second cohort where mice switched to 60% HFD for 3 days before given 300 mg/kg does for 11 days with tissue taken 4 h after last dose. Intestinal tissue was isolated from mice as previously described in 26 . The small intestine (from the stomach to the ileal-caecal junction) was isolated into three equal length segments and intestinal tissues were taken from the middle of each segment. These segments were termed proximal, middle and distal small intestine, respectively. The colon was isolated from the ileal-caecal junction to the anus, and the colonic tissue was taken from the middle of the segment. The tissues were collected in Lysing Matrix D homogenisation tube (MP Biomedicals) on dry ice and stored at − 80 °C before RNA extraction. An additional cohort of C57BL6/JN mice fed 60% HFD was given metformin in the drinking water—the initial dose was 1 g/l for two weeks, which was, as the mice tolerated this well, increased to 3 g/l for an additional two weeks. Mice were sacrificed and intestinal tissue (cut into three equal sized small intestinal sections referred to as duodenum, jejunum and ileum, and two (proximal and distal) colon/rectum sections) were washed repeatedly in PBS to remove luminal contents and non-absorbed metformin. Other tissues taken included left liver lobe and left kidney and a terminal blood/plasma sample. All materials were stored at − 80 °C before mass spectroscopic quantification of metformin content.
Analysis of metformin concentrations
Metformin was isolated utilising an adapted version of the liquid–liquid extraction previously described 69 . Briefly, the tissues were weighed (between ~ 2 to 20 mg) or biological fluids pipetted (~ 10 µL) into 2 mL screw cap Eppendorf plastic tube (Eppendorf, Stevenage, UK) along with a single 5 mm stainless steel ball bearing. Immediately after, 400 µL of chloroform:methanol (2:1, respectively) solution was added, followed by thorough mixing. Samples were then homogenised using a Bioprep 24-1004 homogeniser (Allsheng, Hangzhou City, China). 100 µL of the metformin-d6 internal standard, 1,1-Dimethyl-d6-biguanide hydrochloride from QMX laboratories (Thaxted, Essex, United Kingdom) (1 µM in water) was added followed by the addition of 600 µL of chloroform:methanol (2:1, respectively) solution and homogenised again. Then 300 µL of HPLC water was added to each sample. The samples were vortexed and centrifuged at ~ 21,000 g for 5 min. The aqueous top layers were transferred into 2 mL amber glass vials and dried down using a Concentrator Plus system (Eppendorf, Stevenage, UK). Samples were reconstituted in 100 µL of the chromatography starting conditions (9:1 mix of mobile phase A and B) and thoroughly vortexed. Reconstituted samples were transferred into a 250 μL glass vial insert in a 2 mL amber glass vial ready for LC–MS analysis. LC–MS analysis was achieved using a Shimadzu HPLC System (Shimadzu UK Limited, Milton Keynes, United Kingdom) with the injection of 5 µL of the sample onto a Scherzo SM-C18 column (150 mm × 3 mm I.D., 3 µm) maintained at 40 °C. Mobile phase A was 30 mM ammonium acetate in water with 0.02% acetic acid. Mobile phase B was 20% acetonitrile, 80% water with 0.8% acetic acid. The flow was maintained at 0.5 mL per minute with the following gradient: 0.00 min_10% mobile phase B; 0.20 min_10% mobile phase B; 1.20 min_99% mobile phase B; 5.00 min_99% mobile phase B; 5.10 min_10% mobile phase B; 8.00 min_10% mobile phase B. The sample injection needle was washed using 50:50 water and acetonitrile solution. The mass spectrometer used was the Thermo Scientific Exactive Orbitrap with a heated electrospray ionisation source (Thermo Fisher Scientific, Hemel Hempstead, UK). The mass spectrometer source tune file was optimised for metformin and applied to the instrument method. The metformin analysis was run in positive mode from 0 to 5.00 min with the mass spectrometer scan rate set at 2 Hz, giving a resolution set to 50,000 (arbitrary units) with a full-scan range of m/z 100 to 200.
Statistical analysis
Results were analysed for normality distribution, and statistical differences between groups were analysed via GraphPad Prism 7.0 software. For RNA-seq data, statistical analysis of DE genes was performed via DE-Seq2 package using R Studio. The specific statistical tests used are stated in the figure legends. All data were considered statistically significant when P < 0.05.
Supplementary Information Supplementary Figures.
📊 Figures
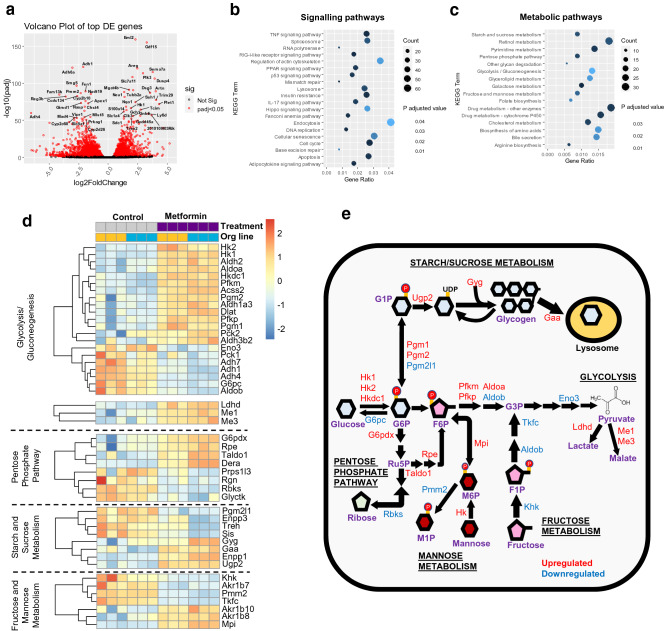
Figure 1
The effects of metformin on differentially expressed (DE) genes and metabolic pathways in mouse intestinal monolayer cultures. ( a ) Volcano plot displaying gene expression changes in duodenal organoi...
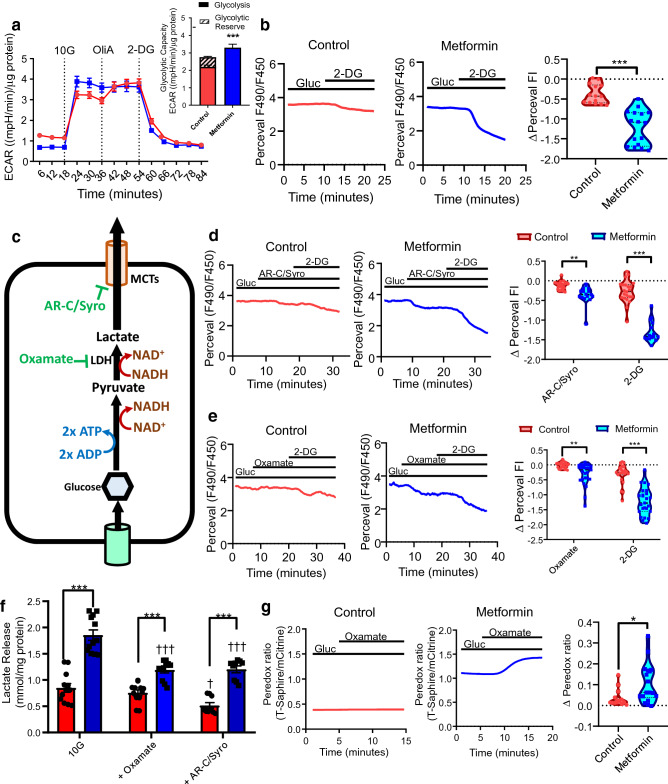
Figure 2
Metformin increases glycolysis in intestinal cells. ( a ) Changes in extracellular acidification rate (ECAR) during the glycolytic stress test wherein intestinal cells were pre-treated with control or...
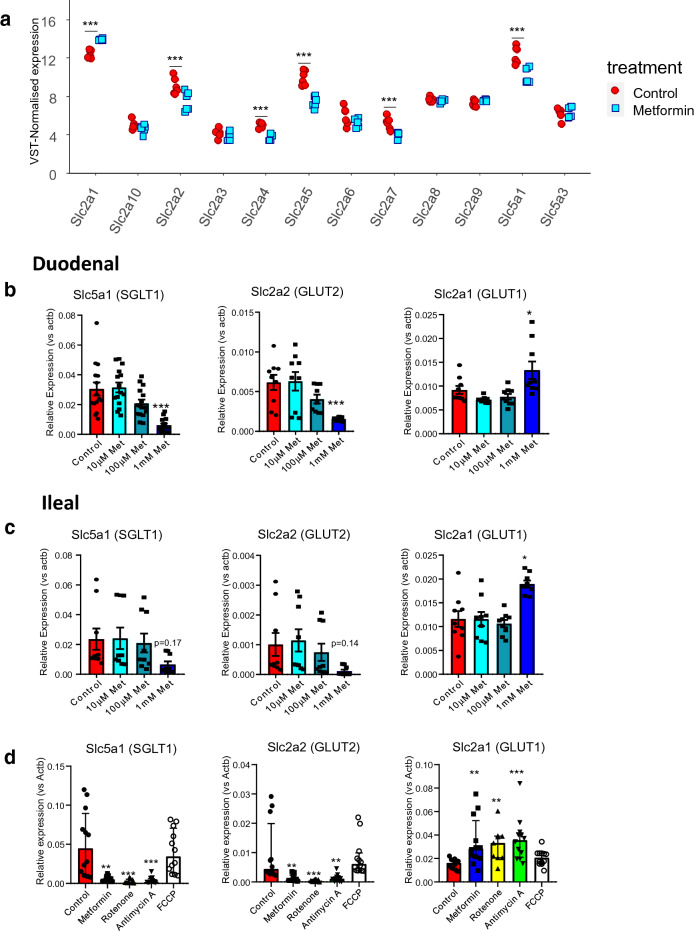
Figure 3
Metformin and other mitochondrial respiration inhibitors decreased expression of glucose transporters but increased Slc2a1 (GLUT1) expression. ( a ) RNA-sequencing analysis of the mRNA transcript expr...
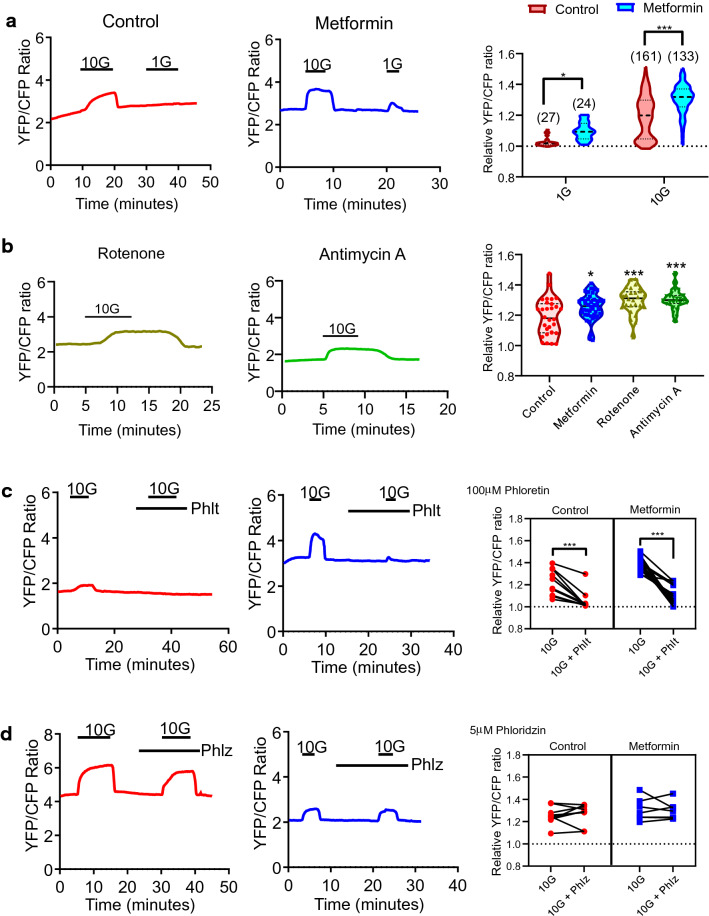
Figure 4
Metformin and other mitochondrial respiration inhibitors increase glucose uptake mediated by GLUT transporters in intestinal cells, measured using a FRET-based glucose sensor. ( a ) Left: Example trac...
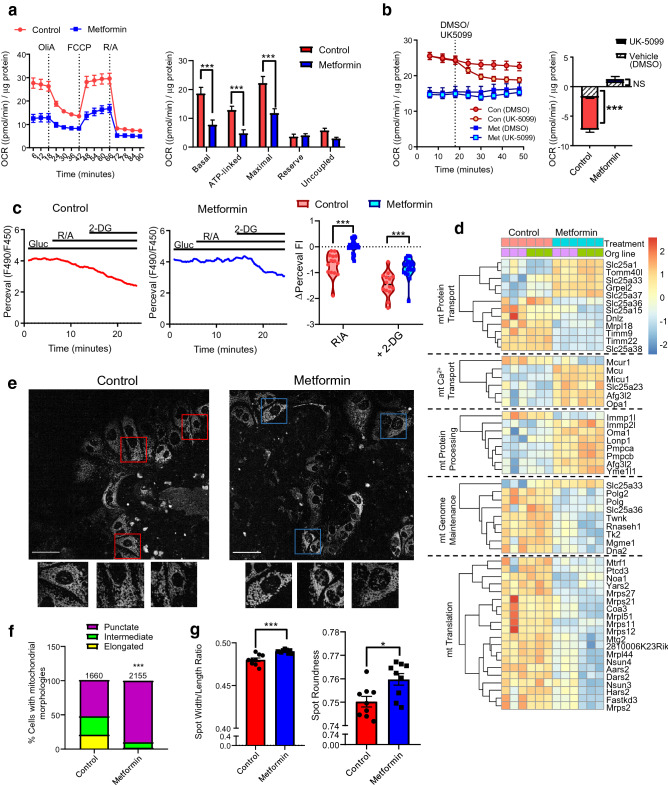
Figure 5
Metformin causes mitochondrial dysfunction in intestinal cells. ( a ) Left: Changes in oxygen consumption rate (OCR) during the mitochondrial stress test. Cells were pre-treated with control (ENR medi...
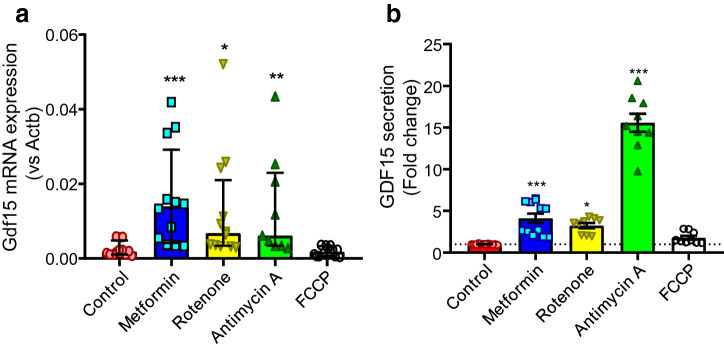
Figure 6
Metformin and mitochondrial electron transport chain inhibitors induce GDF-15 mRNA expression and secretion. ( a ) Gdf15 mRNA expression in mouse duodenal 2D monolayer cultures pre-treated with no tre...
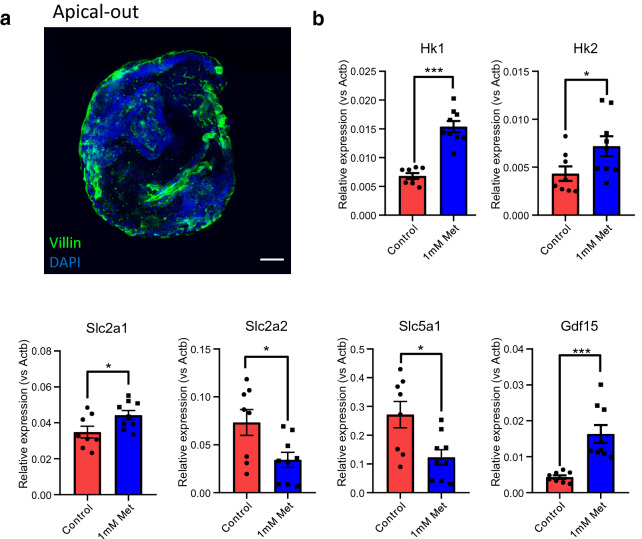
Figure 7
The effects of metformin on gene expression changes in apical-out and basal-out intestinal organoids. ( a ) Confocal images of mouse apical-out intestinal organoids stained with villin (green) and DAP...
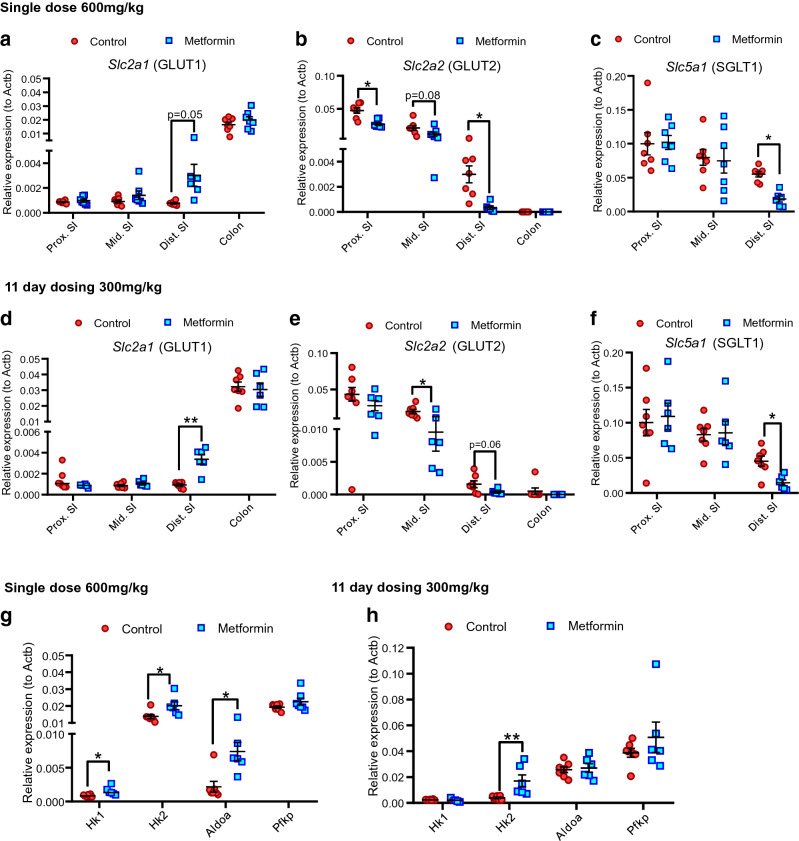
Figure 8
The effects of metformin on the expression of glucose transporters and metabolism genes in HFD-fed mice. ( a u2013 c ) Effects of a single oral dose of metformin (600u00a0mg/kg) on expression of gluco...
Figure images are served from the NIH/NLM PubMed Central Open Access Subset or Europe PMC; copyright remains with the publishers and authors.
💬 Discussion
0 commentsNo comments yet. Be the first to start a discussion!
Leave a Comment