Abstract
Abstract The vasculature undergoes changes in diameter, permeability and blood flow in response to specific stimuli. The dynamics and interdependence of these responses in different vessels are largely unknown. Here we report a non-invasive technique to study dynamic events in different vessel categories by multi-photon microscopy and an image analysis tool, RVDM (relative velocity, direction, and morphology) allowing the identification of vessel categories by their red blood cell (RBC) parameters. Moreover, Claudin5 promoter-driven green fluorescent protein (GFP) expression is used to distinguish capillary subtypes. Intradermal injection of vascular endothelial growth factor A (VEGFA) is shown to induce leakage of circulating dextran, with vessel-type-dependent kinetics, from capillaries and venules devoid of GFP expression. VEGFA-induced leakage in capillaries coincides with vessel dilation and reduced flow velocity. Thus, intravital imaging of non-invasive stimulation combined with RVDM analysis allows for recording and quantification of very rapid events in the vasculature.
🔬 Techniques
🔭 Microscopes
✨ Fluorophores
🧪 Sample Preparation
🏭 Microscope Brands
🧪 Reagent Suppliers
🔴 Lasers
🔎 Objectives
🎨 Filters
💻 Software Details
💾 Data Repositories
🏛️ Research Organizations (ROR)
Affiliated research institutions:
📋 Methods
Experimental setup for in vivo imaging of vascular dynamics
To follow vascular dynamics over time, we established a setup for non-invasive intravital time-lapse imaging using MPLSM. Imaging was performed on the ventral aspect of the C57BL/6 mouse ear dermal vasculature by fixing to a glass slide (Fig. 1a ). Vessels were visualized by systemic administration of fluorescent tracers via tail vein cannulation. A sub-micron glass capillary was used for atraumatic intradermal injection of small volumes (~0.1 µl) of recombinant proteins. Intradermal injection of VEGFA164, but not PBS, resulted in a rapid and transient induction of vascular leakage (Fig. 1b , see Supplementary Movie 1 ), in agreement with its established function 28 . Fig. 1 Non-invasive imaging of the ear dermis vasculature. a Mice were anesthetized and immobilized to fix the ear under a water-immersion objective lens for intravital imaging. Cannulation of the tail vein allowed administration of fluorescent labeled dextrans or other carriers into the circulation. A sub-micron glass capillary was used for atraumatic intradermal injection. b Examples of the leakage from blood vessels in response to micro-injection of VEGFA164 but not PBS. Glass capillary was filled with 1 μl VEGFA164 (1 μg/μl) and Alexa633 dye (cyan); about 0.1 μl was injected. Green, 2000 kDa FITC-Dextran. Red, 70 kDa TRITC-Ficoll. Images were acquired 5 min before and 30 min after injection. Bar, 50 μm
Methods Animals
Wild-type female C57BL/6J mice age 10–18 weeks were used, unless otherwise indicated, for live imaging of the ear vasculature. In certain cases, C57BL/6J mice (also females and 10–18 weeks), expressing enhanced green fluorescent protein (EGFP) under the control of the mouse Claudin5 promoter, denoted Cldn5 (BAC)-GFP, were used. In vivo animal experiments were carried out in strict accordance with the ethical permit provided by the Committee on the Ethics of Animal Experiments of the University of Uppsala (permit no C119/13). After injection in the ear dermis and in vivo imaging, mice were killed. Care was taken to avoid unnecessary suffering for the animal. Each experiment was conducted on tissue from at least three animals on at least three different experimental days. Mice were not randomized for the live imaging. Tissue samples were not blinded. Sample size (number of vessels observed in number of mice) were chosen to ensure reproducibility and allow stringent statistical analysis. See figure legends for information on sample sizes. All experimental conditions were reproduced with at least 3, most often up to 7 mice at different time points, representing individual biological repeats.
Show full methods section
Experimental setup for in vivo imaging of vascular dynamics
To follow vascular dynamics over time, we established a setup for non-invasive intravital time-lapse imaging using MPLSM. Imaging was performed on the ventral aspect of the C57BL/6 mouse ear dermal vasculature by fixing to a glass slide (Fig. 1a ). Vessels were visualized by systemic administration of fluorescent tracers via tail vein cannulation. A sub-micron glass capillary was used for atraumatic intradermal injection of small volumes (~0.1 µl) of recombinant proteins. Intradermal injection of VEGFA164, but not PBS, resulted in a rapid and transient induction of vascular leakage (Fig. 1b , see Supplementary Movie 1 ), in agreement with its established function 28 . Fig. 1 Non-invasive imaging of the ear dermis vasculature. a Mice were anesthetized and immobilized to fix the ear under a water-immersion objective lens for intravital imaging. Cannulation of the tail vein allowed administration of fluorescent labeled dextrans or other carriers into the circulation. A sub-micron glass capillary was used for atraumatic intradermal injection. b Examples of the leakage from blood vessels in response to micro-injection of VEGFA164 but not PBS. Glass capillary was filled with 1 μl VEGFA164 (1 μg/μl) and Alexa633 dye (cyan); about 0.1 μl was injected. Green, 2000 kDa FITC-Dextran. Red, 70 kDa TRITC-Ficoll. Images were acquired 5 min before and 30 min after injection. Bar, 50 μm
Methods Animals
Wild-type female C57BL/6J mice age 10–18 weeks were used, unless otherwise indicated, for live imaging of the ear vasculature. In certain cases, C57BL/6J mice (also females and 10–18 weeks), expressing enhanced green fluorescent protein (EGFP) under the control of the mouse Claudin5 promoter, denoted Cldn5 (BAC)-GFP, were used. In vivo animal experiments were carried out in strict accordance with the ethical permit provided by the Committee on the Ethics of Animal Experiments of the University of Uppsala (permit no C119/13). After injection in the ear dermis and in vivo imaging, mice were killed. Care was taken to avoid unnecessary suffering for the animal. Each experiment was conducted on tissue from at least three animals on at least three different experimental days. Mice were not randomized for the live imaging. Tissue samples were not blinded. Sample size (number of vessels observed in number of mice) were chosen to ensure reproducibility and allow stringent statistical analysis. See figure legends for information on sample sizes. All experimental conditions were reproduced with at least 3, most often up to 7 mice at different time points, representing individual biological repeats.
Growth factors and antibodies
Recombinant mouse VEGFA164 (493-MV/CF; R&D Systems) and canine VEGFA164 (a kind gift of Dr. Kurt Ballmer-Hofer, Paul Scherrer Institut, Villigen, Switzerland), which share 99% amino acid sequence identity, were used at a concentration of 1 μg/μl for intradermal injection. Repeated tests in this and other studies 37 showed no difference in efficiency to induce VEGFR2 activation and vascular leakage 37 . Approximately 0.1 μl (i.e., 100 ng VEGFA) was injected in each experiment. Anti-Claudin5 antibody (1:100 dilution; cat no 341600, Thermo-Fisher; validated by Nitta et al. 32 ) and Isolectin GS-IB 4 From Griffonia simplicifolia , Alexa Fluor™ 647 Conjugate (1:400 dilution; cat no I32450 , Thermo-Fisher) were used where stated. Tail vein cannulation and glass capillary A cannula made from a 30-gauge syringe needle tip and thin silicone tubing was inserted into the tail vein to administer fluorescent conjugates. Sub-micron glass capillaries with a tip diameter below 1 μm were used for intradermal injections. Capillaries were manufactured in-house using a handmade glass puller or micropipette puller (P-30, Sutter instrument) from borosilicate glass microtubule (BF150-120-10, Sutter instrument).
Immunofluorescent staining
Ears were removed and fixed in 4% paraformaldehyde (PFA) for 2 h at room temperature. After dissection, the tissue was post-fixed in 100% methanol at −20 °C for 10 min and blocked overnight at 4 °C in Tris-buffered saline (TBS) with 5% (w/v) nonfat dry milk and 0.2% Triton X-100. Samples were incubated overnight with primary antibody in blocking reagent, followed by washing several times in TBS with 0.2% Triton X-100 and incubation with appropriate secondary antibody for 2 h at room temperature in blocking buffer. For isolectin B4 staining, samples were subsequently fixed for 10 min with 4% PFA at room temperature before washing several times in PBlec (1 mM MgCl 2 , 1 mM CaCl 2 , 0.1 mM MnCl 2 and 1% Triton X-100 in PBS). Alexa647 conjugated isolectin B4 (132450, Thermo-Fisher) was then incubated with samples in PBlec for 2 h before washing several times and mounting in fluorescent mounting medium (DAKO). Images were acquired using a Leica SP8 confocal microscope.
Single or multi-photon imaging
Mice were anesthetized by intraperitoneal injection of Ketamine-Xylazine (62.5 mg/kg Ketamine and 8.3 mg/kg Xylazine). After a surgical level of anesthesia had been reached, the mouse was placed on a plastic plate with a heating pad covered with a cotton pad to maintain a body temperature of ~37.5 °C, recorded using a rectal probe. The depth of anesthesia was continuously monitored by testing the animal’s reflexes (e.g., pedal or eye blink reflex) during the experiment. In vivo imaging of blood vessels was performed using a single or multi-photon scanning microscope (Zeiss LSM710), equipped with a MaiTai HP Ti:Sapphire laser (SpectraPhysics) and DPSS Lasers, and a high N.A water-immersion objective lens (CFI75 Apochromat 25xW MP N.A.1.1, Nikon or W Plan-Apochromat ×20 N.A.1.0; Zeiss). Tissues were excited using a 960–1040 nm laser with a power of 0.5–20 mW under the objective lens, to avoid photo-damage. The emitted light was filtered to collect green and red or far-red fluorescent signals with second harmonic generation signals (BP475/42, BP525/50, BP641/75, FF495-Di03, Di02-R594, Semrock). Single-photon excitation was used for time-lapse imaging of dye bolus injections and three-color acquisition. The fluorescent signals were separated into green (490–550 nm), red (580–620 nm) and far-red fluorescence (640–680 nm) signals by grating methods. To visualize the vasculature and follow dynamic changes, 100 μl solutions containing 50 mg/ml of 2000 kDa TRITC-Dextran ( Cldn5 (BAC)-GFP) or a mixture of 2000 kDa FITC-Dextran and 70 kDa TRITC-Ficoll or 400 kDa TRITC-Ficoll in PBS (Sigma or Thermo-Fisher Scientific), were injected into the circulation via the tail vein cannula. Z -stack images were taken of the same visual field as observed by time-lapse imaging, before and after injections, to determine distribution of leakage points and vessel diameter. Slow time-lapse imaging (sXYT) was used to image blood vessel responses to vascular ligands with or without Alexa633 to trace injections using the sub-micron glass capillary. Scanning speed and image size Images were taken by one or two-photon microscopy with the following scan speeds and image size; ~1 ms/line, 1024 pixel/ line and under 0.1 μm/pixel for line scanning (XT), 20–100 ms/frame and under 0.2 μm/pixel for fast frame scan (fXYT), 0.5–1 s/frame for dye bolus analyses, 1–5 s/frame and over 1024 × 1024 pixel/frame and 0.2 μm/pixel for slow time-lapse (sXYT) and Z -stack images, and 1–10 s/frame and under 0.5 μm/pixel for tile scan Z -stack images. Vessel diameter The diameter of arterials, capillaries and venules were calculated using the full-width half-maximum (FWHM) method 38 , to provide accurate measurements regardless of fluorescent signal intensity and background noise levels. Briefly, the FWHM value was found following the fitting of Gaussian distribution to the intensity values of a line drawn perpendicular to the direction of blood flow and at least twice the vessel width. Measurement accuracy was ensured following calibration with 3 μm fluorescent beads. Relative velocity, diameter and morphology (RVDM) RBCs under very slow to no flow were measured to have a diameter of 5.3 µm by FWHM (Supplementary Figs. 2a, c). However, RBCs subject to shear stress change their shape, with those under flow becoming more ellipsoidal 33 . In addition, RBCs under flow can oscillate, due to the turbulent nature of blood flow, and also rotate around their axis parallel to flow, resulting in variations in the observed orthogonal axis 33 . To account for this variation and obtain a baseline image to which distorted RBC images could be compared, RBCs were imaged using fXYT (~20 ms/frame) to avoid the distortion caused by slow scan speeds. Subsequently their parallel and orthogonal axes in relation to the flow direction were measured (length 2 a and 2 b , respectively; Supplementary Fig. 2b, c ). From this, we could calculate the mean RBC dimensions under flow (2 a = 4.8 µm, 2 b = 3.6 µm; n > 100) and thus define the co-ordinates a and b (Supplementary Fig. 2c, d ); note the greater variation in 2 b due to RBC rotation around the axis parallel to flow. Using elliptical tangent formulae, flow angle compared to laser scan line ( θ ) and co-ordinates a and b from the parallel and orthogonal axes, we could then calculate co-ordinates c and d using Eqs. ( 1 ) and ( 2 ) (Supplementary Fig. 2e ). The points c and c ′ are defined as the co-ordinates of the tangent points formed with the laser scan line and d is the point horizontal to c and vertical to the RBC center (0), defined as the point where the axis between c and c ′ meets the long axes parallel and orthogonal to flow. Co-ordinates c and d , and Eqs. ( 3 ) and ( 4 ) were then used to calculate mean RBC lengths X ( X m ) and Y ( Y m ) between points c and c ′ (Supplementary Fig. 2e ) 1 documentclass[12pt]{minimal} usepackage{amsmath} usepackage{wasysym} usepackage{amsfonts} usepackage{amssymb} usepackage{amsbsy} usepackage{mathrsfs} usepackage{upgreek} setlength{oddsidemargin}{-69pt} begin{document}$$it left( {begin{array}{*{20}{c}} {c_x} \ {c_y} end{array}} right) = left( {begin{array}{*{20}{c}} {frac{{a^2{ {tan}}theta }}{{sqrt {a^2tan ^2theta + b^2} }}} \ {frac{{b^2}}{{sqrt {a^2tan ^2theta + b^2} }}} end{array}} right);left( {{mathrm{Supplementary}},{mathrm{Fig}}{mathrm{.}};{mathrm{2d}},,{mathrm{e}},;{mathrm{point}};{{c}}} right)$$end{document} c x c y = a 2 tan θ a 2 tan 2 θ + b 2 b 2 a 2 tan 2 θ + b 2 S u p p l e m e n t a r y F i g . 2 d , e , p o i n t c 2 documentclass[12pt]{minimal} usepackage{amsmath} usepackage{wasysym} usepackage{amsfonts} usepackage{amssymb} usepackage{amsbsy} usepackage{mathrsfs} usepackage{upgreek} setlength{oddsidemargin}{-69pt} begin{document}$$left( {begin{array}{*{20}{c}} {d_x} \ {d_y} end{array}} right) = left( {begin{array}{*{20}{c}} {begin{array}{*{20}{c}} {frac{{{tan}theta sqrt {a^2tan ^2theta + b^2} }}{{tan ^2theta + 1}}} end{array}} \ {frac{{sqrt {a^2tan ^2theta + b^2} }}{{tan ^2theta + 1}}} end{array}} right);left( {{mathrm{Supplementary}},{mathrm{Fig}}{mathrm{.}};{mathrm{2e}},;{mathrm{point}};{{d}}} right)$$end{document} d x d y = tan θ a 2 tan 2 θ + b 2 tan 2 θ + 1 a 2 tan 2 θ + b 2 tan 2 θ + 1 Supplementary Fig . 2e , point d 3 documentclass[12pt]{minimal} usepackage{amsmath} usepackage{wasysym} usepackage{amsfonts} usepackage{amssymb} usepackage{amsbsy} usepackage{mathrsfs} usepackage{upgreek} setlength{oddsidemargin}{-69pt} begin{document}$$X_{mathrm{m}} = 2sqrt {left( {d_x - c_x} right)^2 + left( {d_y - c_y} right)^2}$$end{document} X m = 2 d x - c x 2 + d y - c y 2 4 documentclass[12pt]{minimal} usepackage{amsmath} usepackage{wasysym} usepackage{amsfonts} usepackage{amssymb} usepackage{amsbsy} usepackage{mathrsfs} usepackage{upgreek} setlength{oddsidemargin}{-69pt} begin{document}$$Y_{mathrm{m}} = 2sqrt {left( {d_x} right)^2 + left( {d_y} right)^2}$$end{document} Y m = 2 d x 2 + d y 2 Capturing images of moving RBCs will require fewer or more scan lines depending on the relative velocity and direction of blood flow and laser scan. Therefore, sXYT image acquisition results in distortion of RBC image proportional to blood flow velocity and direction and laser scan parameters (Supplementary Fig. 2f, g ). Thus, by comparing the morphology of distorted RBC images, captured by sXYT, with the average baseline RBC shape, captured and calculated from fXYT imaging and Eqs. 1 – 4 , we can calculate the distance travelled (red stippled line in Supplementary Fig. 2f ) during RBC image capture and thus their velocity.
Measurement of RBC dimensions
X and Y during sXYT acquisition ( X s and Y s ), and subtraction of X m and Y m , provides the distance travelled along the x (Δ x ) and y (Δ y ) axes by RBCs under flow during their residence within the laser scan field (Supplementary Fig. 2h ). RBC residence time ( T ) during image capture could be calculated by Eq. ( 5 ). Using Eqs. ( 6 ) and ( 7 ) flow velocities along the x - and y -axes ( V x and V y ) could be calculated from Δ x and Δ y respectively. RBC velocity along the direction of flow could then be calculated independently from V x and V y using θ and cosine or sine transformation. 5 documentclass[12pt]{minimal} usepackage{amsmath} usepackage{wasysym} usepackage{amsfonts} usepackage{amssymb} usepackage{amsbsy} usepackage{mathrsfs} usepackage{upgreek} setlength{oddsidemargin}{-69pt} begin{document}$$T = frac{{|Y_{mathrm{s}}|}}{{{mathrm{Scan}},{mathrm{speed}}}}$$end{document} T = ∣ Y s ∣ Scan speed 6 documentclass[12pt]{minimal} usepackage{amsmath} usepackage{wasysym} usepackage{amsfonts} usepackage{amssymb} usepackage{amsbsy} usepackage{mathrsfs} usepackage{upgreek} setlength{oddsidemargin}{-69pt} begin{document}$$V_x = frac{{|X_{mathrm{s}} - X_{mathrm{m}}|}}{T}$$end{document} V x = ∣ X s - X m ∣ T 7 documentclass[12pt]{minimal} usepackage{amsmath} usepackage{wasysym} usepackage{amsfonts} usepackage{amssymb} usepackage{amsbsy} usepackage{mathrsfs} usepackage{upgreek} setlength{oddsidemargin}{-69pt} begin{document}$$V_y = frac{{|Y_{mathrm{s}} mp Y_{mathrm{m}}|}}{T}$$end{document} V y = ∣ Y s ∓ Y m ∣ T To avoid error caused by abnormal RBC rotation and adjacent RBCs, RBC velocity values obtained from V x and V y were compared after their conversion to each other using tangent transformation and θ . Values between flow angles ( θ ) of 15–75° or 105–165° were rejected when differing by more than ±34.1%. Values of θ between 0–15°, 75–105°, and 165–180°, V y and V x , respectively, offer inaccurate values and thus these angles were not subjected to this error check. To further decrease error, values were rejected that fell outside 2 σ ( θ = 15–75° and 105–165°) or a more stringent 1 σ (θ = 0–15°, 75–105°, and 165–180°). The software for performing RVDM analysis is provided in excel format as Supplementary Software 1 . A “Walk-through and trouble-shooting guide” is provided as Supplementary Note 1 .
Statistical analyses
Data are expressed as mean ± S.D. The principal statistical test was Students’ t -tests, Mann–Whitney U tests (for non-Gaussian distributed data) or the Tukey–Kramer tests (multiple comparisons) as appropriate. p -values given in the text are from independent samples analyzed by two-tailed t -tests. For multiple comparisons, p -values were corrected using a procedure based on the Tukey–Kramer method. Normality of data was assessed using the Kolmogorov–Smirnov tests. All tests run were two-tailed. All statistical analyses were conducted using KyPlot or Excel software. A p -value
📊 Figures
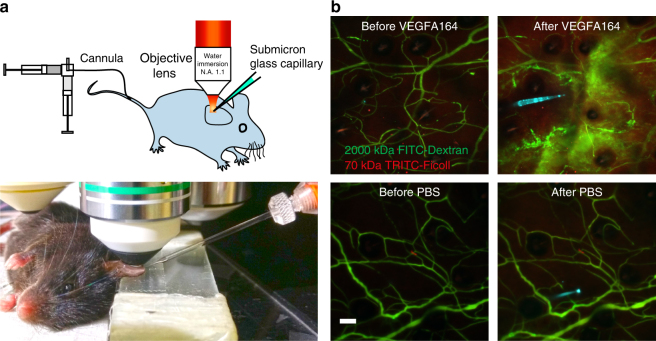
Fig. 1
Non-invasive imaging of the ear dermis vasculature. a Mice were anesthetized and immobilized to fix the ear under a water-immersion objective lens for intravital imaging. Cannulation of the tail vein ...
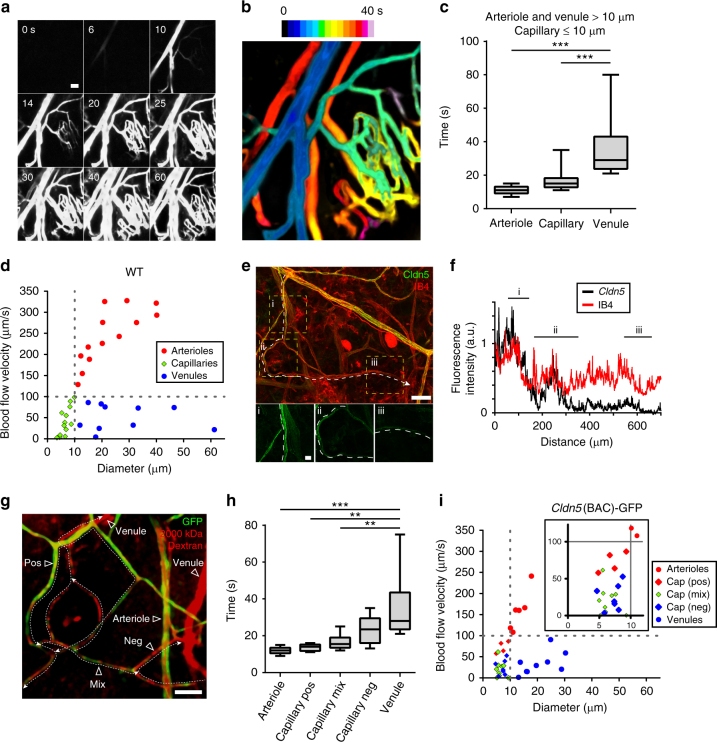
Fig. 2
Identification of vessel types in the ear dermis. a Distribution kinetics (frames shown at 0 up to 60u2009s after injection) of 2000u2009kDa FITC-Dextran injected as a bolus in the tail vein. Single-p...
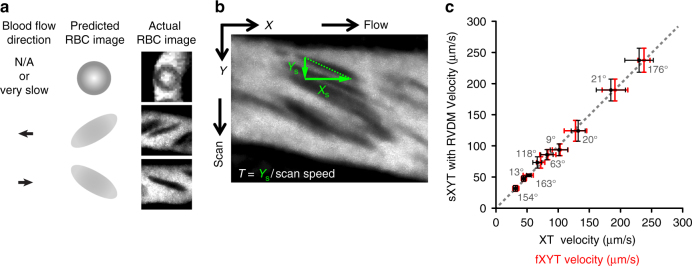
Fig. 3
RVDM principles and verification. a RBC image is influenced by the speed of laser scanning relative to blood flow velocity and direction resulting in distorted RBC dimensions. b sXYT imaging produces ...
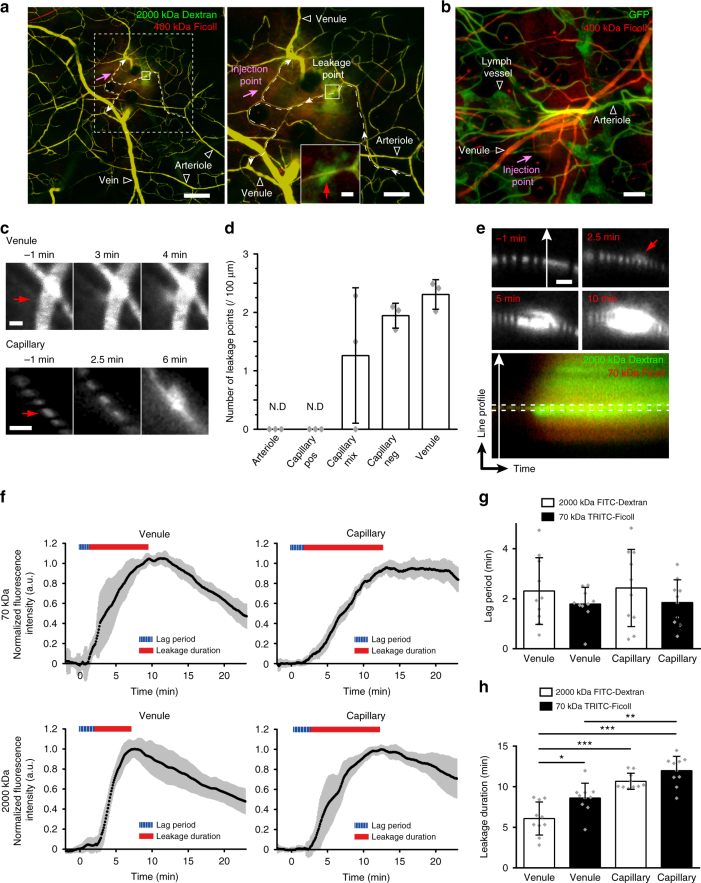
Fig. 4
Dynamics of VEGFA-induced vascular leakage. a Point of leakage of circulating 2000u2009kDa FITC-Dextran and 400u2009kDa TRITC-Ficoll in a large observation area (left) and zoom-in (right). Flow direct...
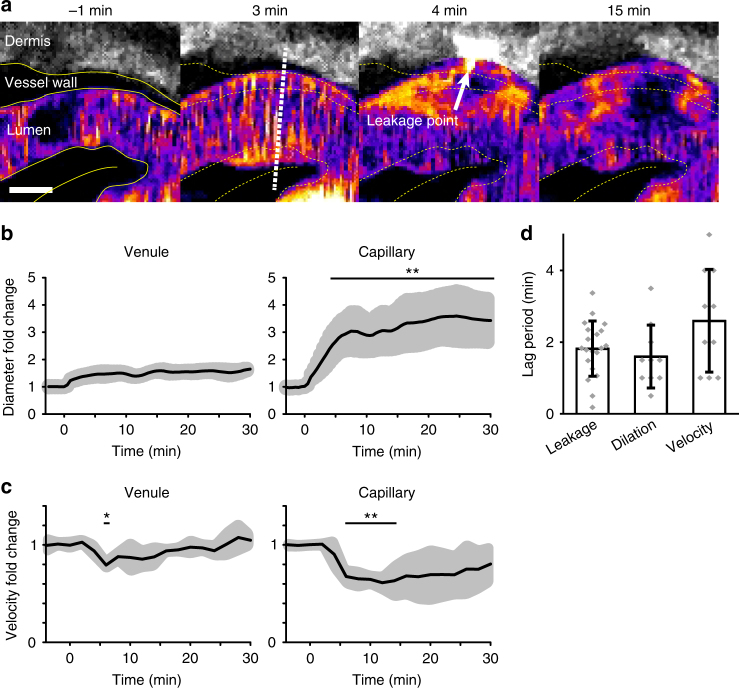
Fig. 5
Vasodilation and RBC velocity dynamics in response to VEGFA. a Illustration of vasodilation at a leakage point induced in response to VEGFA164 administration. Colors: 2000u2009kDa FITC-Dextran in lume...
Figure images are served from the NIH/NLM PubMed Central Open Access Subset or Europe PMC; copyright remains with the publishers and authors.
💬 Discussion
0 commentsNo comments yet. Be the first to start a discussion!
Leave a Comment