Abstract
Application of advanced intravital imaging facilitates dynamic monitoring of pathway activity upon therapeutic inhibition. Here, we assess resistance to therapeutic inhibition of the PI3K pathway within the hypoxic microenvironment of pancreatic ductal adenocarcinoma (PDAC) and identify a phenomenon whereby pronounced hypoxia-induced resistance is observed for three clinically relevant inhibitors. To address this clinical problem, we have mapped tumor hypoxia by both immunofluorescence and phosphorescence lifetime imaging of oxygen-sensitive nanoparticles and demonstrate that these hypoxic regions move transiently around the tumor. To overlay this microenvironmental information with drug response, we applied a FRET biosensor for Akt activity, which is a key effector of the PI3K pathway. Performing dual intravital imaging of drug response in different tumor compartments, we demonstrate an improved drug response to a combination therapy using the dual mTORC1/2 inhibitor AZD2014 with the hypoxia-activated pro-drug TH-302.
🔬 Techniques
🔭 Microscopes
✨ Fluorophores
🧪 Sample Preparation
🔬 Cell Lines
🏭 Microscope Brands
🧪 Reagent Suppliers
🏛️ Research Organizations (ROR)
Affiliated research institutions:
📋 Methods
Animal Experiments All animal experiments were conducted in compliance with Garvan Ethics Committee guidelines (13/17 and 16/13 protocols) and in accordance with the Australian code of practice for the care and use of animals for scientific purposes, with genotyping performed by Garvan Molecular Genetics (Sydney, NSW, Australia). Both male and female KP fl C and KPC GEM were monitored for swollen abdomen, cachexia, and reduced mobility until tumor was evident by palpation, and hypoxia markers were administered ( Hingorani et al., 2003 , Hingorani et al., 2005 , Morton et al., 2010 ). For xenografts experiments, 1 × 10 6 KPC primary PDAC cells in PBS were subcutaneously injected into the rear flank of 6- to 10-week-old female BALB/c-Fox1nuAusb mice. FACS Cells were fixed in 70% ethanol, prior to staining with propidium iodide (Sigma-Aldrich; P4170; 1 μg/mL) with RNaseA (Sigma-Aldrich; R6513; 500 μg/mL), and analysis on a FACSCanto II (BD Biosciences). Quantification was performed in FlowJo (Tree Star), and cell cycle phase was determined in ModFit (Verity Software House). Intravital FLIM/PLIM Imaging Xenografts of KPC cells expressing the Eevee-Akt-mT2 FRET biosensor were imaged at a final volume of 350 mm 3 , as per the tumor growth studies. Mice were anesthetized with xylazine (10 mg/kg) and Zoletil (50 mg/kg) and kept on a heated stage at 37°C. Anesthesia was maintained with isoflurane (3 L; O 2 , 1 L; vacuum, 1 L/min). Tumors were surgically exposed, as described previously ( Conway et al., 2017 , Vennin et al., 2017 ), prior to application of MitoImage NanO2 (10 μg; Ibidi; 74151). After 30 min, dual FLIM/PLIM imaging was performed on a Leica SP8 microscope with a 0.95 numerical aperture (NA), 25× water objective. Analysis of FLIM and PLIM decays was performed in FLIMfit ( Warren et al., 2013 ) and is presented as mean lifetime per cell.
Show full methods section
Animal Experiments All animal experiments were conducted in compliance with Garvan Ethics Committee guidelines (13/17 and 16/13 protocols) and in accordance with the Australian code of practice for the care and use of animals for scientific purposes, with genotyping performed by Garvan Molecular Genetics (Sydney, NSW, Australia). Both male and female KP fl C and KPC GEM were monitored for swollen abdomen, cachexia, and reduced mobility until tumor was evident by palpation, and hypoxia markers were administered ( Hingorani et al., 2003 , Hingorani et al., 2005 , Morton et al., 2010 ). For xenografts experiments, 1 × 10 6 KPC primary PDAC cells in PBS were subcutaneously injected into the rear flank of 6- to 10-week-old female BALB/c-Fox1nuAusb mice. FACS Cells were fixed in 70% ethanol, prior to staining with propidium iodide (Sigma-Aldrich; P4170; 1 μg/mL) with RNaseA (Sigma-Aldrich; R6513; 500 μg/mL), and analysis on a FACSCanto II (BD Biosciences). Quantification was performed in FlowJo (Tree Star), and cell cycle phase was determined in ModFit (Verity Software House). Intravital FLIM/PLIM Imaging Xenografts of KPC cells expressing the Eevee-Akt-mT2 FRET biosensor were imaged at a final volume of 350 mm 3 , as per the tumor growth studies. Mice were anesthetized with xylazine (10 mg/kg) and Zoletil (50 mg/kg) and kept on a heated stage at 37°C. Anesthesia was maintained with isoflurane (3 L; O 2 , 1 L; vacuum, 1 L/min). Tumors were surgically exposed, as described previously ( Conway et al., 2017 , Vennin et al., 2017 ), prior to application of MitoImage NanO2 (10 μg; Ibidi; 74151). After 30 min, dual FLIM/PLIM imaging was performed on a Leica SP8 microscope with a 0.95 numerical aperture (NA), 25× water objective. Analysis of FLIM and PLIM decays was performed in FLIMfit ( Warren et al., 2013 ) and is presented as mean lifetime per cell.
Organotypic Assay
Organotypic matrices were generated as described previously ( Conway et al., 2014 , Morton et al., 2010 , Vennin et al., 2017 ). Quantification of the invasive and proliferative indices was performed on pan-cytokeratin (excludes fibroblasts) or Ki67-stained sections, respectively. IC 50 Curves IC 50 curves were performed in a 96-well plate format, with 1,000 cells/well. Cells were incubated for 24 hr after seeding before addition of inhibitors. Plates were assessed for relative cell density using the CellTiter 96 AQueous Cell Proliferation Assay (Promega; G1111) at 72 hr after addition of each inhibitor, with parallel plates incubated under standard normoxic or hypoxic (0.1% oxygen) conditions. IC 50 curves were then fit in Prism (GraphPad Software), normalizing to the vehicle (DMSO) control treatments from the respective normoxic or hypoxic (0.1% oxygen) conditions.
Statistical Analysis
Statistical tests were performed in Prism (GraphPad Software) with statistical significance given as ∗ p < 0.05, ∗∗ p < 0.01, and ∗∗∗ p < 0.001 in all cases. A one-sample t test was performed on normalized data. For IC 50 curve comparisons, an extra sum-of-squares F test was performed between the best-fit parameters of each curve. Deming regression curves for the dual FLIM/PLIM analysis were plotted with the “mcr” package of R, using the analytical method to calculate the 95% confidence intervals. To assess whether the Deming regression slopes were significantly non-zero, a one-sample t test was performed. DNA cell cycle analysis was assessed for significance using a two-way ANOVA test with a Tukey correction for multiple comparisons. In all other cases, a Student two-tailed parametric t test was performed. Detailed protocols can be found in Supplemental Experimental Procedures .
Supplemental Information Document S1. Supplemental Experimental Procedures, Figures S1–S6, and Tables S1 and S2 Document S2. Article plus Supplemental Information
📊 Figures
Figureu00a01
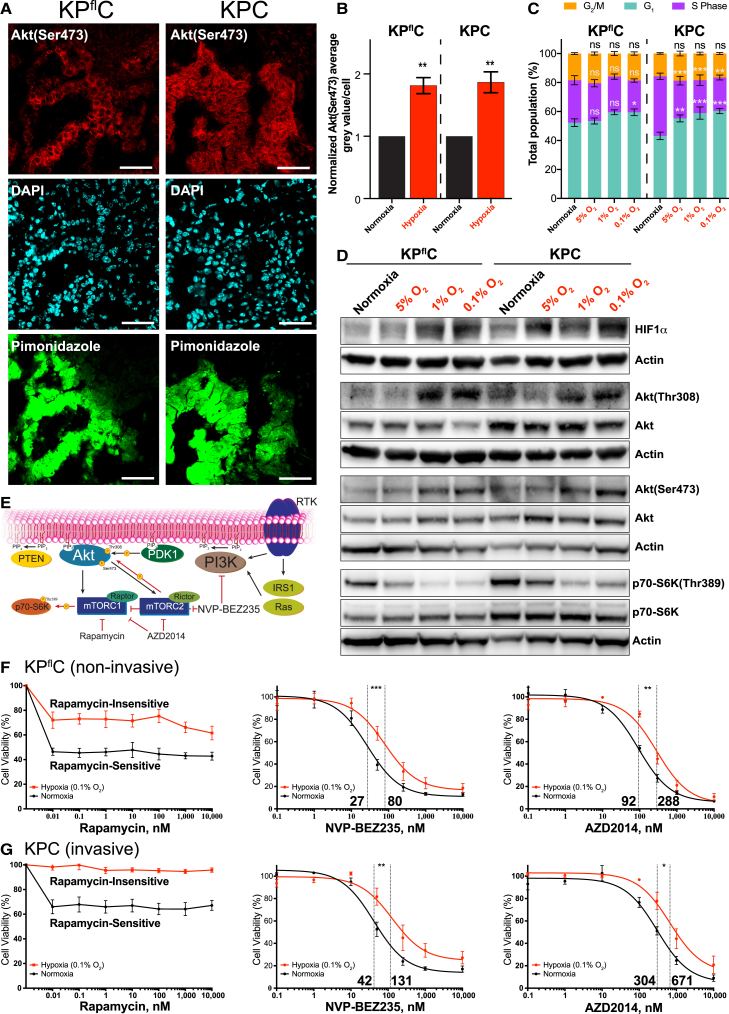
The Presence of Hypoxia and the Associated Molecular, Phenotypic, and Resistance Effects in the KP fl C and KPC Mouse Modelsu00a0ofu00a0PDAC (A) Immunofluorescence staining of the GEM KP fl C and KPC ...
Figureu00a02
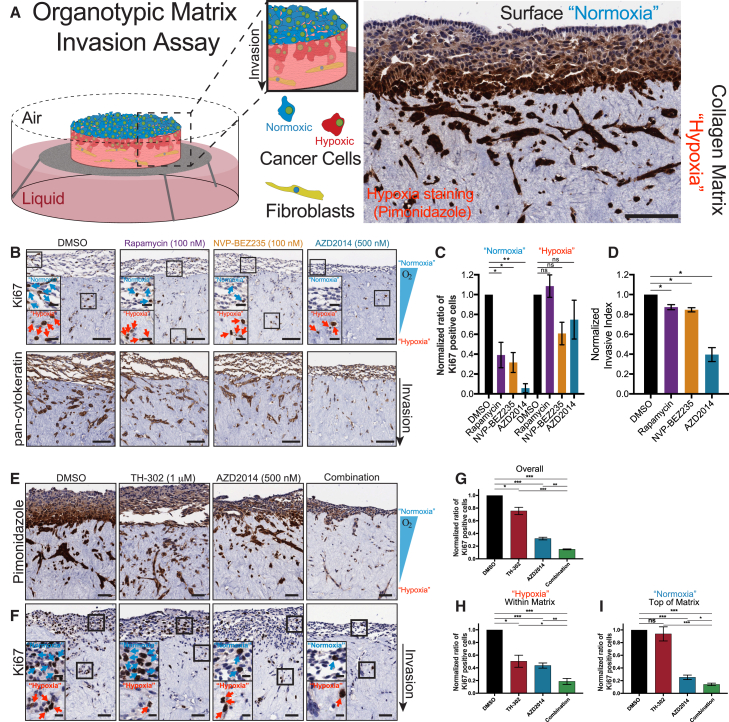
Organotypic Invasion Assay of KPC Cells Treated with PI3K Pathway Inhibitors and/or TH-302 (A) A schematic representation of the organotypic matrix assay and a representative area of invading KPC cell...
Figureu00a03
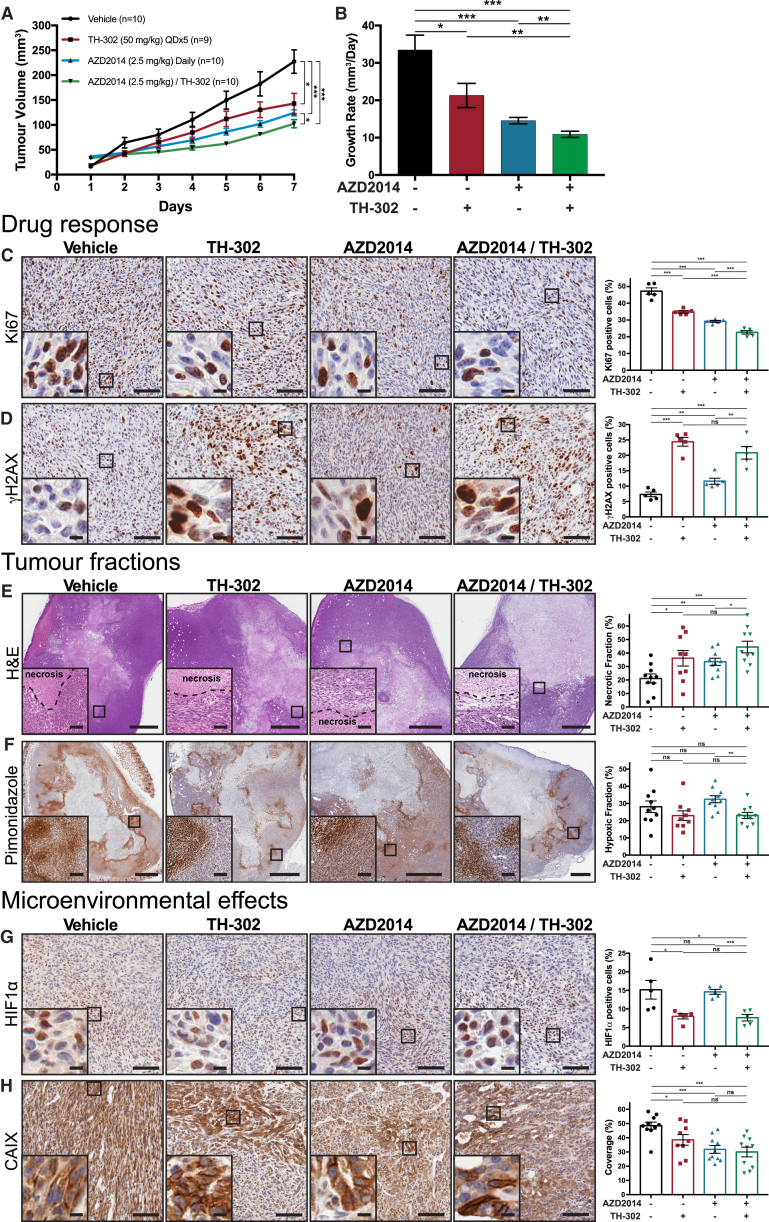
Assessment of KPC Subcutaneous Xenografts Treated with TH-302 (50u00a0mg/kg) and AZD2014 (2.5u00a0mg/kg) (A and B) Tumor volume measurements (A) and average linear growth rate (B) of tumors over 7u00a...
Figureu00a04
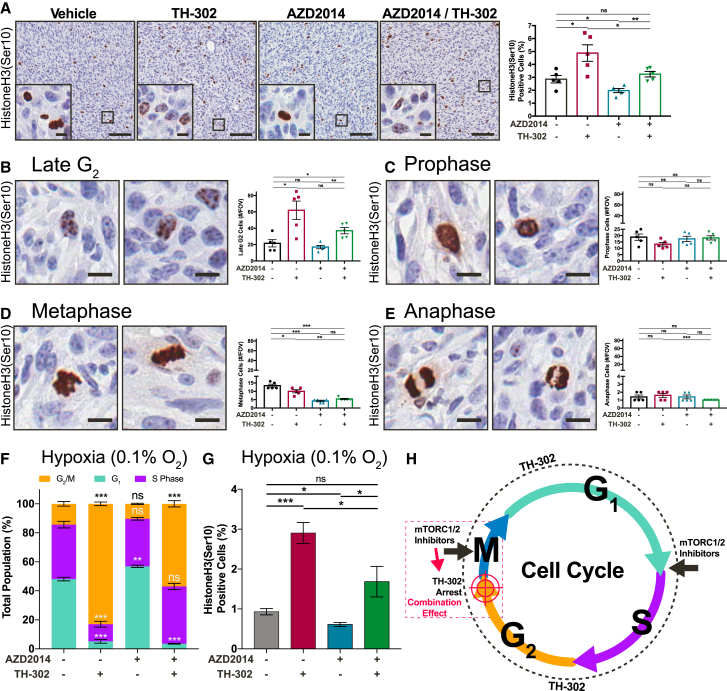
Characterization of the Cell Cycle Response of KPC Subcutaneous Xenografts Treated with TH-302 (50u00a0mg/kg) and AZD2014 (2.5u00a0mg/kg) (A) IHC staining of drug response in tumors assessed for the m...
Figureu00a05
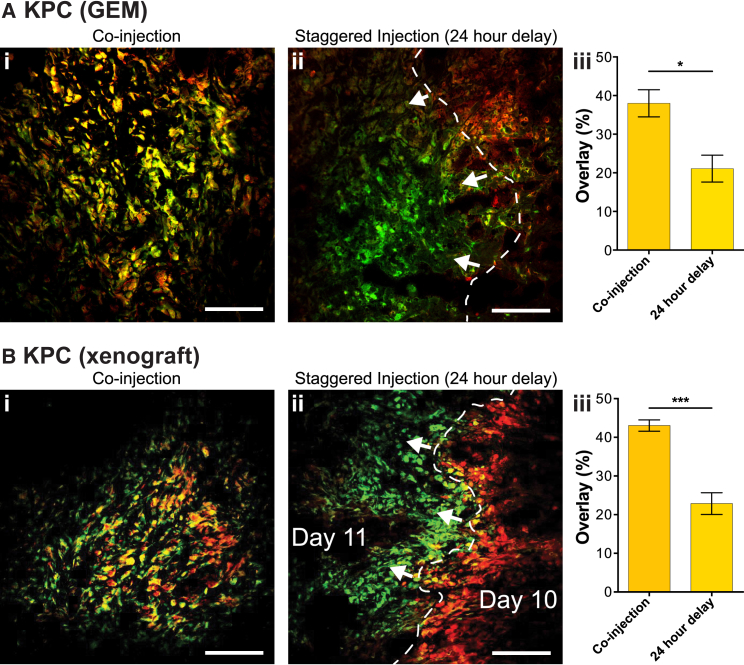
Tracking of Tumor Hypoxia with EF5 and Pimonidazole (A and B) Immunofluorescence of (A) KPC GEM tumors and (B) KPC xenograft tumors for EF5 (red) and pimonidazole (green), chemical indicators ofu00a0t...
Figureu00a06
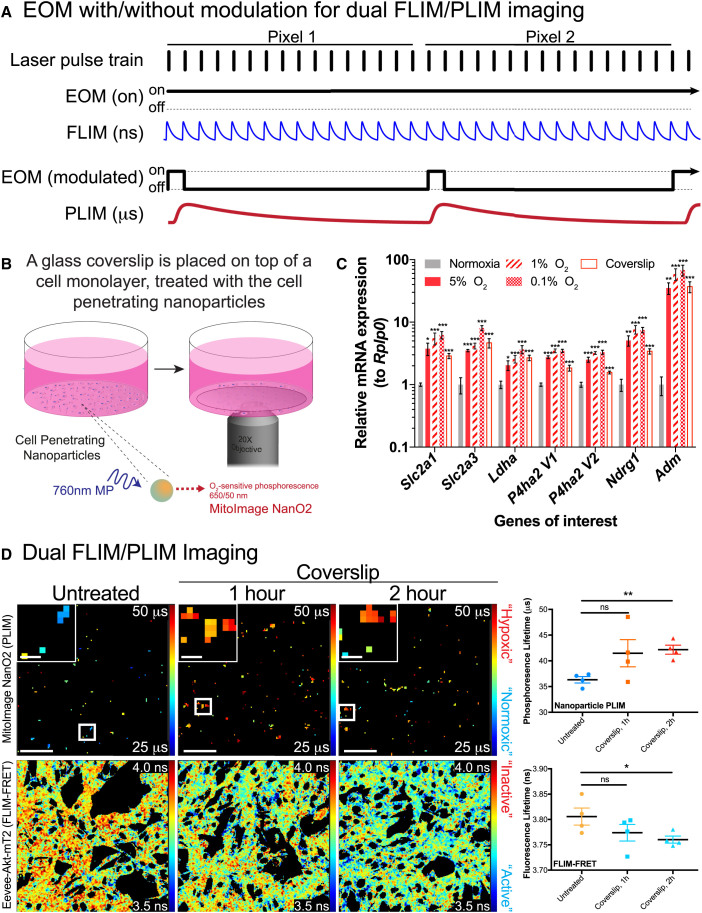
Dual FLIM/PLIM Imaging of KPC Cells Stably Expressing the Eevee-Akt-mT2 Intramolecular FRET Biosensor, Treated with Oxygen-Sensitive Nanoparticles (A) A schematic illustration of the methodology appli...
Figureu00a07
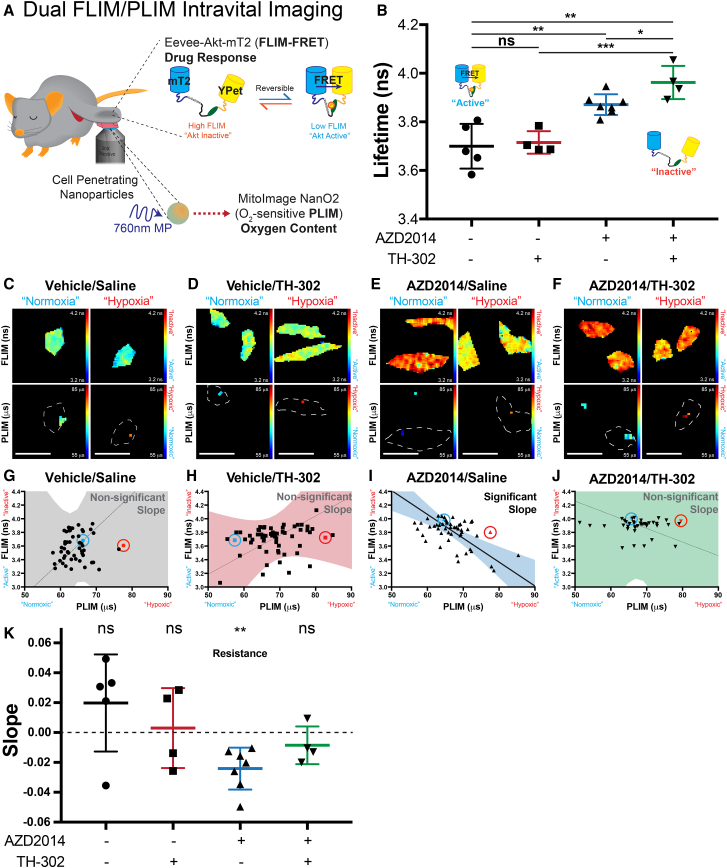
Dual FLIM/PLIM Intravital Imaging of Drug Response and Tumor Oxygen Content (A) A schematic representation of the intravital imaging setup for the dual FLIM/PLIM imaging. Xenografts of KPC cells stabl...
Figure images are served from the NIH/NLM PubMed Central Open Access Subset or Europe PMC; copyright remains with the publishers and authors.
💬 Discussion
0 commentsNo comments yet. Be the first to start a discussion!
Leave a Comment