Abstract
G-quadruplex (G4) can be formed by G-rich DNA sequences that are widely distributed throughout the human genome. Although G-triplex and G-hairpin have been proposed as G4 folding intermediates, their formation still requires further investigation by experiments. Here, we employed single-molecule FRET to characterize the folding dynamics of G4 from human telomeric sequence. First, we observed four states during G4 folding initially assigned to be anti-parallel G4, G-triplex, G-hairpin and unfolded ssDNA. Then we constructed putative intra-strand G-triplex, G-hairpin structures and confirmed their existences in both NaCl and KCl. Further studies revealed those structures are going through dynamic transitions between different states and show relatively weak dependence on cations, unlike G4. Based on those results and molecular dynamics simulations, we proposed a multi-pathway folding mechanism for human telomeric G4. The present work may shed new light on our current understanding about the existence and stability of G4 intermediate states.
🔬 Techniques
✨ Fluorophores
🏭 Microscope Brands
🧪 Reagent Suppliers
📷 Detectors
💻 Software Details
🏛️ Research Organizations (ROR)
Affiliated research institutions:
📋 Methods
DNA constructs
All oligonucleotides required to make the DNA substrates were purchased from Sangon Biotech (Shanghai, China). Sequences and labeling positions of all the oligonucleotides were listed in Supplementary Table S1 . For DNA constructs used in smFRET measurements, DNA was annealed with 1:3 mixture of the stem and G4 or ssDNA strands by incubating the mixture at 95°C for 5 min, then slowly cooling down to room temperature in about 7 h. The strand without biotin was used in excess to reduce the possibility of having non-annealed strand anchored at the coverslip surface. The concentration of stem strand was 2.5 μM and all annealing were carried out in annealing buffer containing 20 mM Tris–HCl, pH 8.0 with different concentrations of NaCl or KCl. Buffers Buffers containing 20 mM Tris–HCl, pH 8.0 with different concentrations of NaCl or KCl were used. For single-molecule FRET measurements, 0.8% D-glucose, 1 mg/ml glucose oxidase (266600 units/g, Sigma), 0.4 mg/ml catalase (2000–5000 units/mg, Sigma) and 4 mM Trolox were added to prevent the photobleaching and photoblinking. Single-molecule fluorescence data acquisition Single-molecule FRET study was carried out with a home-built objective-type total-internal-reflection microscopy. Cy3 was excited by 532 nm Sapphire laser (Coherent Inc., USA). An oil immersion objective (100 ×, N.A.1.49) was used to generate an evanescent field of illumination. Fluorescence signal from Cy3 and Cy5 were split by a dichroic mirror, and finally collected by an electron-multiplying charge-coupled device camera (iXON, Andor Technology, South Windsor, CT, USA). The coverslips (Fisher Scientific, USA) and slides were cleaned thoroughly by a mixture of sulfuric acid and hydrogen peroxide, acetone and sodium ethoxide, then the surfaces of coverslip were coated with a mixture of 99% mPEG (m-PEG-5000, Laysan Bio, Inc.) and 1% of biotin-PEG (biotin-PEG-5000, Laysan Bio, Inc.). Streptavidin (10 μg/ml) were added to the microfluidic chamber made of the PEG coated coverslip, and incubated for 10 min. After washing, 50 pM DNA were added to the chamber and allowed to be immobilized for 10 min. Then free DNA was removed by washing with the imaging buffer (20 mM Tris–HCl, pH 8.0, different concentrations of NaCl or KCl, 0.8% D-glucose, 1 mg/ml glucose oxidase, 0.4 mg/ml catalase and 4 mM Trolox). We used an exposure time of 100 ms for all single-molecule measurements at a constant temperature of 22°C. FRET data analyses The FRET efficiency was calculated using I A /(I D +I A ), where I D and I A represent the intensity of donor and acceptor respectively. The FRET value above 1 is due to background subtraction from very low intensity in the donor channel, giving rise to negative donor intensity. Basic data analysis was carried out by scripts written in Matlab, and all data fitting were generated by Origin 8.0. Single-molecule FRET histograms were generated by picking the initial 50–100 frames of each trace from ∼300 molecules, and fitted by multi-peak Guassian distributions, with the peak position unconstrained. Transition density plots (TDP) ( 48 ) were constructed from smFRET traces showing dynamic transitions using free available Hidden Markov Model (HMM) and TDP software from Professor Taekjip Ha’s website ( http://bio.physics.illinois.edu/HaMMy.asp ). Circular dichroism spectropolarimetry CD experiments were performed with a Bio-Logic MOS450 / AF-CD optical system (BioLogic Science Instruments, France) equipped with a temperature controlled cell holder, using a quartz cell with 1-mm path length. A 2 μM solution of DNA was prepared in 20 mM Tris–HCl, pH 8.0 with different cation. The solution was incubated at 95°C for 5 min, then slowly cooled down to room temperature in about 7 h. CD spectra were recorded in the UV (220–320 nm) regions in 0.75 nm increments with an averaging time of 2 s at 25°C.
Show full methods section
DNA constructs
All oligonucleotides required to make the DNA substrates were purchased from Sangon Biotech (Shanghai, China). Sequences and labeling positions of all the oligonucleotides were listed in Supplementary Table S1 . For DNA constructs used in smFRET measurements, DNA was annealed with 1:3 mixture of the stem and G4 or ssDNA strands by incubating the mixture at 95°C for 5 min, then slowly cooling down to room temperature in about 7 h. The strand without biotin was used in excess to reduce the possibility of having non-annealed strand anchored at the coverslip surface. The concentration of stem strand was 2.5 μM and all annealing were carried out in annealing buffer containing 20 mM Tris–HCl, pH 8.0 with different concentrations of NaCl or KCl. Buffers Buffers containing 20 mM Tris–HCl, pH 8.0 with different concentrations of NaCl or KCl were used. For single-molecule FRET measurements, 0.8% D-glucose, 1 mg/ml glucose oxidase (266600 units/g, Sigma), 0.4 mg/ml catalase (2000–5000 units/mg, Sigma) and 4 mM Trolox were added to prevent the photobleaching and photoblinking. Single-molecule fluorescence data acquisition Single-molecule FRET study was carried out with a home-built objective-type total-internal-reflection microscopy. Cy3 was excited by 532 nm Sapphire laser (Coherent Inc., USA). An oil immersion objective (100 ×, N.A.1.49) was used to generate an evanescent field of illumination. Fluorescence signal from Cy3 and Cy5 were split by a dichroic mirror, and finally collected by an electron-multiplying charge-coupled device camera (iXON, Andor Technology, South Windsor, CT, USA). The coverslips (Fisher Scientific, USA) and slides were cleaned thoroughly by a mixture of sulfuric acid and hydrogen peroxide, acetone and sodium ethoxide, then the surfaces of coverslip were coated with a mixture of 99% mPEG (m-PEG-5000, Laysan Bio, Inc.) and 1% of biotin-PEG (biotin-PEG-5000, Laysan Bio, Inc.). Streptavidin (10 μg/ml) were added to the microfluidic chamber made of the PEG coated coverslip, and incubated for 10 min. After washing, 50 pM DNA were added to the chamber and allowed to be immobilized for 10 min. Then free DNA was removed by washing with the imaging buffer (20 mM Tris–HCl, pH 8.0, different concentrations of NaCl or KCl, 0.8% D-glucose, 1 mg/ml glucose oxidase, 0.4 mg/ml catalase and 4 mM Trolox). We used an exposure time of 100 ms for all single-molecule measurements at a constant temperature of 22°C. FRET data analyses The FRET efficiency was calculated using I A /(I D +I A ), where I D and I A represent the intensity of donor and acceptor respectively. The FRET value above 1 is due to background subtraction from very low intensity in the donor channel, giving rise to negative donor intensity. Basic data analysis was carried out by scripts written in Matlab, and all data fitting were generated by Origin 8.0. Single-molecule FRET histograms were generated by picking the initial 50–100 frames of each trace from ∼300 molecules, and fitted by multi-peak Guassian distributions, with the peak position unconstrained. Transition density plots (TDP) ( 48 ) were constructed from smFRET traces showing dynamic transitions using free available Hidden Markov Model (HMM) and TDP software from Professor Taekjip Ha’s website ( http://bio.physics.illinois.edu/HaMMy.asp ). Circular dichroism spectropolarimetry CD experiments were performed with a Bio-Logic MOS450 / AF-CD optical system (BioLogic Science Instruments, France) equipped with a temperature controlled cell holder, using a quartz cell with 1-mm path length. A 2 μM solution of DNA was prepared in 20 mM Tris–HCl, pH 8.0 with different cation. The solution was incubated at 95°C for 5 min, then slowly cooled down to room temperature in about 7 h. CD spectra were recorded in the UV (220–320 nm) regions in 0.75 nm increments with an averaging time of 2 s at 25°C.
Gel electrophoresis assay
A total of 12 nt poly-T sequence was labeled by FAM fluorophore at 3′ end for visualization (T 12 -FAM, Supplementary Table S1 ). DNA for gel assay was annealed with 1:1 mixture of T 12 -FAM and 3G2 or 4G2 sequences by incubating the mixture at 95°C for 5 min in 100 mM NaCl or KCl, then slowly cooling down to room temperature in about 7 h. Afterward both T 12 -FAM and annealing products were subjected to 15% native PAGE (polyacrylamide gel electrophoresis), run at room temperature and visualized by Gel imaging analysis system (Gel Doc-It310, UVP, USA).
MD simulations
MD simulations and available volume (AV) simulations were performed to calculate the FRET efficiencies for several DNA constructs ( 25 , 49 ). To get the initial conformations for AV simulations, we carried out all-atom MD simulations for anti-parallel G4, hybrid-2 G4, 2-tetrad anti-parallel G4, G-triplex and G-hairpin using GROMACS5.0.6 with AMBER99SB-ILDN force field ( 50 ). The solvent (water model: TIP3P) and 100 mM KCl were added to build a charge-neutral system. We chose KCl as G4 was known to be more stable when the central ion is K + compared with Na + ( 17 ). All systems were energy-minimized and equilibrated successfully. MD simulations were performed at 1 bar and 298 K with Parrinello-Rahman pressure coupling ( 51 ) and Velocity-rescaling temperature coupling schemes ( 52 ). For each system, the simulations were run for 100 ns according to previous studies ( 25 , 44 ). The constructs of anti-parallel G4 (2MCO.pdb), hybrid-2 G4 (2JSL.pdb) and 2-tetrad anti-parallel G4 (2KF8.pdb) were taken from RCSB Protein Data Bank. The anti-parallel G4 structure in 2MCO is highly consistent with 143D which has been chosen by several earlier MD simulation studies ( 44 , 53 ). G-triplex and G-hairpin were constructed from the mutation of anti-parallel G4 according to the sequences in Supplementary Table S1 . Relevant nucleotides of anti-parallel G4 were replaced with dTs, and energy-minimization was run for 100 ps before further MD simulations. The double-stranded DNA was built in Nucleic Acid Builder. Available volume simulations The AV simulations were performed to calculate the FRET efficiency for each system ( 49 ). Frames for AV simulations were extracted from the MD simulation trajectories by every 10 ps, implying that there are 10 000 frames for each of the five systems. The parameters for Cy3/Cy5 dye pairs are listed in Supplementary Table S2 . During AV simulations, the atom O3′ of the last nucleotide in the G4 constructs was selected as the attachment point for Cy3 and the methyl group carbon atom C7 of T6 in the complementary stand was selected as the attachment point for Cy5. Hydrogen atoms which were attached to the O3′ and C7 atoms were deleted before AV simulations. The Förster radius was set as 60 Å ( 47 ).
Supplementary Material Supplementary Data Click here for additional data file.
📊 Figures
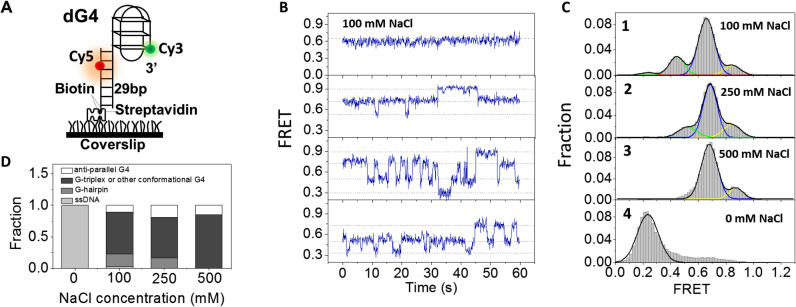
Figure 1.
Conformational dynamics of G4 at the 3u2032 end of duplex DNA in NaCl. ( A ) Schematic representation of experimental set-up. ( B ) Representative smFRET traces of dG4 in 100 mM NaCl. ( C ) FRET histo...
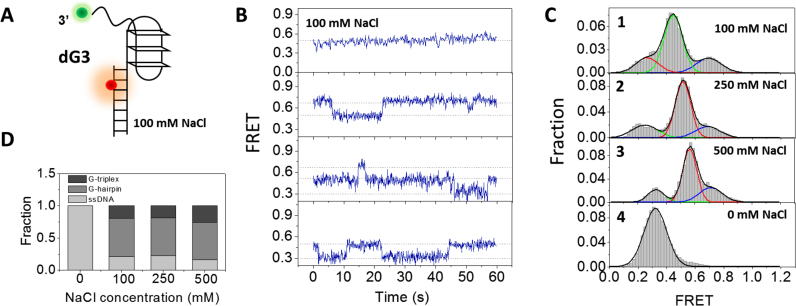
Figure 2.
Conformational dynamics of G-triplex at the 3u2032 end of duplex DNA in NaCl. ( A ) Design of dG3 substrate. ( B ) Representative traces of dG3 in 100 mM NaCl. ( C ) FRET histograms of dG3 in 20 mM Tr...
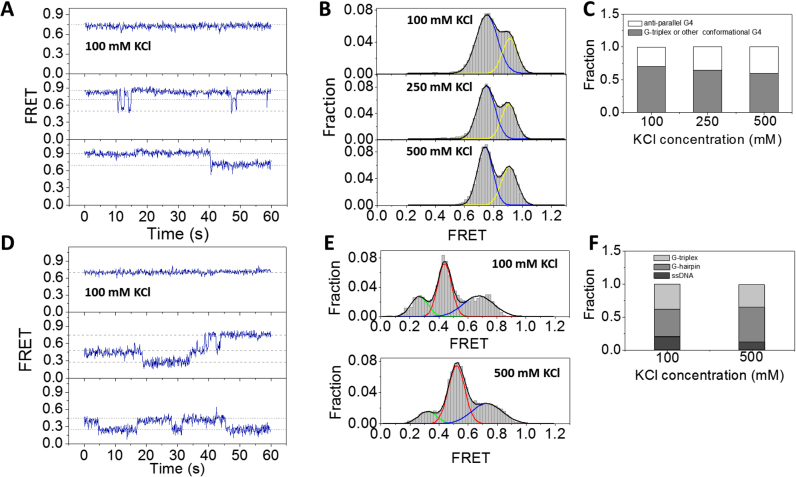
Figure 3.
Conformational dynamics of G4 and G-triplex at 3u2032 end of duplex DNA in KCl. ( A ) Representative traces of dG4 in 100 mM KCl. ( B ) In 100u2013500 mM KCl, the FRET histograms of dG4 display two pe...
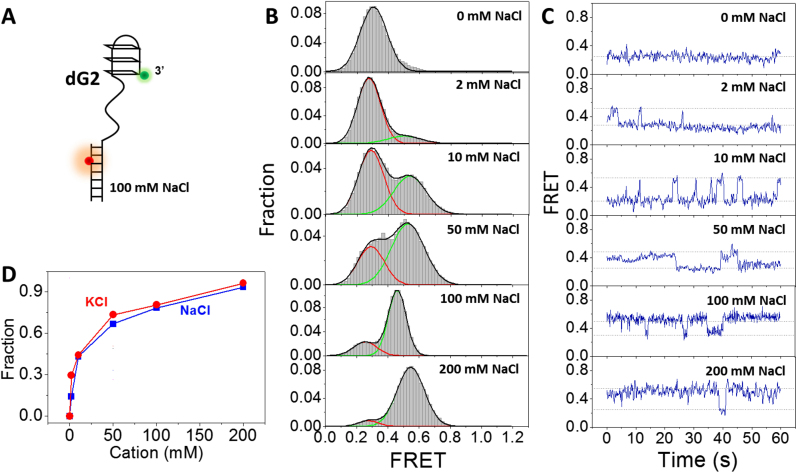
Figure 4.
Formation of G-hairpin at the 3u2032 end of ss/dsDNA. ( A ) Design of dG2 substrate. ( B ) FRET distributions of dG2 in 0u2013200 mM NaCl. Single-peak and two-peak Gaussian distributions were used to ...
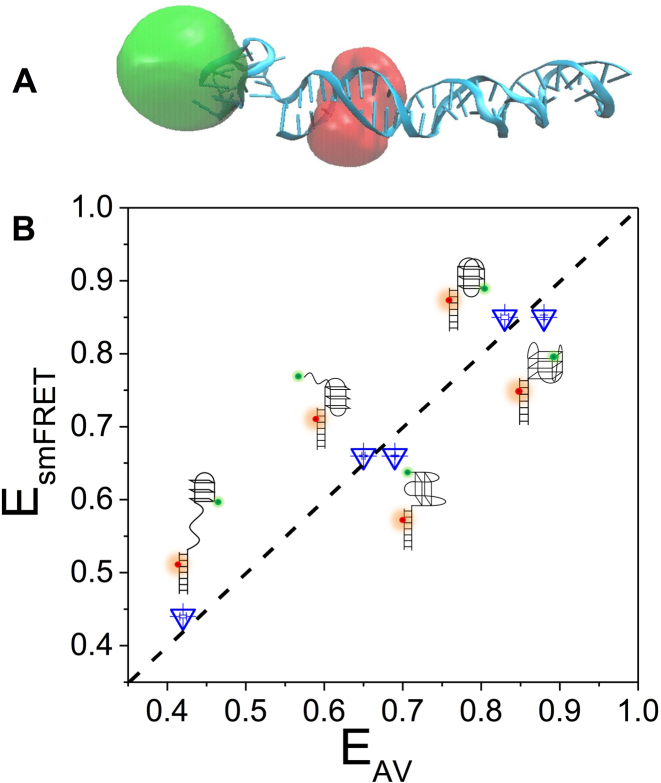
Figure 5.
Molecular dynamics simulations. ( A ) Selective structure of anti-parallel G4 adjacent to duplex DNA. Donor and acceptor positions were obtained using AV approach and shown as clouds. ( B ) FRET effic...
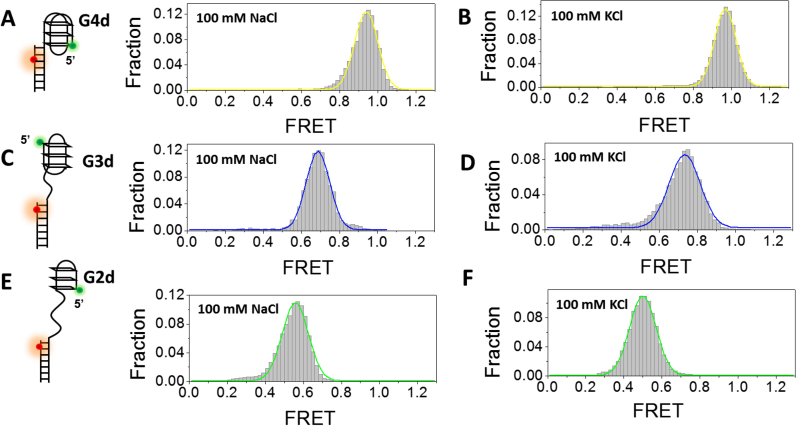
Figure 6.
Formation of G4, G-triplex and G-hairpin at the 5u2032 end of a duplex DNA in 100 mM NaCl or KCl. ( A ) smFRET histograms of G4d in 100 mM NaCl has 1 peak at E 0.94 . ( B ) smFRET histograms of G4d st...
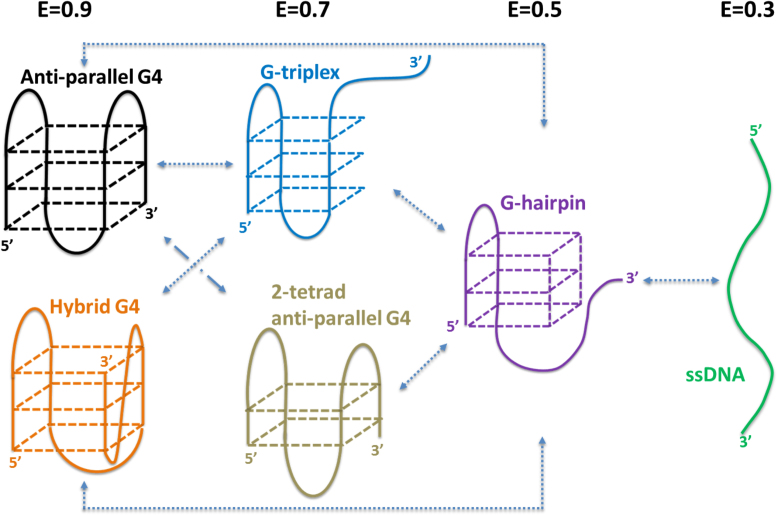
Figure 7.
Proposed folding pathway of human telomeric G4 at 3u2032 end of duplex DNA.
Figure images are served from the NIH/NLM PubMed Central Open Access Subset or Europe PMC; copyright remains with the publishers and authors.
💬 Discussion
0 commentsNo comments yet. Be the first to start a discussion!
Leave a Comment