Abstract
Summary Leucine‐rich repeat‐receptor‐like proteins (LRR‐RLPs) and LRR‐receptor‐like kinases (LRR‐RLKs) trigger immune signalling to promote plant resistance against pathogens. LRR‐RLPs lack an intracellular kinase domain, and several of these receptors have been shown to constitutively interact with the LRR‐RLK Suppressor of BIR1‐1/EVERSHED (SOBIR1/EVR) to form signalling‐competent receptor complexes. Ligand perception by LRR‐RLPs initiates recruitment of the co‐receptor BRI1‐Associated Kinase 1/Somatic Embryogenesis Receptor Kinase 3 (BAK1/SERK3) to the LRR‐RLP/SOBIR1 complex, thereby activating LRR‐RLP‐mediated immunity. We employed phosphorylation analysis of in planta ‐produced proteins, live cell imaging, gene silencing and co‐immunoprecipitation to investigate the roles of SOBIR1 and BAK1 in immune signalling. We show that Arabidopsis thaliana ( At ) SOBIR1, which constitutively activates immune responses when overexpressed in planta , is highly phosphorylated . Moreover, in addition to the kinase activity of SOBIR1 itself, kinase‐active BAK1 is essential for At SOBIR1‐induced constitutive immunity and for the phosphorylation of At SOBIR1. Furthermore, the defence response triggered by the tomato LRR‐RLP Cf‐4 on perception of Avr4 from the extracellular pathogenic fungus Cladosporium fulvum is dependent on kinase‐active BAK1. We argue that, in addition to the trans‐autophosphorylation of SOBIR1, it is likely that SOBIR1 and BAK1 transphosphorylate, and thereby activate the receptor complex. The signalling‐competent cell surface receptor complex subsequently activates downstream cytoplasmic signalling partners to initiate RLP‐mediated immunity.
🔬 Techniques
🔭 Microscopes
🧬 Organisms
💻 Software
✨ Fluorophores
🧪 Sample Preparation
🏭 Microscope Brands
🧪 Reagent Suppliers
📷 Detectors
💻 Software Details
🏛️ Research Organizations (ROR)
Affiliated research institutions:
📋 Methods
Binary vectors for Agrobacterium ‐mediated transformation and VIGS The constructs pBIN‐KS‐35S:: At SOBIR1‐eGFP, pBIN‐KS‐35S:: At SOBIR1 D489N ‐eGFP, pBIN‐KS‐35S:: Sl SOBIR1‐eGFP, pBIN‐KS‐35S:: Sl SOBIR1 D486N ‐eGFP, pBIN‐KS‐35S:: Sl Cf‐4‐eGFP, pGWB20‐35S:: Sl SERK3‐myc, pGWB20‐35s:: Sl SOBIR1‐Myc and pGWB20‐35s:: At SOBIR1‐Myc have been described previously (Liebrand et al. , 2012 , 2013 ). At BAK1‐Myc has been described by Halter et al . ( 2014b ). Avr4 was expressed using the pMOG800 construct (Van der Hoorn et al. , 2000 ). P19 (Voinnet et al. , 2015 ), pBIN61‐GUS, pTRV1 (Liu et al. , 2002 , b ), pTRV2: GUS (Tameling and Baulcombe, 2007 ) and pTRV2: NbSERK3a/b (Heese et al. , 2007 ) have been described elsewhere. At BAK1, At BAK1 C408Y and At BAK1 D416N originate from Schwessinger et al. ( 2011 ). GFP‐LTI6b has been described previously (Kurup et al. , 2005 ). At FLS2‐eGFP and Sl FLS2‐eGFP were described by Robatzek et al. ( 2006 , 2007 ). Sl SOBIR1‐cYFP, Sl SOBIR1‐nYFP and Sl Cf‐4‐cYFP (Postma et al. , 2016 ), and pACA8::ACA8‐mCherry, At FLS2‐cYFP and At FLS2‐nYFP (Frei dit Frey et al. , 2012 ), have been described elsewhere.
Plant growth conditions
Nicotiana tabacum (tobacco) (cv. SR1 and cv. Samsun) and N. benthamiana [wild‐type and N. benthamiana stably expressing SlCf‐4 under its native promoter (referred to as N. benthamiana:Cf‐4 ; Gabriëls et al. , 2006 ] were grown under 16 h light at 25 °C and 8 h darkness at 21 °C, with ~75% relative humidity. VIGS in tobacco and N. benthamiana VIGS using TRV‐based vectors was performed in tobacco (cv. Samsun) and N. benthamiana:Cf‐4 as described previously (Liebrand et al. , 2012 ; Zhang et al. , 2013b ). Agrobacterium ‐mediated transient transformation Agrobacterium ‐mediated transient transformations (agroinfiltrations) were performed as described previously (Van der Hoorn et al. , 2000 ). Binary constructs expressing affinity‐tagged proteins were agroinfiltrated with Agrobacterium tumefaciens cultures at an OD 600 of 1 in combination with P19 at an OD 600 of 1, unless indicated otherwise. Leaves were harvested for protein isolation and IP at 2 dpi, unless indicated otherwise. Percentages of HR were quantified by visual scoring for full HR (100%), mildly reduced HR (60%), strongly reduced HR (30%) and no HR (0%). IPs, IB, phosphorylation analysis and MAPK activation analysis IPs and co‐IPs were performed as described previously (Liebrand et al. , 2013 ). To detect phosphorylated proteins, a protein extraction buffer was used as described by Karlova et al . ( 2006 , 2009 ), with minor modifications; instead of Tris and Triton‐X, 100 m m NaPi (pH 7.2) and 1% IGEPAL CA‐630 (NP40) were used, respectively. Pre‐cast TGX gels were used for Pro‐Q and Sypro Ruby analyses (Bio‐Rad, Veenendaal, the Netherlands, #456‐1095). Pro‐Q diamond phosphoprotein gel stains and subsequent Sypro Ruby stains were performed according to the manufacturer’s recommendations (Invitrogen, Life Technologies, Carlsbad, CA, USA; Taylor et al. , 2013 ). TGX stain‐free gels were used for all other protein analyses (Bio‐Rad, #456‐8085), and total protein was visualized using the stain‐free method or with Coomassie Brilliant Blue (CBB). The following antibodies were used for protein detection on IB: αGFP‐HRP (130‐091‐833, MACS antibodies, Bergisch Gladbach, Germany), αMyc (cMyc9E10, sc‐40, Santa Cruz Biotechnology, Heidelberg, Germany), αMouse‐HRP (GE Healthcare, Eindhoven, The Netherlands), anti‐p42/p44‐erk (NEB: Bioké Dellaertweg 9b 2316 WZ, Leiden) and goat anti‐rabbit (Sigma Zwijndrecht, the Netherlands). Band intensities were measured using Image Lab software (Bio‐Rad), and ratios were calculated as indicated in the figures. To quantify immunoprecipitated protein bands, the ribulose‐1,5‐bisphosphate carboxylase/oxygenase (Rubisco) background band in the IP sample was taken as an internal standard for the total protein concentration of the sample.
Show full methods section
Binary vectors for Agrobacterium ‐mediated transformation and VIGS The constructs pBIN‐KS‐35S:: At SOBIR1‐eGFP, pBIN‐KS‐35S:: At SOBIR1 D489N ‐eGFP, pBIN‐KS‐35S:: Sl SOBIR1‐eGFP, pBIN‐KS‐35S:: Sl SOBIR1 D486N ‐eGFP, pBIN‐KS‐35S:: Sl Cf‐4‐eGFP, pGWB20‐35S:: Sl SERK3‐myc, pGWB20‐35s:: Sl SOBIR1‐Myc and pGWB20‐35s:: At SOBIR1‐Myc have been described previously (Liebrand et al. , 2012 , 2013 ). At BAK1‐Myc has been described by Halter et al . ( 2014b ). Avr4 was expressed using the pMOG800 construct (Van der Hoorn et al. , 2000 ). P19 (Voinnet et al. , 2015 ), pBIN61‐GUS, pTRV1 (Liu et al. , 2002 , b ), pTRV2: GUS (Tameling and Baulcombe, 2007 ) and pTRV2: NbSERK3a/b (Heese et al. , 2007 ) have been described elsewhere. At BAK1, At BAK1 C408Y and At BAK1 D416N originate from Schwessinger et al. ( 2011 ). GFP‐LTI6b has been described previously (Kurup et al. , 2005 ). At FLS2‐eGFP and Sl FLS2‐eGFP were described by Robatzek et al. ( 2006 , 2007 ). Sl SOBIR1‐cYFP, Sl SOBIR1‐nYFP and Sl Cf‐4‐cYFP (Postma et al. , 2016 ), and pACA8::ACA8‐mCherry, At FLS2‐cYFP and At FLS2‐nYFP (Frei dit Frey et al. , 2012 ), have been described elsewhere.
Plant growth conditions
Nicotiana tabacum (tobacco) (cv. SR1 and cv. Samsun) and N. benthamiana [wild‐type and N. benthamiana stably expressing SlCf‐4 under its native promoter (referred to as N. benthamiana:Cf‐4 ; Gabriëls et al. , 2006 ] were grown under 16 h light at 25 °C and 8 h darkness at 21 °C, with ~75% relative humidity. VIGS in tobacco and N. benthamiana VIGS using TRV‐based vectors was performed in tobacco (cv. Samsun) and N. benthamiana:Cf‐4 as described previously (Liebrand et al. , 2012 ; Zhang et al. , 2013b ). Agrobacterium ‐mediated transient transformation Agrobacterium ‐mediated transient transformations (agroinfiltrations) were performed as described previously (Van der Hoorn et al. , 2000 ). Binary constructs expressing affinity‐tagged proteins were agroinfiltrated with Agrobacterium tumefaciens cultures at an OD 600 of 1 in combination with P19 at an OD 600 of 1, unless indicated otherwise. Leaves were harvested for protein isolation and IP at 2 dpi, unless indicated otherwise. Percentages of HR were quantified by visual scoring for full HR (100%), mildly reduced HR (60%), strongly reduced HR (30%) and no HR (0%). IPs, IB, phosphorylation analysis and MAPK activation analysis IPs and co‐IPs were performed as described previously (Liebrand et al. , 2013 ). To detect phosphorylated proteins, a protein extraction buffer was used as described by Karlova et al . ( 2006 , 2009 ), with minor modifications; instead of Tris and Triton‐X, 100 m m NaPi (pH 7.2) and 1% IGEPAL CA‐630 (NP40) were used, respectively. Pre‐cast TGX gels were used for Pro‐Q and Sypro Ruby analyses (Bio‐Rad, Veenendaal, the Netherlands, #456‐1095). Pro‐Q diamond phosphoprotein gel stains and subsequent Sypro Ruby stains were performed according to the manufacturer’s recommendations (Invitrogen, Life Technologies, Carlsbad, CA, USA; Taylor et al. , 2013 ). TGX stain‐free gels were used for all other protein analyses (Bio‐Rad, #456‐8085), and total protein was visualized using the stain‐free method or with Coomassie Brilliant Blue (CBB). The following antibodies were used for protein detection on IB: αGFP‐HRP (130‐091‐833, MACS antibodies, Bergisch Gladbach, Germany), αMyc (cMyc9E10, sc‐40, Santa Cruz Biotechnology, Heidelberg, Germany), αMouse‐HRP (GE Healthcare, Eindhoven, The Netherlands), anti‐p42/p44‐erk (NEB: Bioké Dellaertweg 9b 2316 WZ, Leiden) and goat anti‐rabbit (Sigma Zwijndrecht, the Netherlands). Band intensities were measured using Image Lab software (Bio‐Rad), and ratios were calculated as indicated in the figures. To quantify immunoprecipitated protein bands, the ribulose‐1,5‐bisphosphate carboxylase/oxygenase (Rubisco) background band in the IP sample was taken as an internal standard for the total protein concentration of the sample.
Protein localization studies Confocal laser scanning microscopy
(CLSM) was performed using a Leica SP5 laser point scanning microscope (Leica Camera AG, Wetzlar, Germany), mounted with hybrid detectors (HyD), as described previously (Beck et al. , 2012 ). For CLSM analysis of eGFP, constructs were transiently expressed in adult tobacco plants by infiltration with Agrobacterium tumefaciens suspensions of OD 600 = 0.3. At 2 dpi, GFP fluorophores were excited using a 488‐nm argon laser and fluorescence emission was captured between 495 and 540 nm. mCherry fluorophores were excited using a 561‐nm argon laser and fluorescence emission was captured between 580 and 620 nm. For GFP‐only images, chloroplast autofluorescence was captured between 700 and 800 nm. For CLSM analysis of bimolecular fluorescence complementation (BiFC, split‐YFP) experiments, cYFP and nYFP constructs were transiently co‐expressed by co‐infiltration of adult N. benthamiana plants using Agrobacterium tumefaciens suspensions, each at OD 600 = 0.3. Reconstituted YFP molecules were excited using a 514‐nm argon laser, and fluorescence emission was captured between 520 and 550 nm. Chloroplast autofluorescence was captured between 700 and 800 nm. Images were taken using a 20× objective (for eGFP) or 40× objective (for YFP), and processed using Leica LAS‐AF and FIJI (ImageJ) software packages.
Supporting information Fig. S1 Kinase activity of SOBIR1 is not required for Cf‐4 stabilization. (A) Transient overexpression of Arabidopsis thaliana ( At )SOBIR1 induces cell death in tobacco and in Nicotiana benthamiana when co‐expressed with P19. Agroinfiltrations were performed at an optical density at 600 nm (OD 600 ) of 1. Where indicated, P19 was also co‐infiltrated at an OD 600 of 1. Photographs were taken at 3 days post‐infiltration (dpi). It should be noted that constitutive immune activity of At SOBIR1 requires its kinase activity. Furthermore, overexpression of Solanum lycopersicum ( Sl )SOBIR1 from the Solanaceous plant tomato does not result in cell death. [See also Wu et al. ( 2018 )]. (B) Co‐expression of wild‐type Sl SOBIR1 as well as kinase‐dead Sl SOBIR1 D473N stabilizes Cf‐4 when co‐expressed in N. benthamiana . It should be noted that the signal of Cf‐4 is increased when overexpressed with both wild‐type and kinase‐dead Sl SOBIR1, and highly increased on co‐expression with P19. Co‐agroinfiltrations of the affinity‐tagged proteins were performed in N. benthamiana leaves at an OD 600 of 1 for each construct. Leaves were harvested at 2 dpi, and subjected to immunoprecipitation (IP) using anti‐green fluorescent protein (anti‐GFP) beads, followed by immune blotting (IB). The ribulose‐1,5‐bisphosphate carboxylase/oxygenase (Rubisco) band of the input shows equal loading. It should be noted that Cf‐4 is only visible in the input when co‐infiltrated with P19. CBB, Coomassie Brilliant Blue. Click here for additional data file. Fig. S2 Kinase‐dead SOBIR1 constitutively forms homodimers in planta. (A) Myc‐tagged versions of At SOBIR1 D489N and Sl SOBIR1 D473N co‐immunoprecipitate with eGFP‐tagged versions of At SOBIR1 D489N and Sl SOBIR1 D473N (asterisks), respectively, and with Cf‐4‐eGFP, but not with Flagellin‐Sensing 2 (FLS2)‐eGFP. Co‐agroinfiltrations of the various affinity‐tagged proteins were performed in combination with P19 in leaves of N. benthamiana at an OD 600 of 0.6 for each construct. Leaves were harvested at 2 dpi, and subjected to IP using anti‐GFP beads, followed by IB. The Rubisco band of the input shows equal loading. It should be noted that, because of the low accumulation levels, not all proteins are visible in the input samples. Click here for additional data file. Fig. S3 At SOBIR1‐mediated immunity is dependent on kinase‐active BAK1. (A) Transient co‐expression of At SOBIR1 in tobacco with At BAK1 C408Y or At BAK1 D416N results in reduced At SOBIR1 constitutive immune activity, when compared with co‐expression of At SOBIR1 with wild‐type At BAK1 or GUS. The indicated constructs were agroinfiltrated at an OD 600 of 0.7. Photographs were taken at 2 dpi, and are representative of the agroinfiltration of eight leaves per sample. (B) Quantification of the percentage of cell death as shown in Fig. 4A. Percentages of constitutive cell death are presented as the mean ± standard error (SE). The letters indicate significant differences at P < 0.05, as determined by one‐way analysis of variance (ANOVA), including a Tukey post hoc test. (C) Quantification of the percentage of hypersensitive response (HR) as shown in Fig. 4B. Percentages of Avr4‐induced HR are presented as mean ± SE. The letters indicate significant differences at P < 0.05, as determined by one‐way ANOVA, including a Tukey post hoc test. Click here for additional data file.
📊 Figures
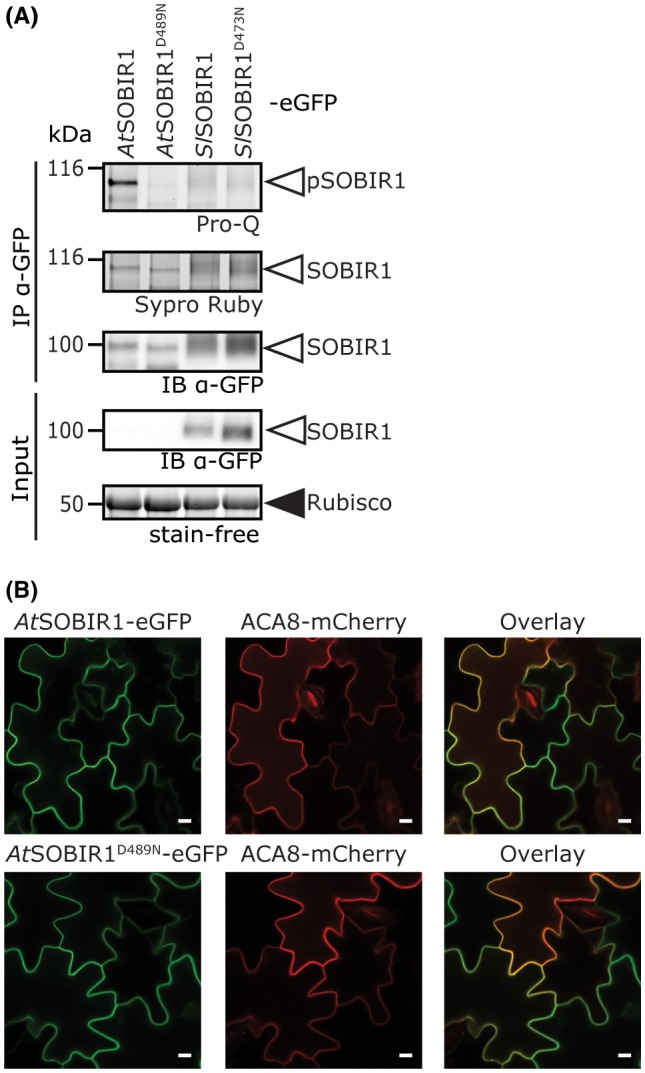
Figure 1
Constitutive immune activity of Arabidopsis thaliana ( At )SOBIR1 positively links with its phosphorylation status. (A) Prou2010Q phosphoprotein staining of immunoprecipitated enhanced green fluoresce...
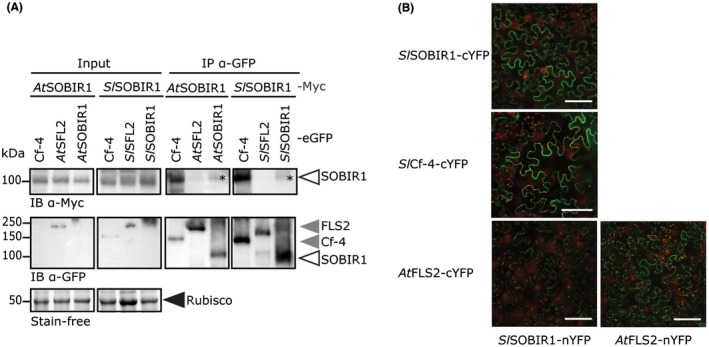
Figure 2
SOBIR1 constitutively forms homodimers inu00a0planta . (A) Mycu2010tagged versions of At SOBIR1 and Sl SOBIR1 cou2010immunoprecipitate with eGFPu2010tagged versions of At SOBIR1 and Sl SOBIR1 (asteris...
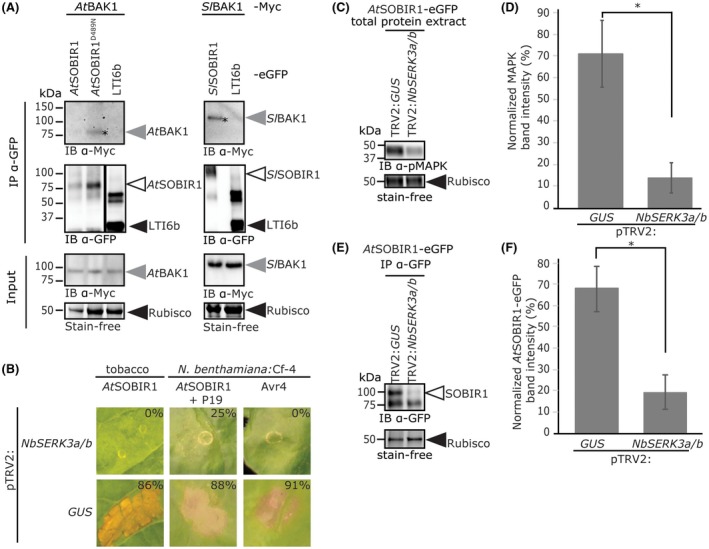
Figure 3
Constitutive immune activity of At SOBIR1 is dependent on BAK1. (A) SOBIR1 constitutively interacts with BAK1. eGFPu2010tagged versions of SOBIR1 and Mycu2010tagged versions of BAK1 were transiently c...
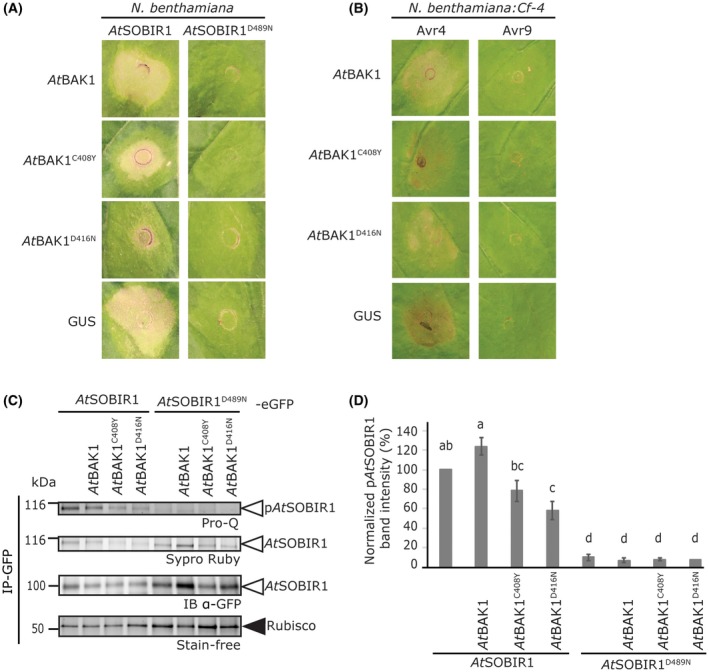
Figure 4
SOBIR1u2010mediated immunity is dependent on kinaseu2010active BAK1. (A) Transient cou2010expression of At SOBIR1 with the At BAK1 C408Y or At BAK1 D416N mutant results in reduced At SOBIR1 constituti...
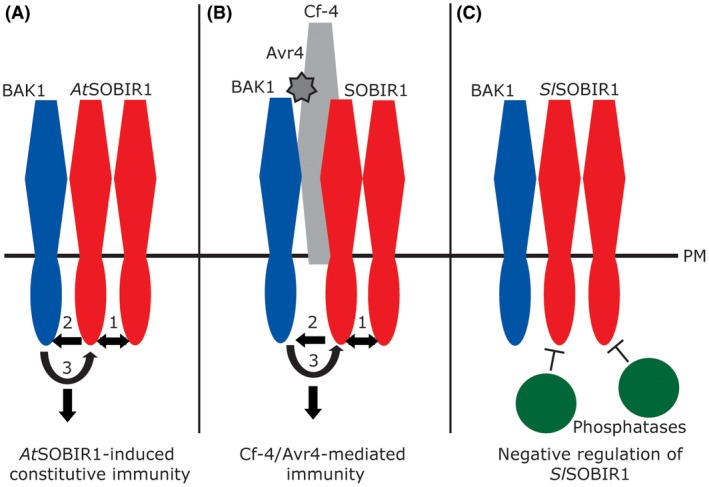
Figure 5
SOBIR1 and BAK1 act together to signal for defence. In this model, we propose that SOBIR1 and BAK1 act together to signal for downstream defence activation. In addition to the transu2010autophosphoryl...
Figure images are served from the NIH/NLM PubMed Central Open Access Subset or Europe PMC; copyright remains with the publishers and authors.
💬 Discussion
0 commentsNo comments yet. Be the first to start a discussion!
Leave a Comment