Abstract
During mitosis in most eukaryotic cells, chromosomes align and form a metaphase plate halfway between the spindle poles, about which they exhibit oscillatory movement. These movements are accompanied by changes in the distance between sister kinetochores, commonly referred to as breathing. We developed a live cell imaging assay combined with computational image analysis to quantify the properties and dynamics of sister kinetochores in three dimensions. We show that baseline oscillation and breathing speeds in late prometaphase and metaphase are set by microtubule depolymerases, whereas oscillation and breathing periods depend on the stiffness of the mechanical linkage between sisters. Metaphase plates become thinner as cells progress toward anaphase as a result of reduced oscillation speed at a relatively constant oscillation period. The progressive slowdown of oscillation speed and its coupling to plate thickness depend nonlinearly on the stiffness of the mechanical linkage between sisters. We propose that metaphase plate formation and thinning require tight control of the state of the mechanical linkage between sisters mediated by centromeric chromatin and cohesion.
🔬 Techniques
💻 Software
✨ Fluorophores
🧪 Sample Preparation
🔬 Cell Lines
🏭 Microscope Brands
🧪 Reagent Suppliers
📷 Detectors
🔎 Objectives
💻 Software Details
🏛️ Research Organizations (ROR)
Affiliated research institutions:
📋 Methods
Generation of stable EGFP–CENP-A HeLa cell line
To obtain a stable EGFP–CENP-A cell line, HeLa cells were transfected with pEGFP–CENP-A–IRESpuro vector (provided by D. Gerlich, ETH Zurich, Zurich, Switzerland) using Fugene 6 (Roche). Cells were grown in DME supplemented with 10% FCS, 100 U/ml penicillin, 100 µg/ml streptomycin, and 500 ng/ml puromycin (Invitrogen) at 37°C with 5% CO 2 in a humidified incubator. To obtain a homogeneous population of cells with respect to the EGFP–CENP-A kinetochore signal, we performed two rounds of manual single-colony selection and screened the clonal populations by visual inspection (Fig. S1).
Fluorescence time-lapse imaging of EGFP–CENP-A HeLa cells
Cells were seeded in dishes (LabTekII; VWR) and imaged in L-15 medium (Invitrogen) supplemented with 10% FCS (Invitrogen). Time points comprised of 20 z sections 0.5 µm apart were acquired every 7.5 s for 5 min (i.e., 41 time points in a video) with a 100× 1.35 NA objective lens (Olympus) and a camera (CoolSnap HQ or HQ2; Photometrics) on an imaging system (DeltaVision Core, Personal, or Spectris; Applied Precision) fitted with a 37°C environmental chamber. Camera pixels were binned (2 × 2), yielding a pixel size of 129 nm in the lateral direction. The 10-µm z stack covered about two thirds of the metaphase plate (Video 1). The acquisition routines in softWoRx (Applied Precision) were used to control all aspects of image data acquisition. Imaging conditions were designed to balance three essential imaging requirements ( Dorn et al., 2008 ): (1) exposing cells to as little light as possible to minimize phototoxicity, (2) obtaining images of sufficiently high signal to noise ratio to allow reliable detection of the EGFP–CENP-A signal, and (3) sampling sufficiently fast to measure unaliased kinetochore motion. (1) Cell viability. Phototoxic effects on cells, as a result of frequent exposure to too much light, can manifest themselves as delayed anaphase timing, i.e., a delay in the time between nuclear envelope breakdown and anaphase onset, as the result of an activation of the spindle checkpoint ( Mikhailov et al., 2002 ). To assess the effect of various 3D imaging protocols on cell viability, we first determined the normal anaphase timing of WT HeLa cells measured by imaging fields of cells exposed to minimal amounts of light. Specifically, cells were imaged every 5 min over 6 h using a 60× 1.4 NA lens (Olympus) with 25-ms exposure, 32% neutral density filter, and seven z sections 1 µm apart. This yielded a reference anaphase timing of ∼34 min ( Fig. 1 , top). To assess the effect of fast 3D imaging on cell viability, we varied exposure time, neutral density filter, recovery times between exposures and a number of imaged time points, and compared the resulting anaphase timing distribution with the reference anaphase timing. We found that an imaging protocol of 15-ms exposure time, 32% neutral density filter, and a sampling rate of one z stack (20 z sections 0.5 µm apart) every 7.5 s for 41 time points (resulting in a video length of 5 min), i.e., a total of 820 exposures per video, ensured that ≥80% of the cells exhibited the normal anaphase timing of ∼34 min. (2) Detection quality. Automated kinetochore detection (see following paragraph) fails to properly distinguish spot signals from noise if the signal amplitude becomes too similar to the noise amplitude. In such a situation, both the number of false positives, i.e., noise peaks that are mistaken for true kinetochore signal, and the number of false negatives, i.e., kinetochore signals that are missed, become large. Thus, it was essential to determine imaging protocols that minimized both false positives and false negatives while maintaining cell viability. The rate of false positives and negatives was estimated for each imaging protocol by taking multichannel images of EGFP–CENP-A cells, in which in each channel a different imaging protocol was used, and comparing the detection results between the different channels. In one channel, high light exposure that led to flawless spot detection was used to provide the detection ground truth (although such high light exposure did not satisfy the cell viability conditions). In the other two channels, light exposures and neutral density filter combinations that were consistent with cell viability were used. The kinetochore signal was detected in all three channels and compared ( Fig. 1 , bottom). With this, we found that imaging with 15-ms exposure and 32% neutral density filter, yielding videos with an average signal-to-noise ratio of 3–4, resulted in
Show full methods section
Generation of stable EGFP–CENP-A HeLa cell line
To obtain a stable EGFP–CENP-A cell line, HeLa cells were transfected with pEGFP–CENP-A–IRESpuro vector (provided by D. Gerlich, ETH Zurich, Zurich, Switzerland) using Fugene 6 (Roche). Cells were grown in DME supplemented with 10% FCS, 100 U/ml penicillin, 100 µg/ml streptomycin, and 500 ng/ml puromycin (Invitrogen) at 37°C with 5% CO 2 in a humidified incubator. To obtain a homogeneous population of cells with respect to the EGFP–CENP-A kinetochore signal, we performed two rounds of manual single-colony selection and screened the clonal populations by visual inspection (Fig. S1).
Fluorescence time-lapse imaging of EGFP–CENP-A HeLa cells
Cells were seeded in dishes (LabTekII; VWR) and imaged in L-15 medium (Invitrogen) supplemented with 10% FCS (Invitrogen). Time points comprised of 20 z sections 0.5 µm apart were acquired every 7.5 s for 5 min (i.e., 41 time points in a video) with a 100× 1.35 NA objective lens (Olympus) and a camera (CoolSnap HQ or HQ2; Photometrics) on an imaging system (DeltaVision Core, Personal, or Spectris; Applied Precision) fitted with a 37°C environmental chamber. Camera pixels were binned (2 × 2), yielding a pixel size of 129 nm in the lateral direction. The 10-µm z stack covered about two thirds of the metaphase plate (Video 1). The acquisition routines in softWoRx (Applied Precision) were used to control all aspects of image data acquisition. Imaging conditions were designed to balance three essential imaging requirements ( Dorn et al., 2008 ): (1) exposing cells to as little light as possible to minimize phototoxicity, (2) obtaining images of sufficiently high signal to noise ratio to allow reliable detection of the EGFP–CENP-A signal, and (3) sampling sufficiently fast to measure unaliased kinetochore motion. (1) Cell viability. Phototoxic effects on cells, as a result of frequent exposure to too much light, can manifest themselves as delayed anaphase timing, i.e., a delay in the time between nuclear envelope breakdown and anaphase onset, as the result of an activation of the spindle checkpoint ( Mikhailov et al., 2002 ). To assess the effect of various 3D imaging protocols on cell viability, we first determined the normal anaphase timing of WT HeLa cells measured by imaging fields of cells exposed to minimal amounts of light. Specifically, cells were imaged every 5 min over 6 h using a 60× 1.4 NA lens (Olympus) with 25-ms exposure, 32% neutral density filter, and seven z sections 1 µm apart. This yielded a reference anaphase timing of ∼34 min ( Fig. 1 , top). To assess the effect of fast 3D imaging on cell viability, we varied exposure time, neutral density filter, recovery times between exposures and a number of imaged time points, and compared the resulting anaphase timing distribution with the reference anaphase timing. We found that an imaging protocol of 15-ms exposure time, 32% neutral density filter, and a sampling rate of one z stack (20 z sections 0.5 µm apart) every 7.5 s for 41 time points (resulting in a video length of 5 min), i.e., a total of 820 exposures per video, ensured that ≥80% of the cells exhibited the normal anaphase timing of ∼34 min. (2) Detection quality. Automated kinetochore detection (see following paragraph) fails to properly distinguish spot signals from noise if the signal amplitude becomes too similar to the noise amplitude. In such a situation, both the number of false positives, i.e., noise peaks that are mistaken for true kinetochore signal, and the number of false negatives, i.e., kinetochore signals that are missed, become large. Thus, it was essential to determine imaging protocols that minimized both false positives and false negatives while maintaining cell viability. The rate of false positives and negatives was estimated for each imaging protocol by taking multichannel images of EGFP–CENP-A cells, in which in each channel a different imaging protocol was used, and comparing the detection results between the different channels. In one channel, high light exposure that led to flawless spot detection was used to provide the detection ground truth (although such high light exposure did not satisfy the cell viability conditions). In the other two channels, light exposures and neutral density filter combinations that were consistent with cell viability were used. The kinetochore signal was detected in all three channels and compared ( Fig. 1 , bottom). With this, we found that imaging with 15-ms exposure and 32% neutral density filter, yielding videos with an average signal-to-noise ratio of 3–4, resulted in
📊 Figures
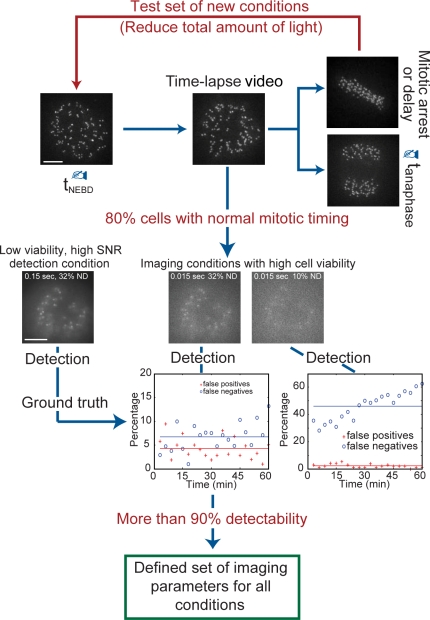
Figure 1.
Live cell assay that maximizes signal-to-noise ratio while minimizing phototoxicity. To define a standardized protocol for our assay, we established a range of imaging conditions that maintained cell ...
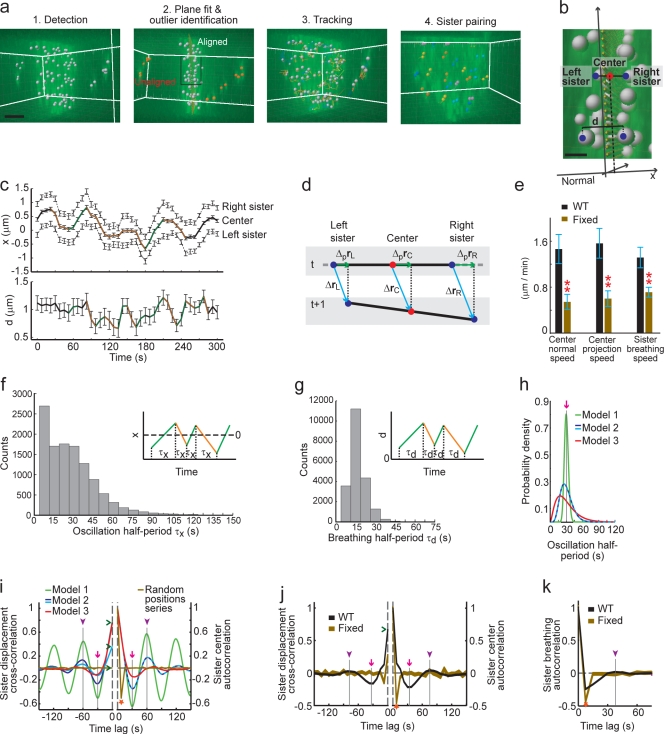
Figure 2.
Automated image analysis and quantitative analysis of sister kinetochore dynamics. (a) The four steps of image analysis to measure sister kinetochore dynamics. White lines show boundaries of the 3D da...
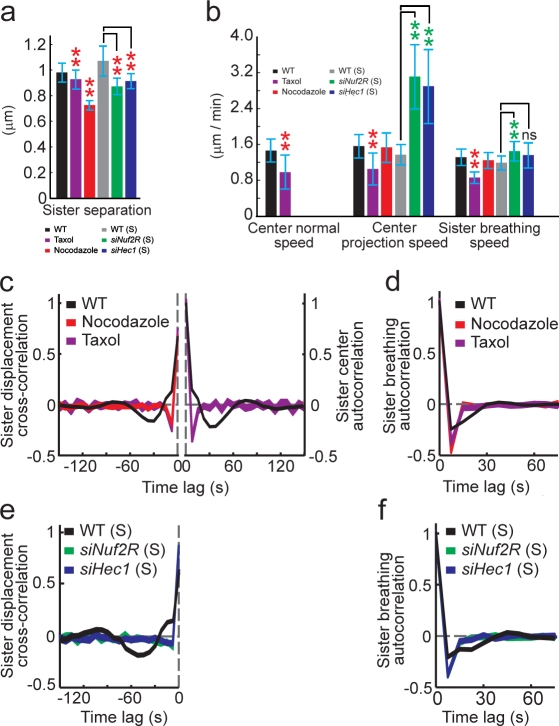
Figure 3.
Nonrandom sister oscillation and breathing require bipolar attachment of kinetochores to dynamic MT plus ends. (a) Sister separation. (b) Sister center normal and projection speeds and sister breathin...
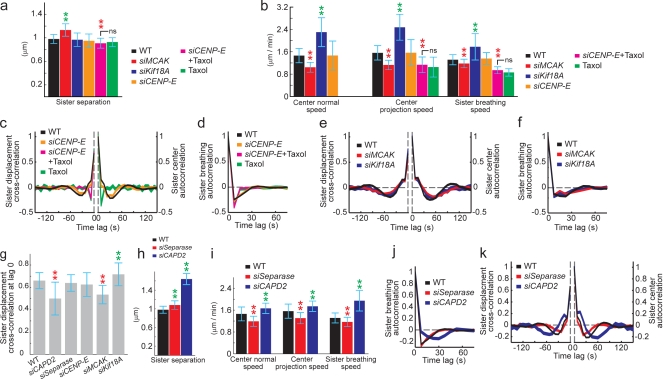
Figure 4.
Depolymerases set oscillation and breathing speeds, whereas sister linkage modulates oscillation and breathing period. (a and h) Sister separation. (b and i) Sister center normal and projection speeds...
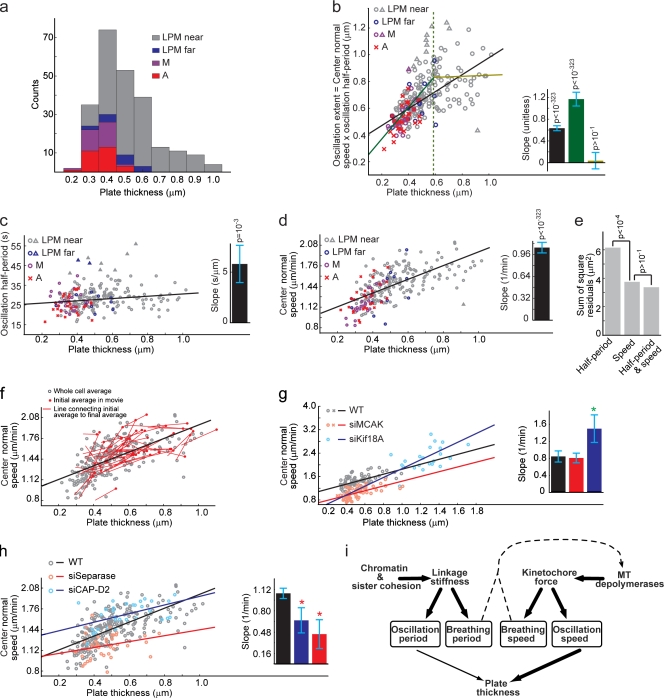
Figure 5.
Metaphase plate thinning in preparation for anaphase is induced by a reduction in oscillation speed. (a) Histogram of average plate thicknesses in individual videos. (b) Scatter plot of oscillation ex...
Figure images are served from the NIH/NLM PubMed Central Open Access Subset or Europe PMC; copyright remains with the publishers and authors.
💬 Discussion
0 commentsNo comments yet. Be the first to start a discussion!
Leave a Comment