Abstract
AbstractMultiphoton microscopy of cellular autofluorescence and second harmonic generation from collagen facilitates imaging of living cells and tissues without the need for additional fluorescent labels. Here, a compact multiphoton endomicroscope for label‐free in vivo imaging in small animals via side‐viewing needle objectives is presented. Minimal invasive imaging at cellular resolution is performed in colonoscopy of mice without surgical measures and without fluorescent dyes as a contrast agent. The colon mucosa is imaged repeatedly in the same animal in a mouse model of acute intestinal inflammation to study the process of inflammation at the tissue level within a time period of ten days, demonstrating the capabilities of label‐free endomicroscopy for longitudinal studies for the first time.
🔬 Techniques
🧪 Sample Preparation
🏭 Microscope Brands
🧪 Reagent Suppliers
📷 Detectors
💻 Software Details
🏛️ Research Organizations (ROR)
Affiliated research institutions:
📋 Methods
Multiphoton Endomicroscope : The setup was entirely mounted on a 19″ transport rack, including laser, electronics, PC, monitor, and optics, thus making the endomicroscope portable to clinics and laboratories for in vivo studies. The optical components of the endomicroscope were set up on the top plate of the rack on an optical breadboard (45 × 45 cm), as shown schematically in Figure 2 . The laser was a compact, high‐power, mode‐locked fiber laser (Carmel, Calmar Laser, Palo Alto, USA), covering two high units on the rack. The laser head (18 × 9 cm) was placed on the breadboard and delivered a collimated free‐space propagating beam of up to 500 mW at 780 nm. The laser emitted pulses of 80 fs pulse duration (full width at half maximum (FWHM)) at a repetition rate of 50 MHz. A low reflectivity shutter (SHB1T, Thorlabs, Newton, USA) was installed at the exit aperture of the laser and controlled remotely via software. For fast shifting of the focal plane, an ETL (Optotune AG, Dietikon, Switzerland) was integrated into the setup. The focal length of the ETL was tunable between f = 202 mm and f = 36 mm, depending on the actuating current. In combination with a concave lens ( f = −50 mm), the ETL formed a threefold beam telescope. Behind the ETL, the laser beam was centered onto a pair of galvanometric mirrors (6210H, Cambridge Technology, Bedford, MA), which were used for lateral scanning. Two telecentric lenses with short effective focal lengths represented scan lens (LSM02‐BB, EFL = 18 mm, Thorlabs) and tube lens (LSM03‐BB, EFL = 36 mm, Thorlabs) in a 4f‐configuration expanding the beam twofold. A 10× objective (Plan Fluorite RMS10X‐PF, Olympus, Tokyo, Japan) with numerical aperture of N.A. = 0.3 was used to focus and point‐scan the laser in the back focal plane of the endoscope objective. Several endoscope objectives were manufactured from GRIN lenses. In particular, two designs had been calibrated that are displayed in this article: a standard GRIN objective with straight view (NEM‐100‐25‐10‐860‐DL‐ST, Grintech, Jena, Germany), and an in‐house designed GRIN objective with mirror prism for side view. This side‐view GRIN objective was a combination of two laser focusing rod lenses (GT‐LFRL‐100‐125‐20‐NC and GT‐LFRL‐100‐013‐50‐NC, Grintech, Jena, Germany) as relay and objective lenses, respectively. Side‐view imaging was realized by a 1 mm sized prism, which was glued to the front of the objective lens. In either case, the GRIN objective served as main component of the rigid endoscope head that was inserted into the animal. The distance between GRIN and coupling objective was set up such that the focal range started at the prism surface and extended into the tissue (Figure 2 B). AF and SHG signals from the tissue were collected by the endoscope objective and guided back through the 10× objective. A dichroic beam splitter (HC 705 LP, Semrock, Rochester, NY, USA) was installed between the beam expander and the objective in order to filter all wavelengths above 705 nm. Light with shorter wavelength was reflected to the detection arm, mainly consisting of a filter cube with appropriate filters and photomultiplier tube (PMT) modules. The foremost filter (ET680SP‐2P8, Chroma, Bellow Falls, VT, USA) was used to block additional residues of the excitation wavelength at 780 nm. Subsequently, a beam splitter was used to split the signal to two imaging channels. However, the system can be further extended to a three channel imaging system by the use of a second beam splitter, a third photomultiplier tube (PMT), and the corresponding combination of filters. The results presented here were recorded with a dichroic beam splitter at 495 nm (HC BS 495, Semrock), and the two filters (525/50 HC and 387/11 BrightLine HC, Semrock) were chosen in order to target AF of NADH and FAD in the range of 500–550 nm and the SHG signal at 390 nm. Finally, a photomultiplier tube ( H10770 ‐40, Hamamatsu, Japan) with associated preamplifiers detected the signals in each channel.
Show full methods section
Multiphoton Endomicroscope : The setup was entirely mounted on a 19″ transport rack, including laser, electronics, PC, monitor, and optics, thus making the endomicroscope portable to clinics and laboratories for in vivo studies. The optical components of the endomicroscope were set up on the top plate of the rack on an optical breadboard (45 × 45 cm), as shown schematically in Figure 2 . The laser was a compact, high‐power, mode‐locked fiber laser (Carmel, Calmar Laser, Palo Alto, USA), covering two high units on the rack. The laser head (18 × 9 cm) was placed on the breadboard and delivered a collimated free‐space propagating beam of up to 500 mW at 780 nm. The laser emitted pulses of 80 fs pulse duration (full width at half maximum (FWHM)) at a repetition rate of 50 MHz. A low reflectivity shutter (SHB1T, Thorlabs, Newton, USA) was installed at the exit aperture of the laser and controlled remotely via software. For fast shifting of the focal plane, an ETL (Optotune AG, Dietikon, Switzerland) was integrated into the setup. The focal length of the ETL was tunable between f = 202 mm and f = 36 mm, depending on the actuating current. In combination with a concave lens ( f = −50 mm), the ETL formed a threefold beam telescope. Behind the ETL, the laser beam was centered onto a pair of galvanometric mirrors (6210H, Cambridge Technology, Bedford, MA), which were used for lateral scanning. Two telecentric lenses with short effective focal lengths represented scan lens (LSM02‐BB, EFL = 18 mm, Thorlabs) and tube lens (LSM03‐BB, EFL = 36 mm, Thorlabs) in a 4f‐configuration expanding the beam twofold. A 10× objective (Plan Fluorite RMS10X‐PF, Olympus, Tokyo, Japan) with numerical aperture of N.A. = 0.3 was used to focus and point‐scan the laser in the back focal plane of the endoscope objective. Several endoscope objectives were manufactured from GRIN lenses. In particular, two designs had been calibrated that are displayed in this article: a standard GRIN objective with straight view (NEM‐100‐25‐10‐860‐DL‐ST, Grintech, Jena, Germany), and an in‐house designed GRIN objective with mirror prism for side view. This side‐view GRIN objective was a combination of two laser focusing rod lenses (GT‐LFRL‐100‐125‐20‐NC and GT‐LFRL‐100‐013‐50‐NC, Grintech, Jena, Germany) as relay and objective lenses, respectively. Side‐view imaging was realized by a 1 mm sized prism, which was glued to the front of the objective lens. In either case, the GRIN objective served as main component of the rigid endoscope head that was inserted into the animal. The distance between GRIN and coupling objective was set up such that the focal range started at the prism surface and extended into the tissue (Figure 2 B). AF and SHG signals from the tissue were collected by the endoscope objective and guided back through the 10× objective. A dichroic beam splitter (HC 705 LP, Semrock, Rochester, NY, USA) was installed between the beam expander and the objective in order to filter all wavelengths above 705 nm. Light with shorter wavelength was reflected to the detection arm, mainly consisting of a filter cube with appropriate filters and photomultiplier tube (PMT) modules. The foremost filter (ET680SP‐2P8, Chroma, Bellow Falls, VT, USA) was used to block additional residues of the excitation wavelength at 780 nm. Subsequently, a beam splitter was used to split the signal to two imaging channels. However, the system can be further extended to a three channel imaging system by the use of a second beam splitter, a third photomultiplier tube (PMT), and the corresponding combination of filters. The results presented here were recorded with a dichroic beam splitter at 495 nm (HC BS 495, Semrock), and the two filters (525/50 HC and 387/11 BrightLine HC, Semrock) were chosen in order to target AF of NADH and FAD in the range of 500–550 nm and the SHG signal at 390 nm. Finally, a photomultiplier tube ( H10770 ‐40, Hamamatsu, Japan) with associated preamplifiers detected the signals in each channel.
Data
Acquisition and Software Control : The endomicroscope was controlled by a scan software with a graphical user interface (GUI) developed and implemented in‐house using MATLAB. The software controlled the shutter, the ETL, as well as the galvanometric scanner, and enabled several different scan modalities such as uni‐ or bidirectional scanning, frame or line averaging, and a two‐layer scan. Furthermore, it received the data from the PMT modules, reconstructed the images, and saved them as bioformat files (OME.TIF), supplemented by all relevant metadata. The communication between the GUI and the endomicroscope was established by a multifunction data acquistion module (PXIe‐6366, National Instruments, Austin, TX, USA). The card provided two analog outputs that were used to control the galvanometric scan mirrors. Simultaneously, two analog inputs were used for the detected signal from the photomultipliers. The ETL was controlled by a programmable DC power supply (PXI‐4110, National Instruments) that communicated with the MATLAB software. The presented 3D reconstructions had been rendered by the “3D Viewer” plugin in ImageJ after image registration and size adjustment to obtain cubic voxels. Optical Characterization : The optical performance of the endomicroscope and effects of the ETL were characterized by measuring the resolution using 30 nm sized fluorescent beads (L5155, Sigma‐Aldrich, St. Louis, MO), embedded in 1% agarose. All measurements were based on the FWHM of the intensity profiles (Figure 2 C). The axial focal position of the system with respect to the ETL was calibrated using sub‐resolution beads imaged at multiple z ‐positions in steps of 5 µm, by using a mechanical stage. At every step, a full range z ‐scan was performed via the ETL. An intensity profile across the acquired z ‐stack allowed to find the location of the focal plane. This location was correlated to the electrical current controlling the ETL, as seen in Figure 2 B. The results were used as a look‐up table in the software to calibrate ETL current values to distance values with respect to the last surface of the GRIN objective. The axial resolution was characterized with the same procedure; a full z ‐scan of subresolution beads was performed each time after mechanically moving the beads by 5 µm. The intensity profile was extracted across the axial direction and the FWHM of the Gaussian profile was estimated to be the axial resolution R z . The lateral resolution at the corresponding focal positions of the ETL was deduced from an x–y scan of the focal plane wherein several beads were imaged. An intensity profile across each bead was extracted and the respective FWHM was deduced. The averaged FWHM across all beads in the frame was taken to be R xy . The effect of the ETL on the resolution is displayed in Figure 2 C. From the results, it was clear that the ETL had a significant effect on the axial resolution with 15–30 µm for the front‐view GRIN and 30–60 µm for the side‐view objective. Compared to that, the effect on the lateral resolution is only minor, varying between 0.9 and 1.2 µm for front view and 2.2–2.5 µm for side view. This behavior represents the performance of ETL configurations and can be explained by aberrations induced by the ETL, 30 which prevent diffraction‐limited performance. In Vivo Mouse Colonoscopy and Colitis Model : All animal experiments were conducted at the Department of Internal Medicine 1, University Hospital Erlangen, in compliance with all institutional guidelines. Throughout the entire session, the animals were anesthetized using a gas mixture of 5 L min −1 O 2 containing 2–4% of isoflurane administered by an anesthetic unit (Isoflurane Vaporizer TEC 3 and Oxyvet oxygenation unit, Eickemeyer, Tuttlingen, Germany). The colon was flushed several times with water prior to the colonoscopy in order to remove remaining excrement residuals. Conventional white light wide‐field endoscopy was performed on a commercial rigid endoscopy system (COLOVIEW Mainz, KARL STORZ Endoscopes, Tuttlingen, Germany). Label‐free multiphoton imaging was carried out on the custom endomicroscope engineered for the present study. Fluorescent markers were not used. Acute colitis was induced in C57Bl/6 mice by providing 2% DSS (MP Biomedicals LCC, Canada) in the drinking water, as previously described. 31 Imaging of Mouse Organs : To confirm the general applicability of label‐free endomicroscopy, fresh tissue was also analyzed from other organs, such as kidney, liver, and spleen ex vivo (Figure 4 ). The organs were surgically removed and were minimally cut at about 3 mm length, allowing access to the outside and the inside of the tissue. The organs were investigated by placing them on a sample holder below the GRIN objective with the prism surface facing downward and being in direct contact with the sample. The time delay between measurement and surgical removal of the samples was less than 10 min and the organs had not been cooled, fixed, labeled, or treated in any way.
📊 Figures
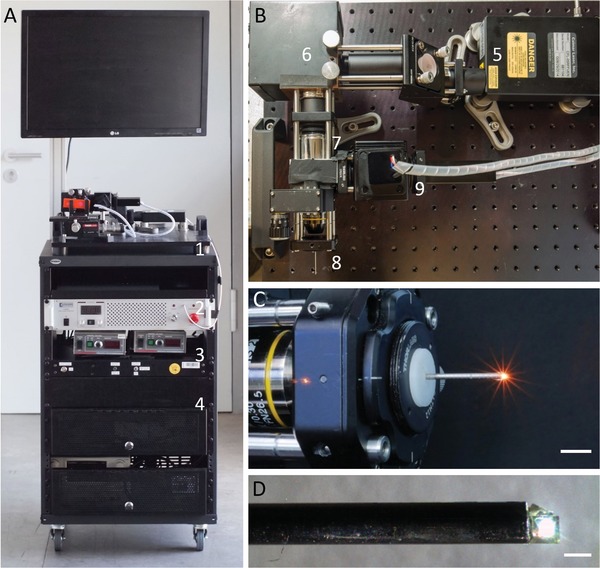
Figure 1
Multiphoton endomicroscope in a compact customu2010built setup. A) Transportable standalone system including (1) scanning microscope, (2) laser, (3) electronics, and (4) PC. B) Top view of the endomic...
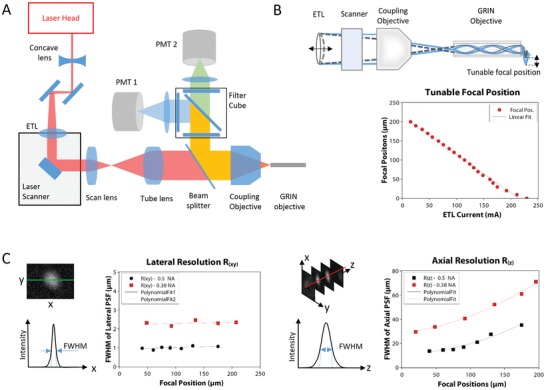
Figure 2
Optical setup and performance. A) Schematic drawing of the optical path from laser head to endoscope objective and back to PMT detectors. See Experimental Section for further details. B) Illustration ...
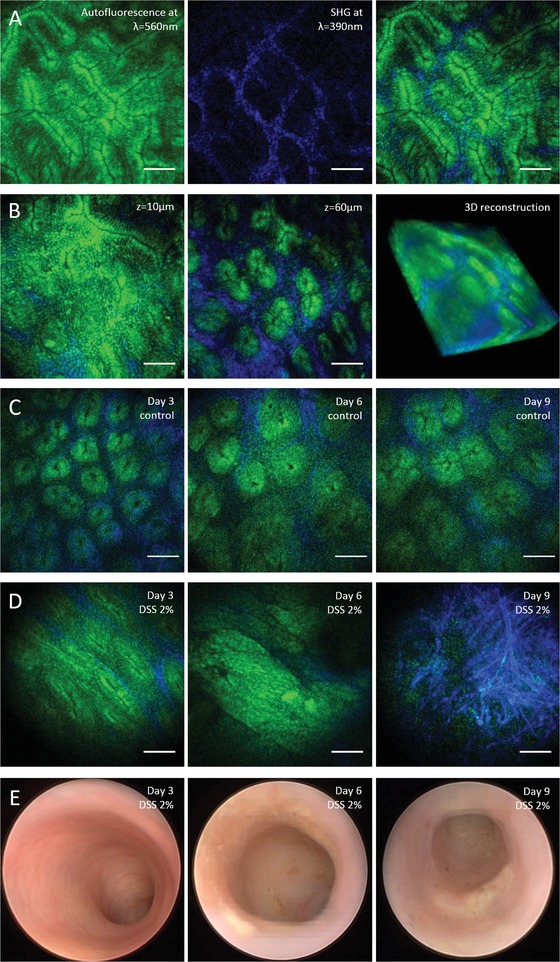
Figure 3
Labelu2010free multiphoton endomicroscopy of murine colon mucosa in vivo. A) Twou2010photon excited AF from endogenous molecules such as NADH or FAD (shown in green) and SHG from collagenu2010I (shown...
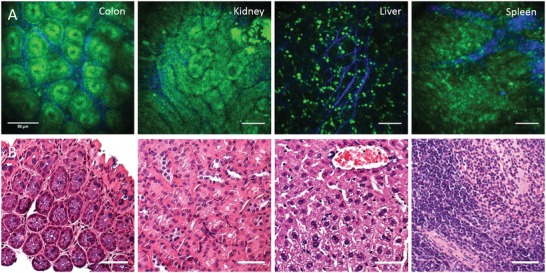
Figure 4
Labelu2010free endoscopic imaging of different organs ex vivo. A) Murine organs imaged ex vivo through a sideu2010view endomicroscope objective. B) Histological sections stained with haematoxylin and ...
Figure images are served from the NIH/NLM PubMed Central Open Access Subset or Europe PMC; copyright remains with the publishers and authors.
💬 Discussion
0 commentsNo comments yet. Be the first to start a discussion!
Leave a Comment